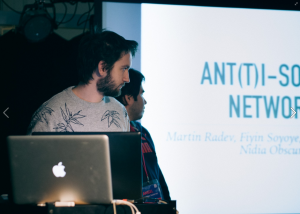
Team members:
- Martin Radev – Programmer
- Nidia Obscura – Innovator/Analyst
- Fiyinfoluwa Soyoye – Programmer
- Angel Gallegos – Programmer
Concept description:
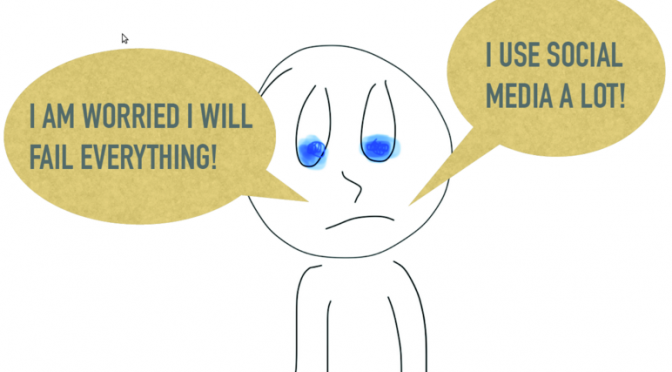
We came up with a solution to solve the problem of youth distraction by specific social media sites. We looked at statistics on the usage of social media by young adults and we discovered that people under the age of 30 use social media for up to 4 hours a day and teenagers use these media for an astounding 9 hours a day.
While this was disturbing enough, we realized that it wasn’t the main problem. The main problem was that 13-year-olds can check Facebook alone up to 100 times in a single day. This implied that youth check social media so often that they never really focus on a specific task such as studying or even having fun with their friends.
Our target was the youth who were getting so easily distracted and unfocused because of such destructive habits, including ourselves. Actually, the idea came up after talking about our own personal problems with the nowadays technology.
We aimed to solve the problem by creating an web app that could easily be installed on a web browser and track the usage of the most commonly abused social media. From our own personal experience, we knew that most people don’t realize that they use Facebook or Twitter as much as they do.
The special value of the app was that we didn’t try to limit people’s access and usage of social media. Instead, we provided them with concise and clear data on their personal usages. We believe that limiting people will only lead to them trying to beat our system and ultimately uninstalling the app. By simply providing them with helpful knowledge, they can take this knowledge and change their own habits, improve their lives and have more meaningful interactions with the world.
Prototyping
Our prototype was a complete chrome app paired with a functioning server and a website that displayed personal usage data.
When designing our prototype, we came up with a use case called Antti. Antti is a 19-year-old boy who was having trouble getting good grades in his first year of university because he could not focus.
He would spend hours studying but realize that it was all a waste. By using our app, he quickly noticed that when studying, he checked Facebook every 6 minutes. With that realization, he was able to train himself to concentrate and ultimately do better at university.
Below, we have included pictures of the website that we designed and the graphs displaying real usage data.
Website homepage:

User statistics example:

Technical description:
In our implementation we decided to split the work into three main parts: Creating a browser extension for logging the user behaviour, a server that collects all users data for further processing and a web interface that shows the user their user statistics and habits.
The browser extension logs the web domains visited by the user, device or browser used, and the timestamp of the time he started and finished using it. At this point of the implementation, the extension was only implemented for Firefox but planned to be implemented also in Chrome browser and in the future even on Android so the app covers the main devices used by young people.
On the server side, we created a dummy server in heroku that received the logs extracted by the extension and store them into a database. The server was available to any user at the end of the hackathon but it was missing a login implementation, therefore, it only was able to create statistics for one user.
Once we collected and created some dummy readings from the user, we process them and show them into a bar and pie charts for the user. The user visits his main page where the user is supposed to select a timeframe he/she is interested to know about. For instance, it can be a day, a week or a month. Once selected, the server collects the related registries for the timeframe and create the charts. The bar chart shows the main domain activities during the timeframe, for instance, in a day it shows the domains where the users spend their time the most during every two hours. The pie chart shows the domains where the user spent the most in the given timeframe.
On the data processing, we only were able to implement simple time analysis but it was expected to include more complex analysis. Such analysis includes the times you are using the most some domains, the mean intervals between each visit, for how long you visit them, etc. Once included, it would allow the user to infer why such behaviours and why during those times. Also, it would allow us to give some feedback if the user is expecting to get rid of some bad habits. For instance, if he wants to reduce the time he spend in “Facebook”, it would be possible to show him/her the progress on this task.
The tools used were:
- Heroku
- Flask
- Python
- Javascript
- ChartJS
The implementation we tried to use tools that we were familiar with but we did not know in detail. That is, our purpose was to learn something at the same time we were creating our solution. For example, the initial plans include using libraries from python we know but, we did not know how to use it on a web-server. We decided to use flask framework since we have heard about it but not use it in detail. We also decided to use Heroku since we needed to have available the server from any device and deploying our implementation to Heroku allowed us to do it. At the same time, we initially expected to create the extension for Chrome but since it seemed easier to do it in Firefox, we went that way.
Technically, the most important decisions were defining the scope of the project due to time limitations. For instance, we expected to implement it in a web-browser and android but, we decided to have it working at least on the web browser before moving on to a mobile device. Also, we started creating a login page for allowing different users to have their statistics but, spending much time on it would be useless since it was only a prototype.