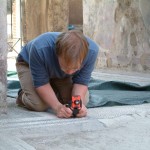
The measurement documentation of the project is divided in two partly joining parts: The top plan measurements with a tachymeter and the photogrammetrical documentation of the structures.

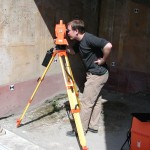
The top plan measurements have been conducted during all field seasons. During the 2002 season the emphasis was on the building of the control point network and only a little of the new top plan data was measured. The field season 2003 consisted mainly of the top plan measurements in the area of the House of Marcus Lucretius. During the field season 2004 the measurement activities were done in the houses around ML and afther the 2004 season about half of the visible structures of the insula have been measured.

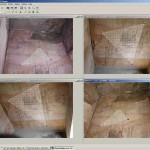
The photogrammetric documentation was originally supposed to support the wall painting team and the top plan measurements. The main emphasis moved during the 2003 season to help the wall painting team by producing the rectified and scaled printouts of the wall painting areas. These made the wall painting documentation process faster and easier.
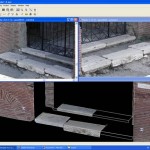
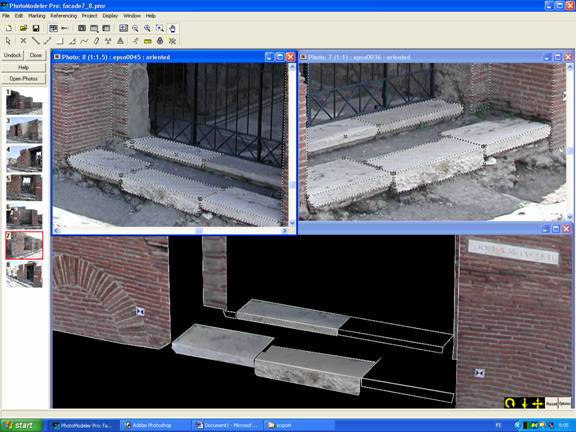
The models, which were based on the photographs taken from the different sides of the same target, could be tied to the same coordinate system with the tachymeter measurements by measuring the signal points visible in the images, with the tachymeter. thus the images and the models form a kind of an ”archive”, from which one can check and measure the visible features afterwards, although they would have actually crumbled away in the reality.