Week 1: Thematic Map Creation
During the first week’s discussion, we talked about the influence of art on cartography both historically and in modern times. We concluded that in previous times, art had a stronger influence as maps were made by hand, requiring collaboration among skilled craftsmen. Maps were also viewed as pieces of art, necessitating significant effort and skill. Modern cartography, however, is more practical and less artistic due to computer-generated maps.
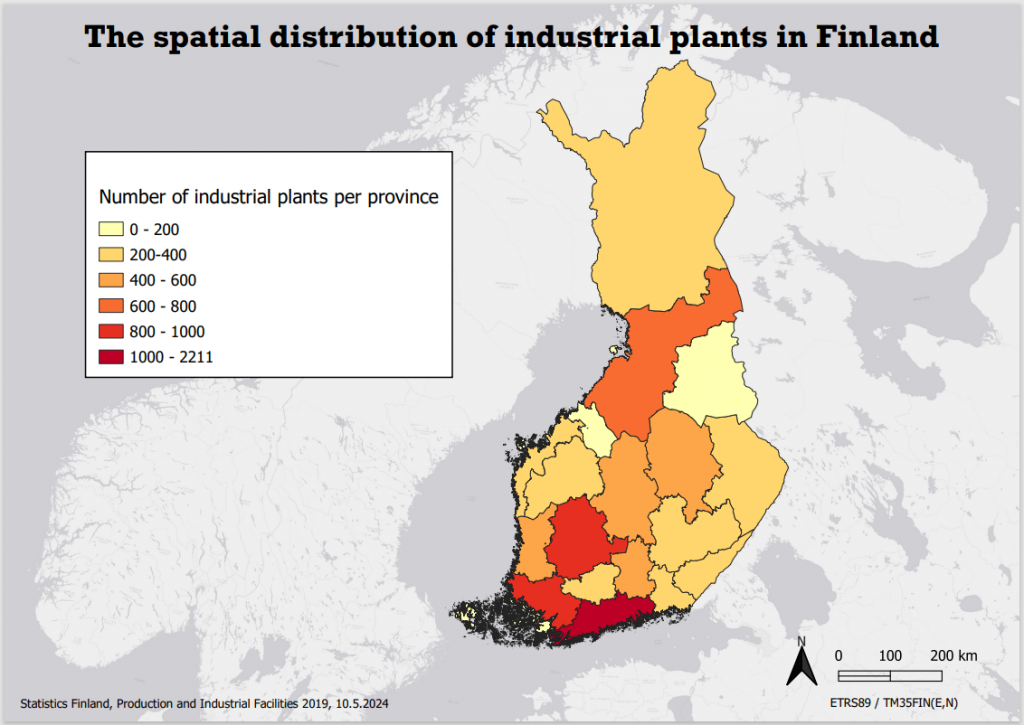
Thematic map creation was done using Statistics Finland data on production and industrial facilities, with Finland’s provinces from avoindata.fi. (Map 1) The color ramp chosen was yellow-red for its informativeness and suitability for colorblind viewers. The ESRI Gray (light) base-map was used for its neutrality, and ETRS89 / TM35FIN CRS was applied. The map followed a standard QGIS visualization with minor adjustments to fonts, scale bar, north arrow, and legend properties.
Week 2: Visual Hierarchy and Color Theory
This week’s lecture and discussion focused on visual hierarchy and color theory. We learned about the implications of colors and how different colors are associated with various meanings. In our discussion, we talked about color associations, like red being negative or leftist and green associated with nature.
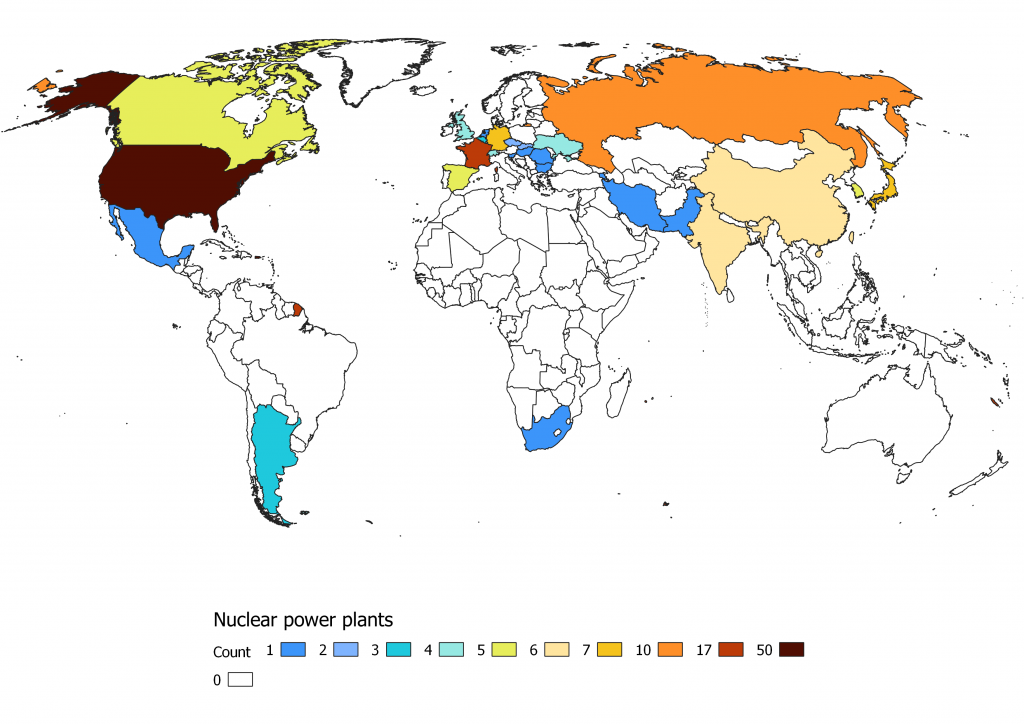
For my map, I used the Robinson world projection, a compromise projection minimizing polar distortion. (Map 2) Despite some color and legend issues, the map effectively highlights the dominance of the USA with 50 nuclear power plants and the lack of nuclear power in most of Africa and all of Australia. The map did not include a scale bar or north arrow as they were deemed unnecessary. After closer inspection the map had a number of issues like Finland not having any nuclear plants and the color ramp was poorly chosen, but I had some time-management issues during this exercise.
Week 3: Creative Mapping Process
The third week’s lecture introduced a new workflow for creating maps. During the discussion session, we worked in groups to brainstorm and select the best visualization ideas. Our group focused on mapping rent price changes in cities, emphasizing the importance of creativity and group collaboration. This method can be applied to the final course assignment by sketching and brainstorming ideas for data visualization. The lecture encouraged innovative visualization methods beyond traditional mapping.
We were also tasked to think of ways to visualizing spatial data without maps. I chose word clouds. A word cloud could for example display the frequency of words associated with the hashtag Helsinki from social media data, providing a visual summary of public sentiment of Helsinki.
Week 4: Future of Cartography and Interactive Maps
In the final week, we discussed the future of cartography, particularly the impact of AI. Opinions varied on whether AI poses a threat to data privacy or can enhance ethical mapping practices. We also considered the effects of improved technology on data availability, with arguments for and against increased open-source data in the future.
I created a basic bar plot of flying squirrel sightings in Uusimaa province using the DataPlotly plugin in QGIS, though I faced labeling issues. Additionally, I produced an interactive map showing squirrel sightings per municipality, using green to create positive associations. The map allows users to click on municipalities for detailed information, though there were challenges with hover features and basemap details.
In conclusion, the weekly reflections covered the evolution of cartography from artistic influences to modern technological challenges and future possibilities. Each week’s exercise provided practical experience in map creation and highlighted the importance of creativity and the potential of modern technologies in cartography.