For my portfolio, I used data from GBIF (Global Biodiversity Information Facility). https://www.gbif.org
Sightings:
I downloaded data on (Nyctereutes procyonoides) occurrences from 1980 to 2024 which were positioned in Finland. The data was in CSV format and included coordinates for each sighting.
The data with the same settings was also downloaded about (Calidris pugnax). From 1980 to 2024 positioned in Finland and including all sightings.
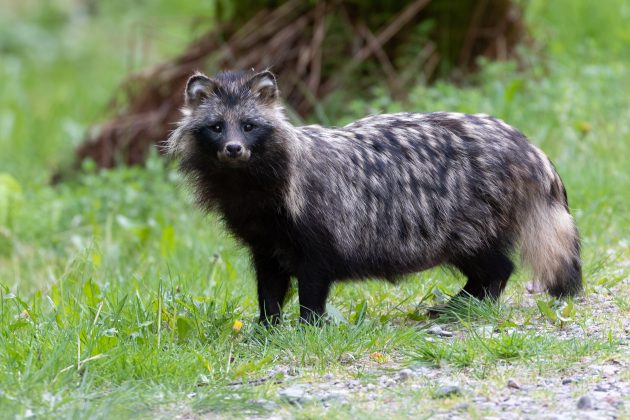
The raccoon dog has been designated as a harmful invasive species throughout the entire EU (Vieraspeto, 2024). The raccoon dog is a carnivorous animal (Carnivora) belonging to the dog family (Canidae), originally from Asia. The raccoon dog is omnivorous, with a varied diet that includes small mammals, frogs, bird eggs, various plant foods, and garbage. Raccoon dogs thrive in various habitats and are mostly active at night (Vieraspeto, 2024).
Image 1. A raccoon dog by:Tomas Kansanaho
The raccoon dog originally comes from Southeast Asia. It was initially brought to Finland to be farmed for its fur. Still, the current wild population originates from individuals that spread into Finland from the area of the former Soviet Union across the eastern border of Finland (Vieraspeto, 2024). Currently, the raccoon dog is common throughout the country, except in the northernmost part of Lapland.
Video 1. Spatiotemporal distribution of raccoon dog sightings in Finland
The video illustrates the spread of raccoon dog sightings in Finland from 1980 to 2022. The animation shows the geographic expansion of the raccoon dog population over the years. The map video provides a visual representation of how the raccoon dog has established itself throughout Finland, with concentrations in southern Finland. The notable thing is that when coming nearer the current year we see a increase of sightings also in Lapland. Even though raccoon dog isn’t common in Lapland it has been expanding it’s habitat to there as well.
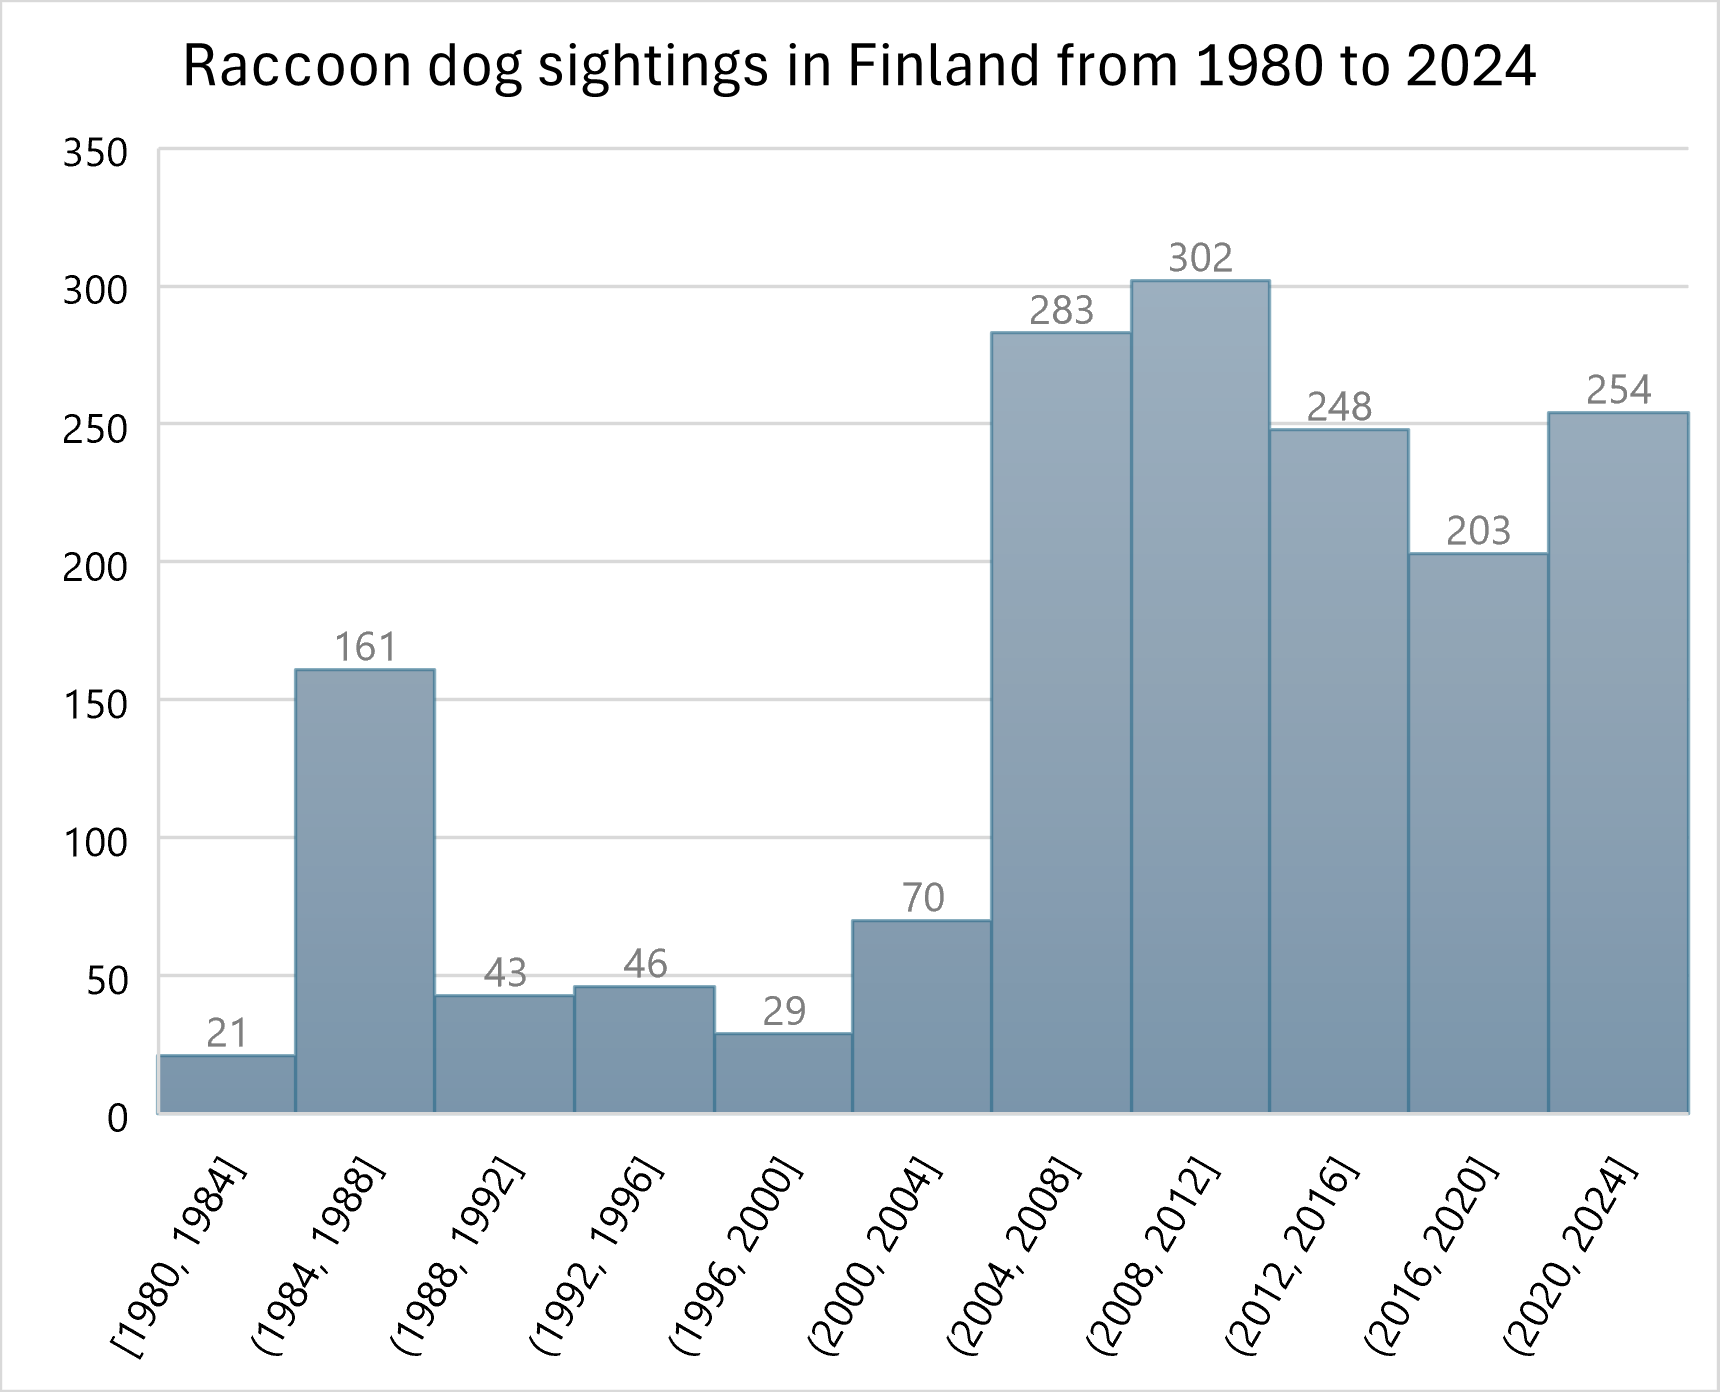
In the early years (1980s), sightings are localized, with few clusters indicating limited spread. As the video progresses into the 1990s and 2000s, the raccoon dog sightings increase and spread to larger areas. One thing to take into consideration is the way the data is produced. As the data is based on sightings made by people they are more clustered around big cities as there are more people making those sightings. The amount of sightings recorded also varies quite a lot trough the years (Plot 1) which can mean changes in estimated raccoon dog population is actually just variation how much people have officially recorded sightings to GBIF.
Plot 1. The number of raccoon dog sightings from 1980 to 2024
Ecological Impact
The raccoon dog is an opportunist that takes advantage of whatever food is available at any given time. In the autumn, it often eats berries, insects, and carrion (Vieraspeto, 2024). During the breeding season in spring and summer, the raccoon dog poses a significant threat to ground-nesting birds, as there is not much alternative food available in nature (Vieraspeto, 2024). At this time, bird eggs and chicks serve as its main food sources.
The raccoon dog particularly threatens endangered species in bird wetlands and coastal meadows. In open landscapes, ground-nesting species are easy prey for it (Vieraspeto, 2024). This is especially pronounced in areas with dense raccoon dog populations, where bird nests on the ground have little chance of success. A pair of raccoon dogs can destroy dozens of nests in a coastal meadow without the nests significantly contributing to the raccoon dogs’ overall diet (Vieraspeto, 2024). A nest of eggs is practically just a snack for the raccoon dog.
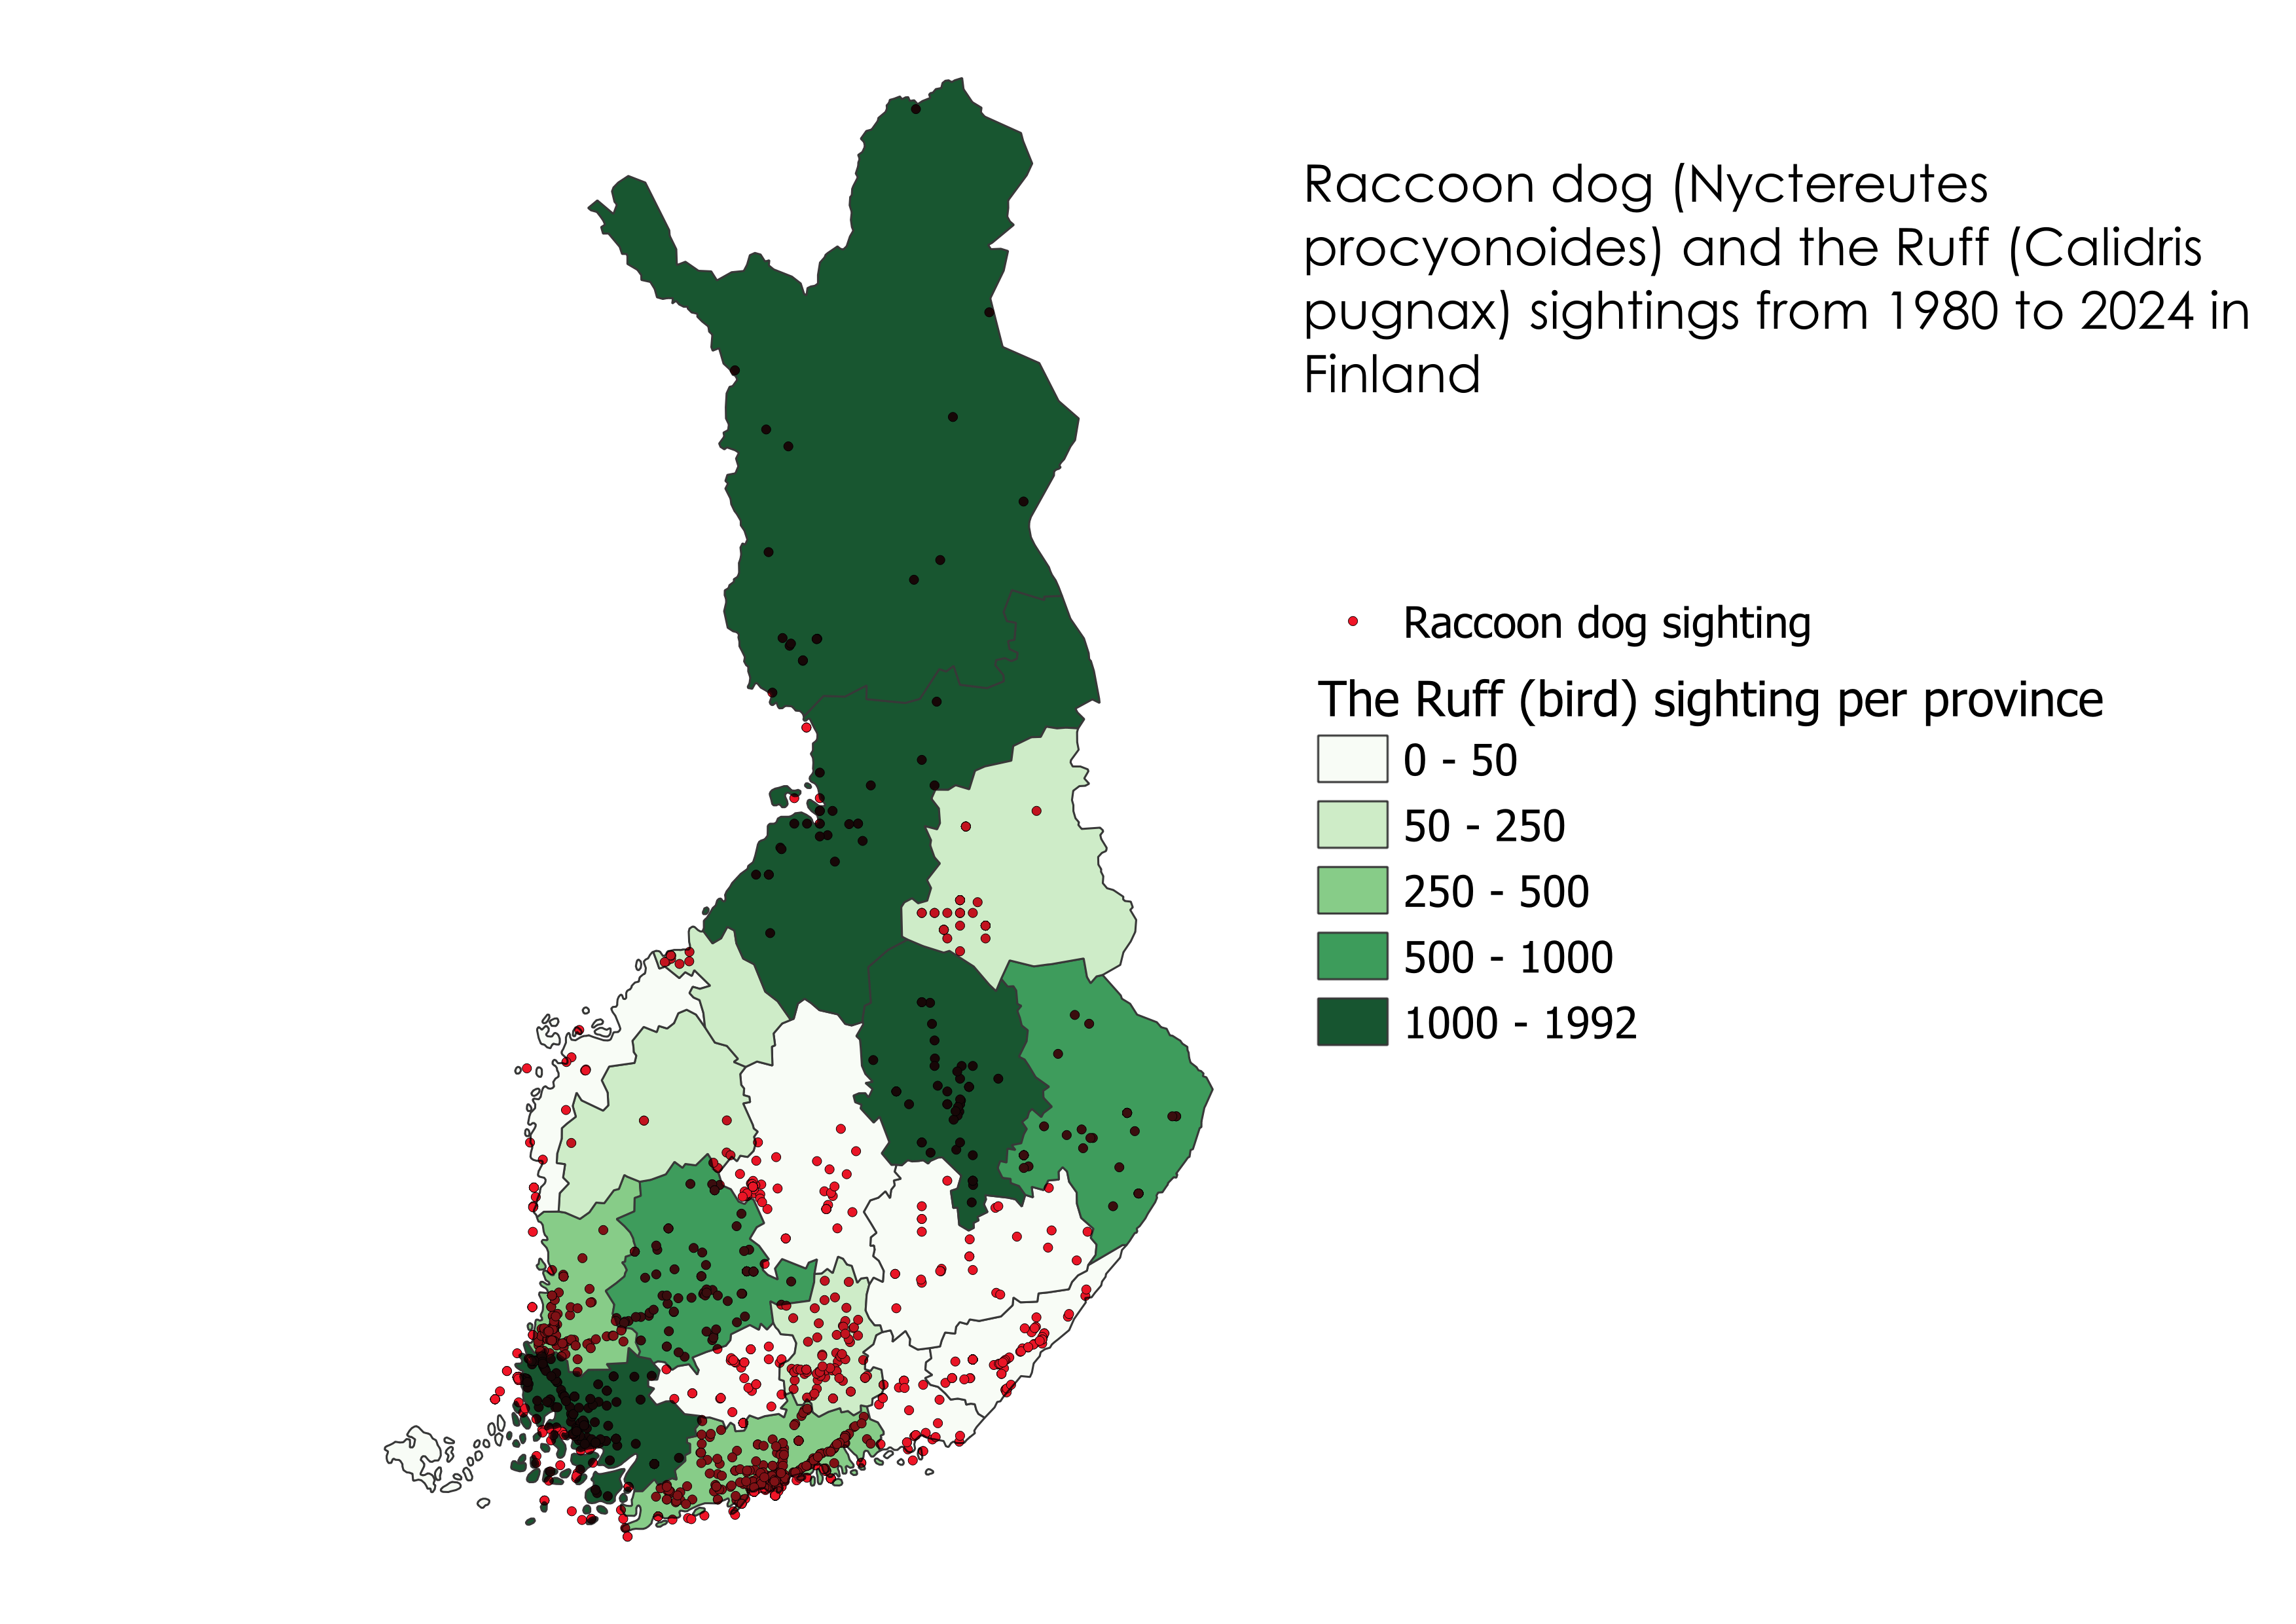
Map 1. Geographical Overlap of Raccoon Dog and Ruff Sightings in Finland (1980-2024)
The map (Map 1) represents an example as how raccoon dog can pose a threat to a endangered bird species as their habitats overlap significantly. The ruff (Calidris pugnax) is categorized as critically endangered in Finland and nests on the ground which makes it a good example as possible victim to raccoon dogs nest destruction. From the map it is noticeable that particularly in the southern regions a significant overlap of these two species, suggests a potential for ecological impact.
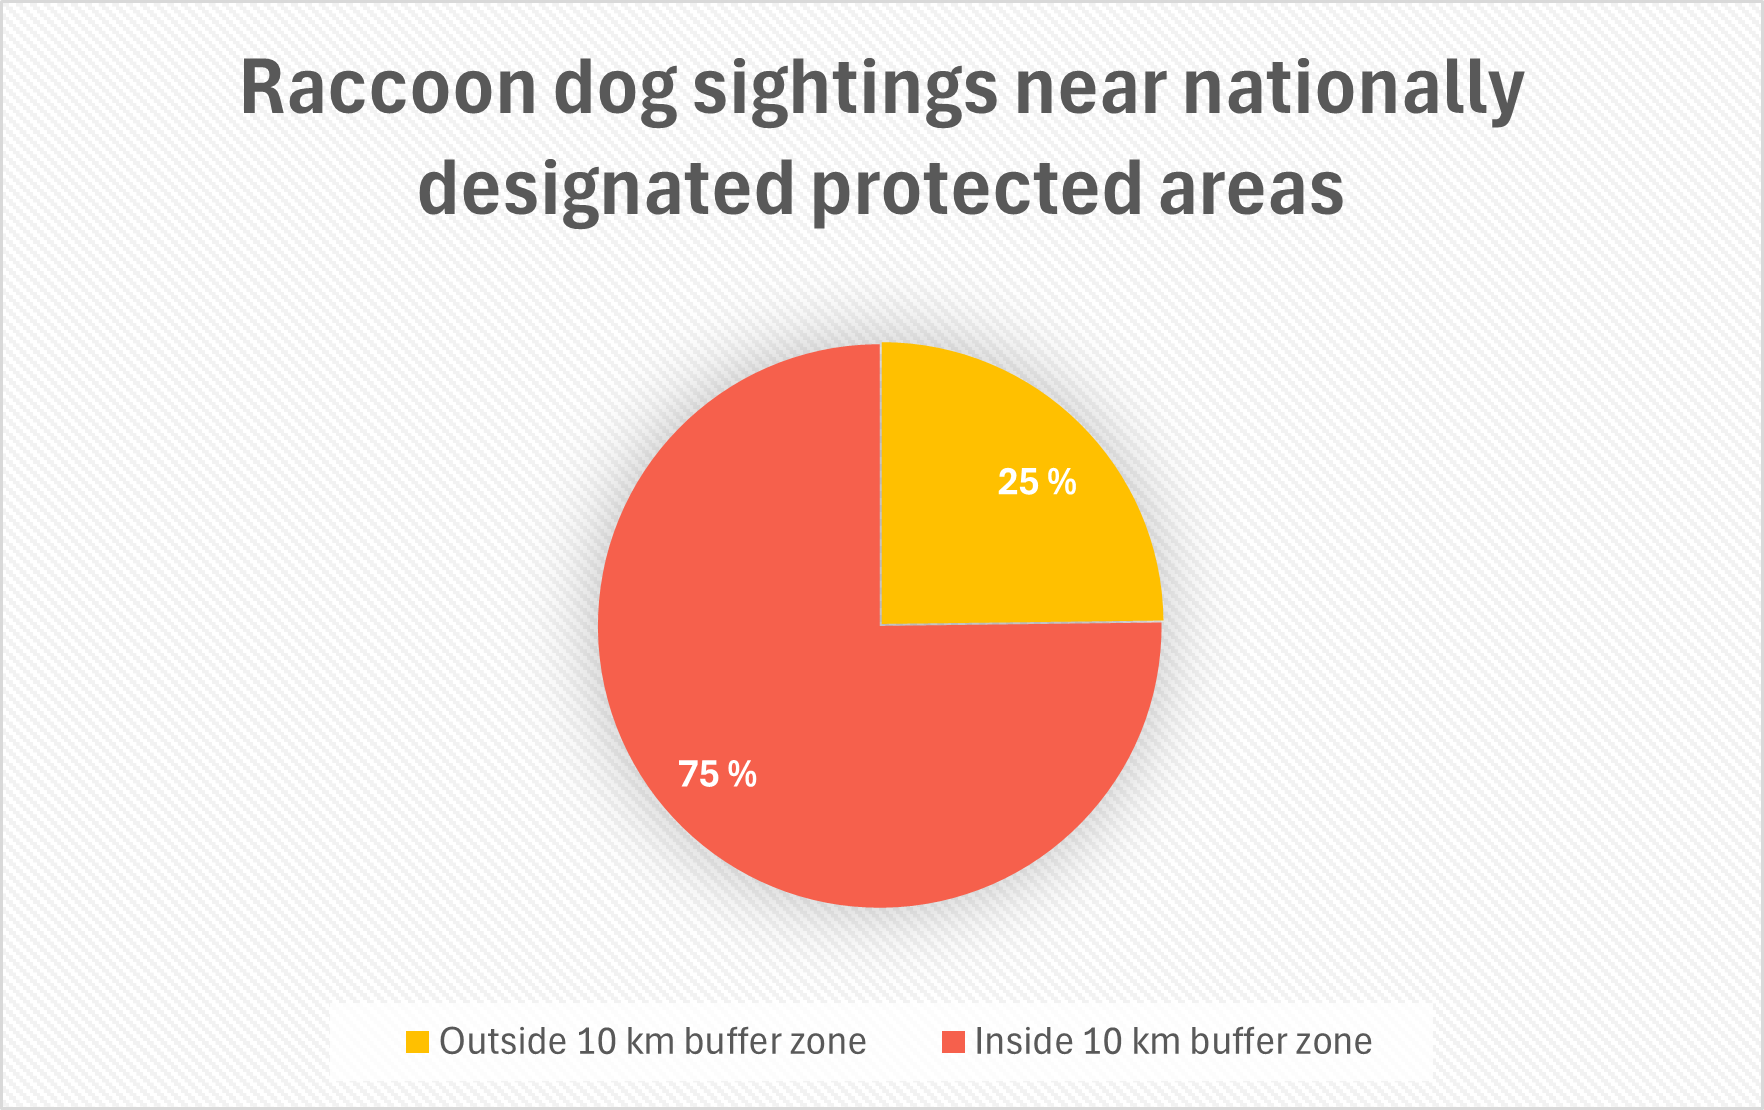
Plot 2. Distribution of raccoon dog sightings near protected areas in Finland
As the plot shows (Plot 2) 75% of raccoon dog sightings occur within a 10-kilometer buffer zone around nationally designated protected areas. This suggests that raccoon dogs are frequently found near or potentially within protected areas, posing a potential threat to the ecosystems and species that these areas aim to conserve, like for example the Ruff.
Conclusion
In conclusion, the raccoon dog, has established itself as a adaptive invasive species across the country. Originating from Southeast Asia, its wild population spread from neighboring regions into Finland, showing a notable expansion visible in the sightings data. This expansion, showed in both video and plotted formats, highlights its growing presence, particularly in southern Finland and, more recently, encroaching into Lapland.
Ecologically, the raccoon dog’s omnivorous diet and opportunistic eating habits pose significant challenges, especially during critical periods like breeding seasons when it preys upon ground-nesting birds. This predatory behavior threatens vulnerable species for example the ruff whose nesting sites overlap extensively with the raccoon dog’s habitat. The geographic overlap of these species underscores the ecological impact, with implications for biodiversity conservation efforts in protected areas where raccoon dog sightings are notably concentrated.
As efforts continue to control and manage this invasive species, understanding its spread dynamics and ecological interactions remains very important. Effective mitigation strategies will be essential in mitigating further impacts on native wildlife and ecosystems in Finland.
During the first week’s discussion, we talked about the influence of art on cartography both historically and in modern times. We concluded that in previous times, art had a stronger influence as maps were made by hand, requiring collaboration among skilled craftsmen. Maps were also viewed as pieces of art, necessitating significant effort and skill. Modern cartography, however, is more practical and less artistic due to computer-generated maps.
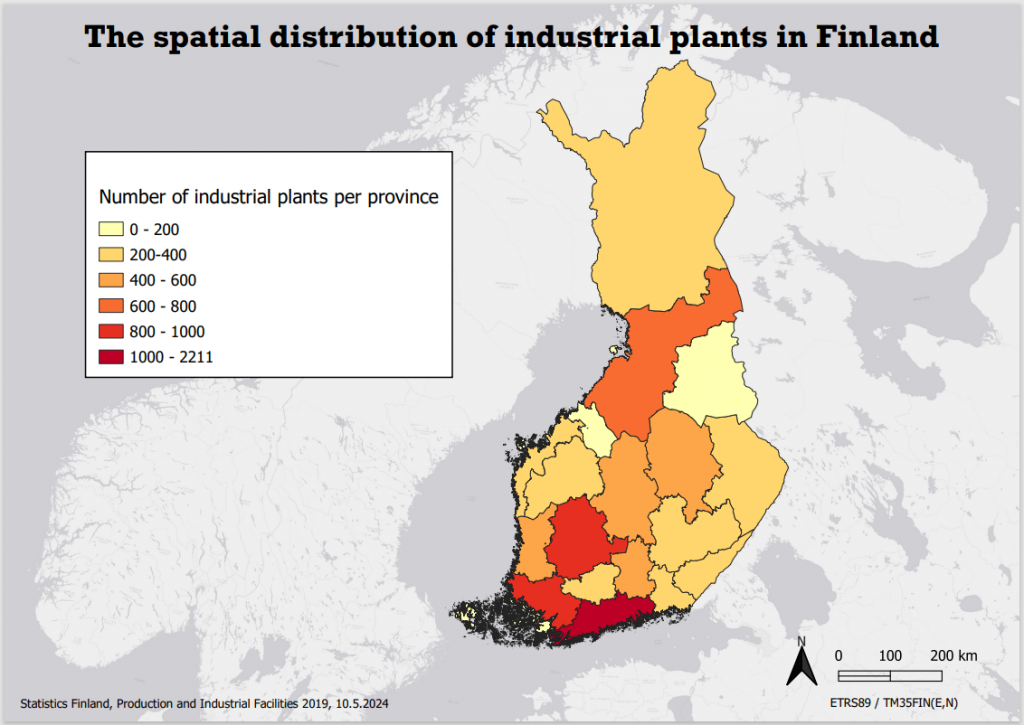
Thematic map creation was done using Statistics Finland data on production and industrial facilities, with Finland’s provinces from avoindata.fi. (Map 1) The color ramp chosen was yellow-red for its informativeness and suitability for colorblind viewers. The ESRI Gray (light) base-map was used for its neutrality, and ETRS89 / TM35FIN CRS was applied. The map followed a standard QGIS visualization with minor adjustments to fonts, scale bar, north arrow, and legend properties.
Week 2: Visual Hierarchy and Color Theory
Map 2
This week’s lecture and discussion focused on visual hierarchy and color theory. We learned about the implications of colors and how different colors are associated with various meanings. In our discussion, we talked about color associations, like red being negative or leftist and green associated with nature.
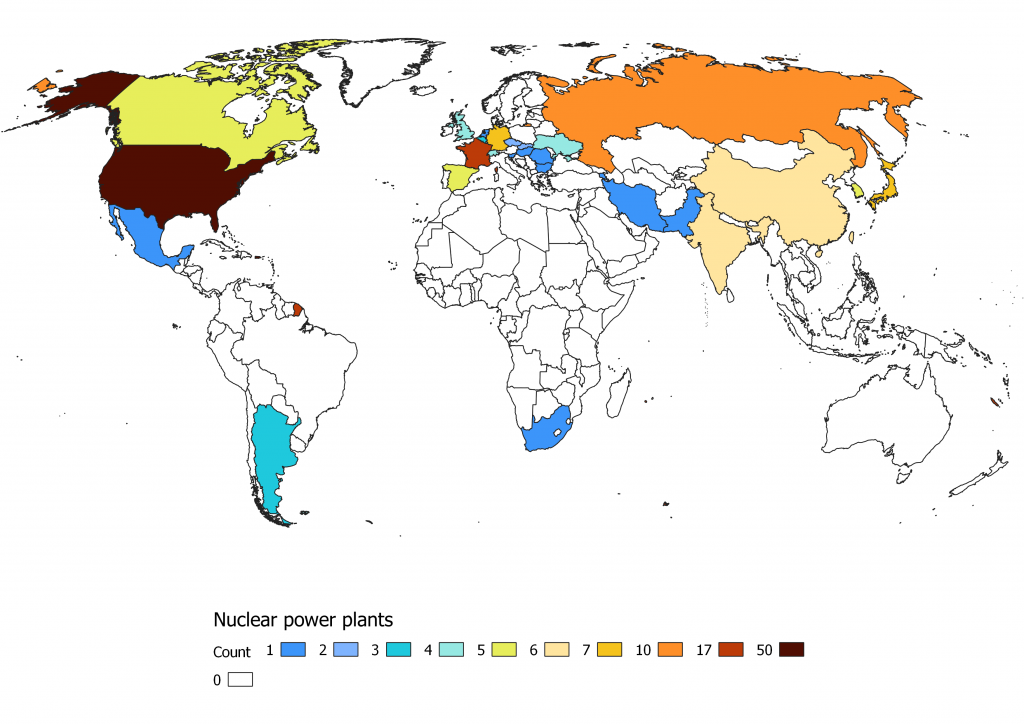
For my map, I used the Robinson world projection, a compromise projection minimizing polar distortion. (Map 2) Despite some color and legend issues, the map effectively highlights the dominance of the USA with 50 nuclear power plants and the lack of nuclear power in most of Africa and all of Australia. The map did not include a scale bar or north arrow as they were deemed unnecessary. After closer inspection the map had a number of issues like Finland not having any nuclear plants and the color ramp was poorly chosen, but I had some time-management issues during this exercise.
Week 3: Creative Mapping Process
Map 3
The third week’s lecture introduced a new workflow for creating maps. During the discussion session, we worked in groups to brainstorm and select the best visualization ideas. Our group focused on mapping rent price changes in cities, emphasizing the importance of creativity and group collaboration. This method can be applied to the final course assignment by sketching and brainstorming ideas for data visualization. The lecture encouraged innovative visualization methods beyond traditional mapping.
We were also tasked to think of ways to visualizing spatial data without maps. I chose word clouds. A word cloud could for example display the frequency of words associated with the hashtag Helsinki from social media data, providing a visual summary of public sentiment of Helsinki.
Week 4: Future of Cartography and Interactive Maps
In the final week, we discussed the future of cartography, particularly the impact of AI. Opinions varied on whether AI poses a threat to data privacy or can enhance ethical mapping practices. We also considered the effects of improved technology on data availability, with arguments for and against increased open-source data in the future.
I created a basic bar plot of flying squirrel sightings in Uusimaa province using the DataPlotly plugin in QGIS, though I faced labeling issues. Additionally, I produced an interactive map showing squirrel sightings per municipality, using green to create positive associations. The map allows users to click on municipalities for detailed information, though there were challenges with hover features and basemap details.
In conclusion, the weekly reflections covered the evolution of cartography from artistic influences to modern technological challenges and future possibilities. Each week’s exercise provided practical experience in map creation and highlighted the importance of creativity and the potential of modern technologies in cartography.