
Understanding where people are and when – What is the pulse of the city? – is of high importance in urban planning, management and governance. Accurate information of the dynamic population distribution is crucial for example for land use and transport planning, disaster and conflict preparedness, evacuation purposes and for mitigating the spreading of diseases.
So far, our understanding of the whereabouts of people in time and space is scarce and predominantly based on static census data – people are expected to stay at home, although people rarely stay there the entire day. For instance, in (place-based) spatial accessibility research the use of home locations are considered as a proxy for origins of people despite the widely acknowledged criticism of the approach.
Fortunately, novel temporally sensitive spatial data sources, such as mobile phones, geotagged social media posts and smart cards can provide new solutions to uncovering the actual whereabouts of population in space and time.
In my thesis, I set out to uncover the spatio-temporal population dynamics in the Finnish Capital Region using mobile phone data. The data was provided by one of the main mobile network operators in Finland. Network-driven mobile phone data was interpolated to statistical 250 m x 250 m grid squares to estimate the hourly population distribution on a typical weekday (Monday-Thursday).
To refine the estimated population distribution derived from mobile phone data, I applied and adapted an advanced interpolation method developed by the Digital Geography Lab that uses ancillary information of land use, floor area and use type of buildings, and a time use survey to improve the accuracy of the results. The results were then validated against official census data during night-time (2 AM – 5 AM), which showed that the advanced interpolation method significantly improves the population distribution derived from mobile phone data.
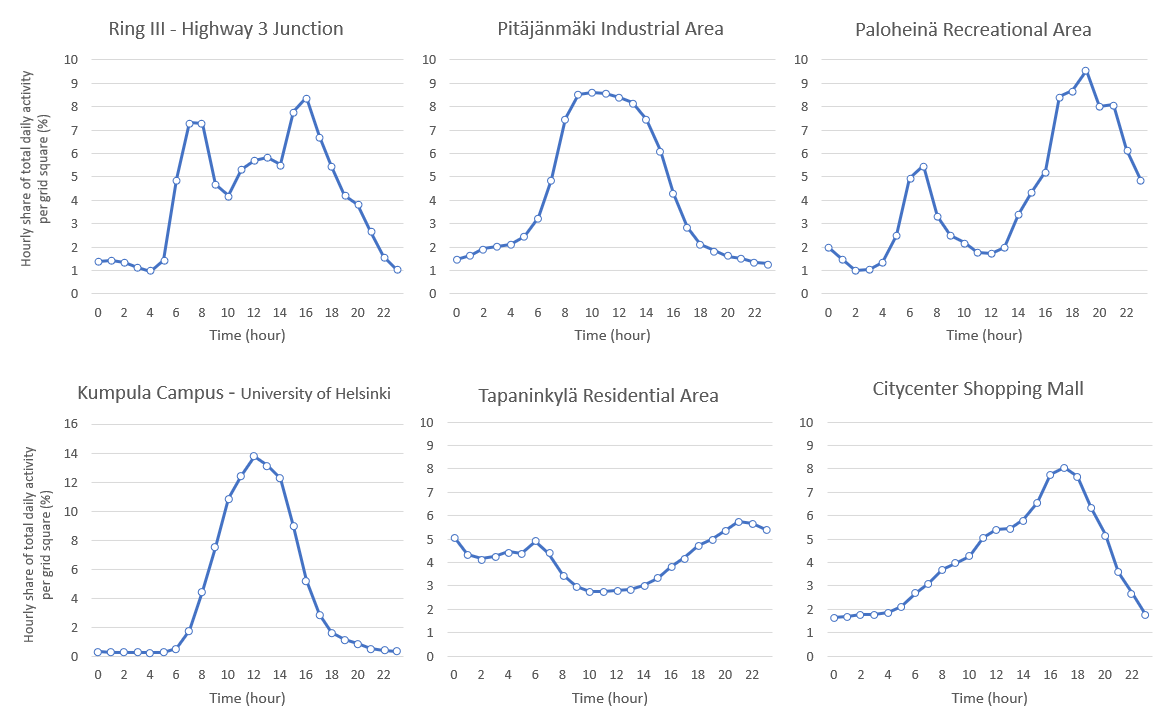
The results highlight, that network-driven mobile phone data can be used to catch the daily pulse of the Finnish Capital Region. The morning hours show a clear transition in the whereabouts of people from residential areas to work place areas. The afternoon pattern is however not as straightforward – people may stop by a store or undertake leisurely activities on their way back home. As a matter of fact, population concentrations in the shopping malls and recreational areas are highest in the evening according to the results. Also, the polycentricity of the study area as well as the incoming and outgoing population flows along the major roads in the morning and afternoon can be distinguished from the data.
The typical home-work-home rhythm can clearly be seen for instance in the Aalto University campus area in Otaniemi. During day time, the concentration of population is highest in the campus area, but as the evening draws closer, the concentration shifts to the Teekkarikylä residential area at the end of the cape.
So, what’s next? I will implement the dynamic population distribution to examine the 24-h accessibility to grocery stores and introduce the first fully dynamic accessibility model in the study area using an approach developed by the Digital Geography Lab. Stay tuned!
Claudia Bergroth,
Geoinformatics MSc. Student
After publishing this post the dataset has been released: A 24-hour dynamic population distribution dataset based on mobile phone data from Helsinki Metropolitan Area, Finland
2 Replies to “The 24-h population dynamics of the Finnish Capital Region uncovered!”
Comments are closed.