
Overview of Samuli Massinen’s MSc thesis:
How can Big Data sources, such as georeferenced social media, be used in cross-border research? What kind of cross-border mobility patterns can be detected geographically over time? How can daily cross-border movements be separated from other movements? These were the main questions I was trying to find answers for in my Master’s thesis “Modeling Cross-Border Mobility Using Geotagged Twitter in the Greater Region of Luxembourg”.
The Greater Region of Luxembourg is the largest cross-border labor market in the European Union with the greatest number of cross-border workers in the area. European integration, the Schengen Area, and socio-economical divergences between neighboring countries have been the main factors facilitating human cross-border movements in the region and thus the emergence and expansion of the borderland community. Despite the freedom of movement, country borders still exist as well as their socio-economic differences. We witness the growing trend of people migrating to the other side of the country border while still working in Luxembourg. This actuates daily cross-border mobilities, which are not well known, to date. Thus, there is a distinct need to understand cross-border mobility dynamics in the region, especially border crossings on a daily basis.
Thus far, cross-border mobility studies have mainly leaned on national registers, surveys, and census data. However, these datasets have mostly been too scarce in trying to understand the complexities of cross-border mobility in time and space. Many studies have only focused on aggregate-level movement patterns, and the viewpoint of individuals has been missing due to a lack of suitable data. One promising option to provide individual-level data to cross-border mobility research is the implementation of novel data sources, such as mobile phone positioning and social media data.
In my thesis, I employed a person-based approach using geotagged Twitter data to study cross-border mobility in the Greater Region of Luxembourg. The aim was to examine how to implement social media in cross-border mobility research and how to move beyond aggregate-level inspections. Being one of the first studies of its kind, I utilized a heuristic programmatic approach. To my knowledge, social media data sources have not been previously applied to distinguish different cross-border mobility types. Thus, I have published all scripts and algorithms developed in the study on Digital Geography Lab’s GitHub -pages.
2010–2018.
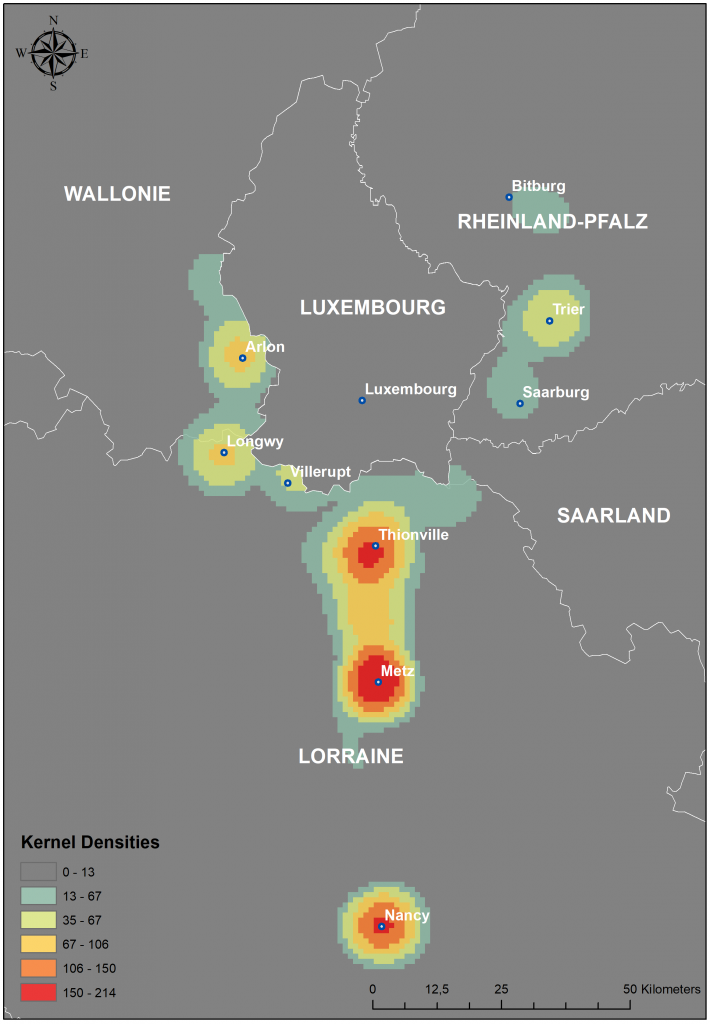
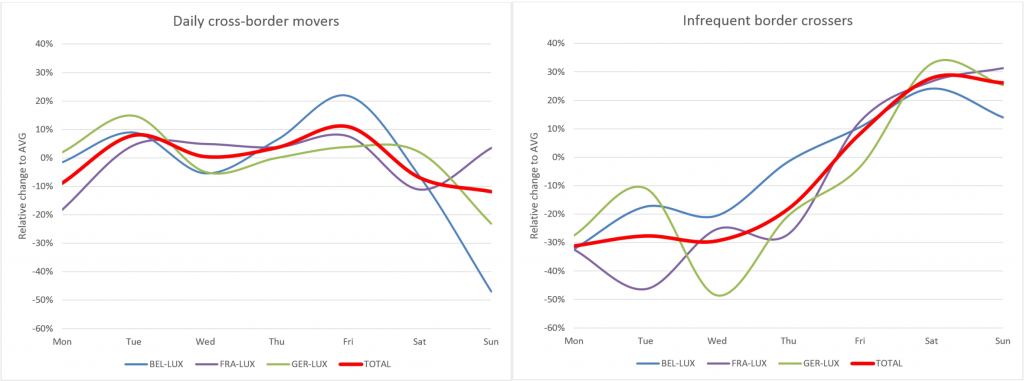
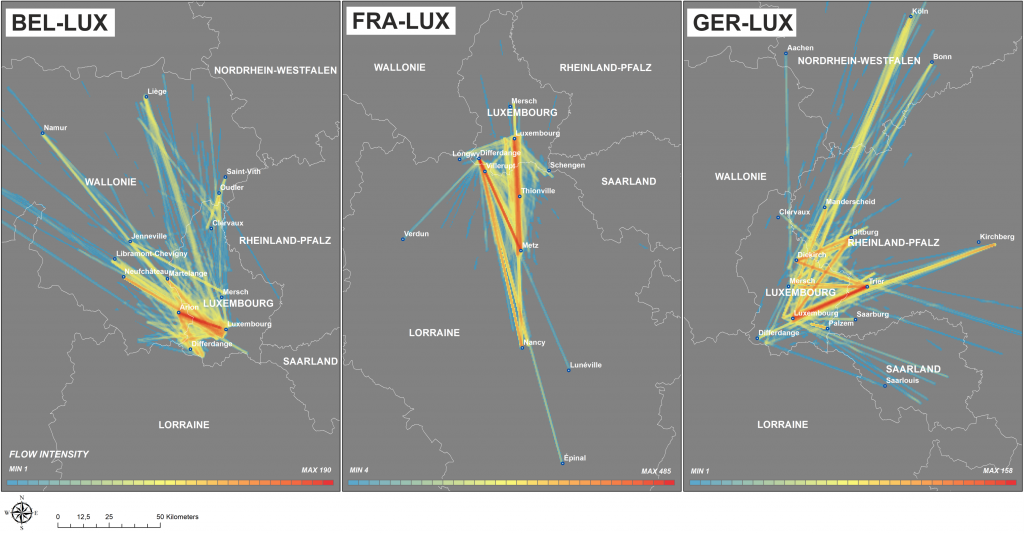
The results show that social media can be implemented in cross-border mobility research, and social media data can provide a relatively good proxy for daily cross-border mobility of people on a regional level. Aggregate-level cross-border mobility patterns and activity location densities (Figure 1) correspond closely with previous studies, and outcomes from temporal frequency inspections indicate that it’s a promising approach for identifying and classifying border crossers – Twitter users classified as daily cross-border movers are more mobile on working days whereas infrequent border crossers (potentially leisure and tourism-related) are mobile on weekends (Figure 2). Daily cross-border mobility patterns also provided new information about the spatial extent of the movements, indicating home-work commuting (Figure 3).
To obtain meaningful information from a Big Data source, several data processing steps are required, one crucial stage being the origin detection of social media users. I used a heuristic approach in home location detection which resulted in high accuracy – the “unique weeks” algorithm introduced in this study gave an accuracy of 88.6 % concerning the ground truth (i.e. Twitter user-given information about the individual’s home location).
Although the applied approach is promising in providing new knowledge about spatio-temporal patterns and trends, the results should be considered with slight caution. For example, this study did not consider population densities or Twitter use activity that might cause bias – both attributes vary spatio-temporally and effect where and when Twitter data is being recorded. Also, the sample size was rather limited in this study (~3200 Twitter users).
Hence, further research and method development are needed with larger sample sizes to draw more sound conclusions about cross-border mobility. Still, in my research, I was able to identify that the coverage of geotagged Twitter data is dependent on data acquisition processes and that Twitter Streaming API can provide valuable information for cross-border mobility research. In future studies, I recommend multi-level data acquisition processes to be applied jointly with a person-based approach combining both spatio-temporal and content analysis methodologies.
My research was part of the cross-border mobilities project at the Digital Geography Lab.
Text by: Samuli Massinen
My MSc thesis can be found here: E-Thesis
All my developed scripts and algorithms can be found here: DGL@GitHub