
Sonja Koivisto introduces her MSc thesis
Why study exercising with social media data?
Sports and exercising are an integral part of a healthy lifestyle. Keeping oneself active is known to prevent obesity and the risk of many chronic diseases. Globally, inactivity is the fourth most common cause of death. The Finnish government has acknowledged the importance of the issue by stating three objectives for encouraging exercise and supporting sports in the current government programme.
There is surprisingly little spatial research about sports in different parts of the Helsinki Metropolitan Area. Only a few sports facilities collect visitors’ statistics and often this information is not openly available. Therefore, I decided to study the topic using social media data. I wanted to find out how people exercise in different parts of the Metropolitan Area and which spatial factors affect the number of sports-related posts.
According to Statistics Finland, 80% of Finns use social media. Among people under 45-years-old, the number is over 95%. People post to social media about topics and activities that are close to their hearts, like sports for instance. The most popular social media platforms in Finland are WhatsApp, Facebook and Instagram. However, these platforms do not share their data for research purposes unlike microblogging platform Twitter. Twitter is used by 10% of Finns.
How can exercising be studied from tweets?
A major advantage when using social media data for research is that there is a huge number of posts available for analysis. In my study, I analyzed 38.5 million tweets. However, the large quantity of data can also pose challenges to an efficient data analysis.
First I wanted to extract only the tweets that were related to sports and exercising. In order to achieve that, I converted all the words to their base form using Natural Language Processing methods. Then I programmatically checked if the words matched to the words in a sports-related key word list that I had prepared.
Once the data had been thematically filtered, I also wanted to limit it spatially to the Helsinki Metropolitan area. About 1% of the tweets include a geotag, meaning information about the location it has been posted from. From the geotagged tweets, I chose to use those which were from the Metropolitan Area. From the tweets that did not include a geotag, I programmatically searched for place names located in the Metropolitan Area. If I found a tweet with a place name, I attached the coordinates of the corresponding place to the tweets. Finally I ended up with 20 599 tweets out of which two thirds were geotagged and to a third I had programmatically attached the coordinates with the help of the place names mentioned. In the subsequent analyses, I grouped the tweets by the sport they mentioned and I used statistical methods to estimate the number of tweets.
Hotspots of different sports are located in different parts of Metropolitan area
Most sports and exercising tweets are located on the peninsula of Helsinki. Other hotspots are neighbourhoods of Tapiola, Leppävaara and Tikkurila. However, when the tweets are aggregated to the postal code areas and divided by population, their distribution becomes quite even.
From the socio-economic parameters chosen for the study, the best estimates for tweets per population were the number of sports facilities in the area, the employment rate and the share of children in the postal code area. The number of sports facilities per person and employment rate affect the number of tweets positively as the percentage of children affect it negatively. These three variables combined explain 38% of the variation of the number of tweets per person.
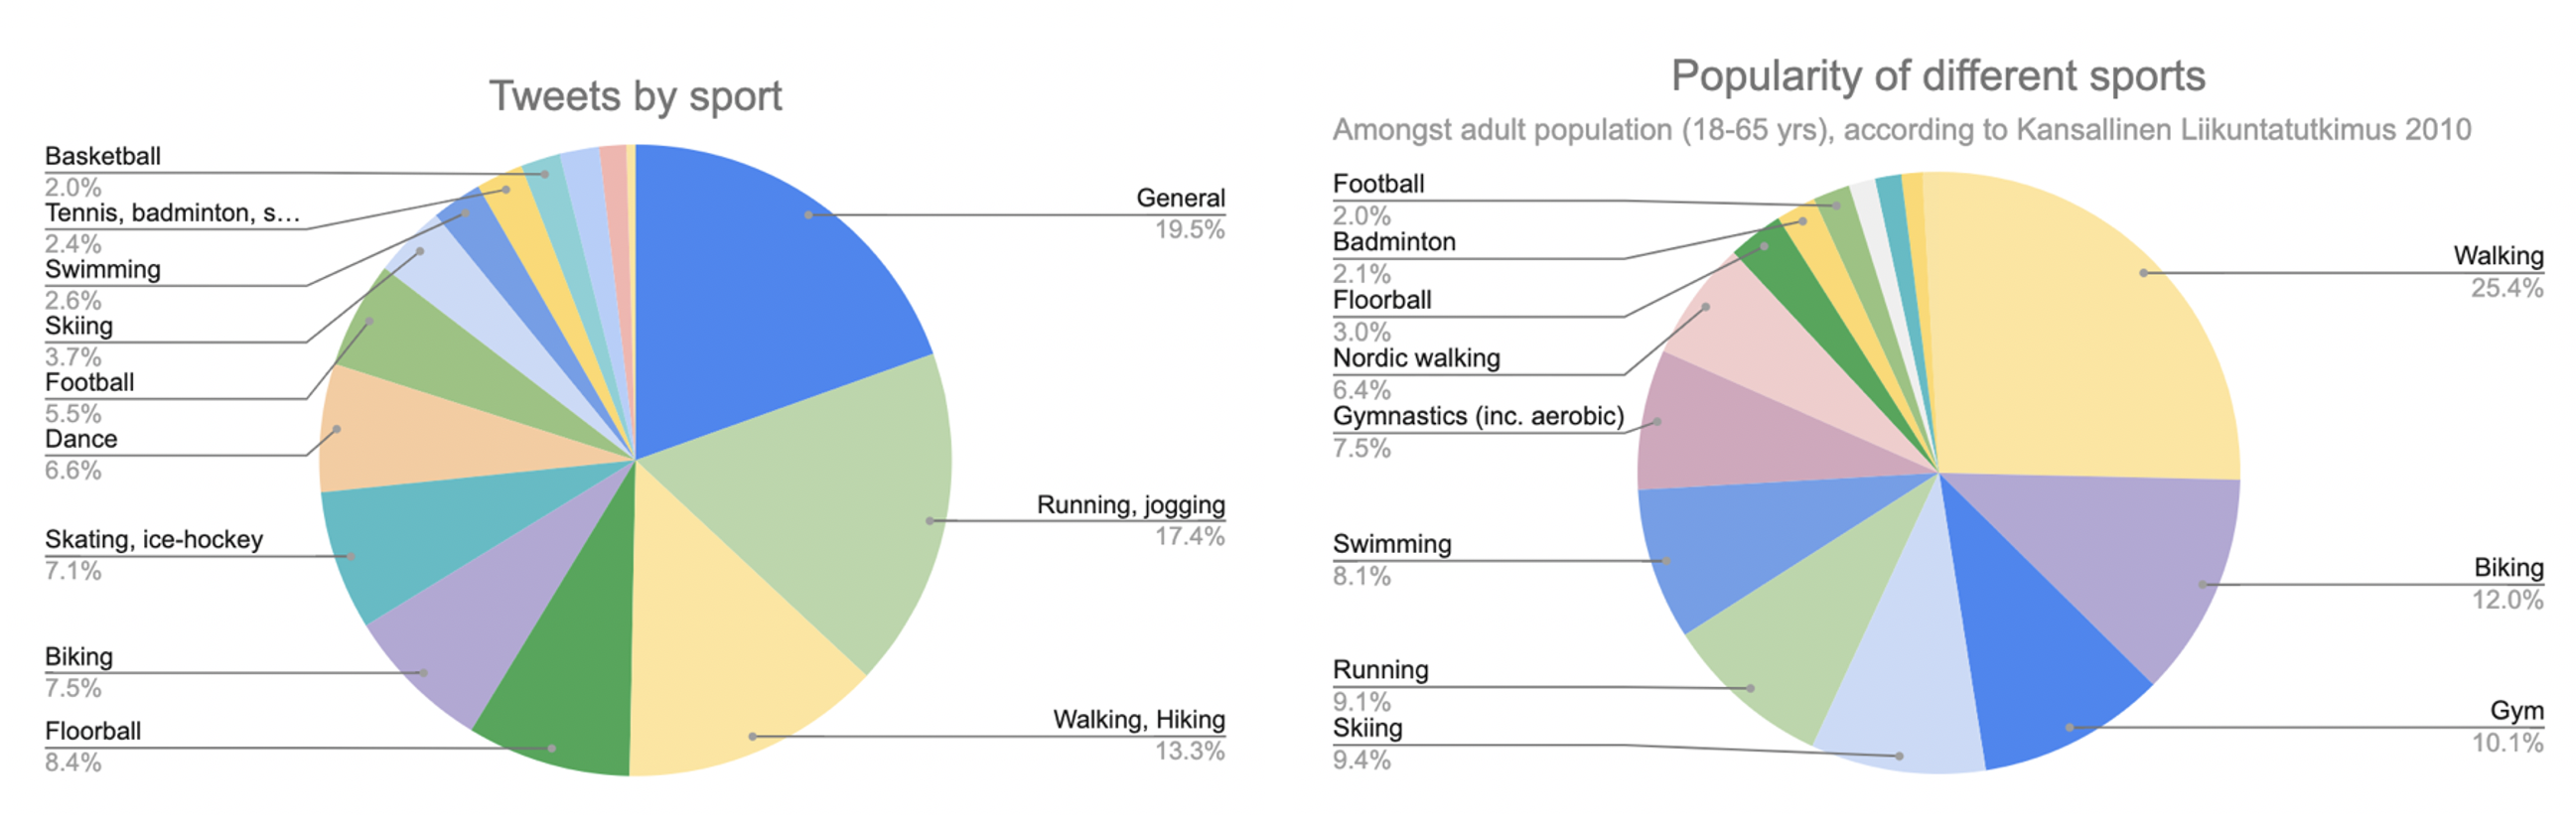
Tweets about different types of sports provide interesting details. 20% of the tweets were caught by general sports keywords such as sport, workout, sweat, etc. Followed by this were tweets related to running and third came the walking-related tweets. Percentage of tweets related to football, ice hockey and floorball appears to be higher when compared to the percentage of those who actually physically participate in these sports as reported by the National sport survey. This may be because these sports are popular spectator sports, hence more people engage online. Swimming and skiing, on the other hand, have more physical participations compared to the amount of tweets.
The different types of sports are distributed differently in the Metropolitan Area. Many sports are clustered to the center of Helsinki and to other residential and sports facilities hotspots.
For some of the sports, like skiing and racket sports, tweets are more concentrated around the respective sporting facilities. Most skiing tweets can be found in the neighbourhoods of Olari, Paloheinä, Leppävaara and Hakunila which maintain good skiing tracks. Racket sports tweets (including tennis, badminton, squash and table tennis) have hotspots in Smash center Myllypuro and Tali tennis center. Water sports tweets (kayaking, rowing and sailing) are distributed evenly along the coast and there is a hotspot in a lake in Nuuksio.
Conclusions
In this study, new information was revealed about the potential factors affecting the number of sports tweets and their distribution in the Helsinki Metropolitan area. Sports tweets are distributed in a similar manner as the population. More sports tweets are likely found where there are more sports facilities per person.
Some sports are over-represented and some others are under-represented in the tweets compared to the number of hobbyists that actually play the sports. Factors that affect the representation on Twitter are the trendiness of the sport, its popularity as a spectator sport, and the age of the hobbyist and their activeness on Twitter. For some types of sports, the tweets distribution correspond to the facilities distribution. For example running and walking are easy to do anywhere but skiers often want a maintained skiing track and racket players prefer a hall with respective courts.
-
- Check out a story map about this thesis: https://arcg.is/1rSb9v
- Read the full MSc thesis in English here: Twitter as an Indicator of Sports Activities in the Helsinki Metropolitan Area
- Read the summary in Finnish here: Twitteristä uutta tietoa liikunnasta pääkaupunkiseudulla
The MSc thesis was conducted within the YLLI-project (Equality in suburban physical activity environments / Yhdenvertainen liikunnallinen lähiö) that studies active lifestyles, sports activities and residents’ equal possibilities to access sport facilities and physical activity environments in Finnish suburbans. The project combines researchers from the research group Digital Geography Lab and Geography of Well-being and Education from the University of Helsinki, and researchers from the Social Sciences of Sport, University of Jyväskylä. The Digital Geography Lab is an interdisciplinary research team focusing on spatial Big Data analytics for fair and sustainable societies.