
Author: Emil Ehnström
Why study the spatial mobility of language minorities?
People are increasingly more mobile that has led to a more complex world. One outcome of this is the linguistic diversification of societies, which has raised the issue of language groups’ integration to a society, but also of their transnationality while people in their new society are still connected to their previous society and culture. One way to understand people’s connectedness to their origin society and integration to their host society is to study their mobility patterns. With novel data sources, like geo-located social media data, it is possible to acquire information on both cross-border and local mobility patterns of language groups.
The three language groups studied in my thesis have different characteristics. Swedish is a national language of Finland and Swedish speakers are generally considered an integral part of Finnish society. Russian speakers have arrived in Finland during multiple time periods, but significantly more since the 1990s during the immigration of the Ingrian-rooted people from the former Soviet Union. Therefore, Russian speakers form a rather heterogeneous language group in Finland. Estonian speakers started moving to Finland since the 1990s and in particular after Estonia joined the EU and the Finnish labour market became more accessible for Estonians. As Estonia and Finland are geographically close, people from Estonia have moved to Finland mainly due to work, while keeping tight connections to Estonia. This has hindered them from fully integrating to the Finnish society.
How?
In this thesis, I used geo-located Twitter data collected prior the Covid-19 pandemic. By using a language recognition model, I could identify the language of each tweet and thus aggregate tweets by each user and create a language profile for a person. This way I revealed people belonging to one of the three minority language groups studied. I also studied people belonging to the Finnish language group as the reference group for comparison.
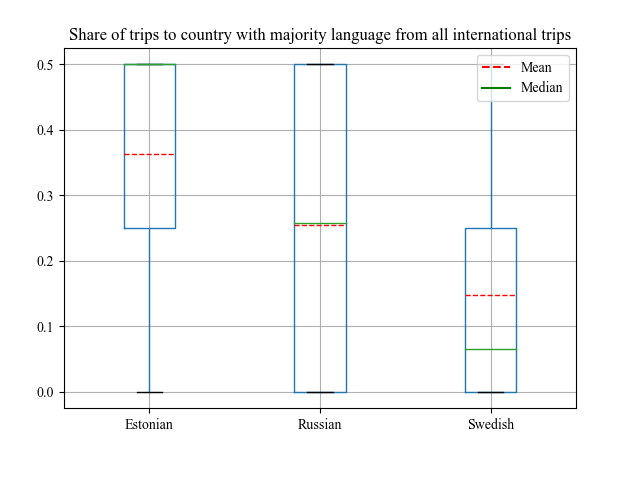
For each language group I calculated the number of times they crossed the Finnish border as well as the number of times they crossed the border of a country where their language is predominantly spoken (Estonia, Russia, Sweden). I considered it as an indication of how strong the ties are to the neighbouring country. In the first boxplot (see below), we can see for each language group the share of travels that the group conducted to a neighbouring country with the same majority language. We see that Estonian speakers tend to travel more often to Estonia, than for example Swedish speakers to Sweden. The variation is high among Russian speakers – some travel more often to Russia, while others rarely.
I also calculated how diverse the travel patterns were, by calculating the number of unique countries a user visited and using two diversity metrics, the Shannon entropy and Simpson’s Reciprocal index. I considered low cross-border mobility diversity as an indication of connectedness (or the level of transnationality) to neighbouring countries. The results confirm the same patterns as above – the lowest diversity is among Estonian speakers, while among Swedish speakers it is the highest and is at the same level as among Finnish-speaking people.
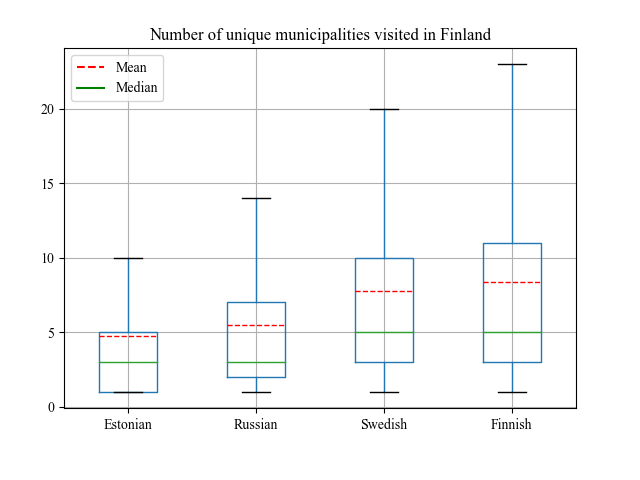
Another aspect I looked at was the domestic mobility pattern, and I calculated how many unique municipalities a user had visited and how long the mean distance they had travelled was. I considered the domestic movement patterns as an indication of integration to the Finnish society. I also examined the linkage between cross-border and domestic mobility patterns. In the second boxplot (below), the differences in the number of unique municipalities visited are presented. Here, we can see that Estonian speakers visit on average fewer unique municipalities in Finland, than the other language groups. For Russian speakers the variation within the language group is larger, leading to a higher average but a similar median to Estonian speakers. The two groups of national languages of Finland are quite similar in this regard – they visit different municipalities equally.
What did I find out?
To see if there are overall differences between the language groups regarding all variables examined, I used one-way ANOVA tests. Since all variables showed significant difference, I further used a Games-Howell post-hoc test to see where the differences between groups lie. I found that, in the majority of the examined variables, Estonian speakers had significantly different pattern than the other three language groups. For example, that there are significant differences between the number of unique countries visited between Estonian speakers and the three other language groups, whereas the other groups did not have statistically significant difference between them.
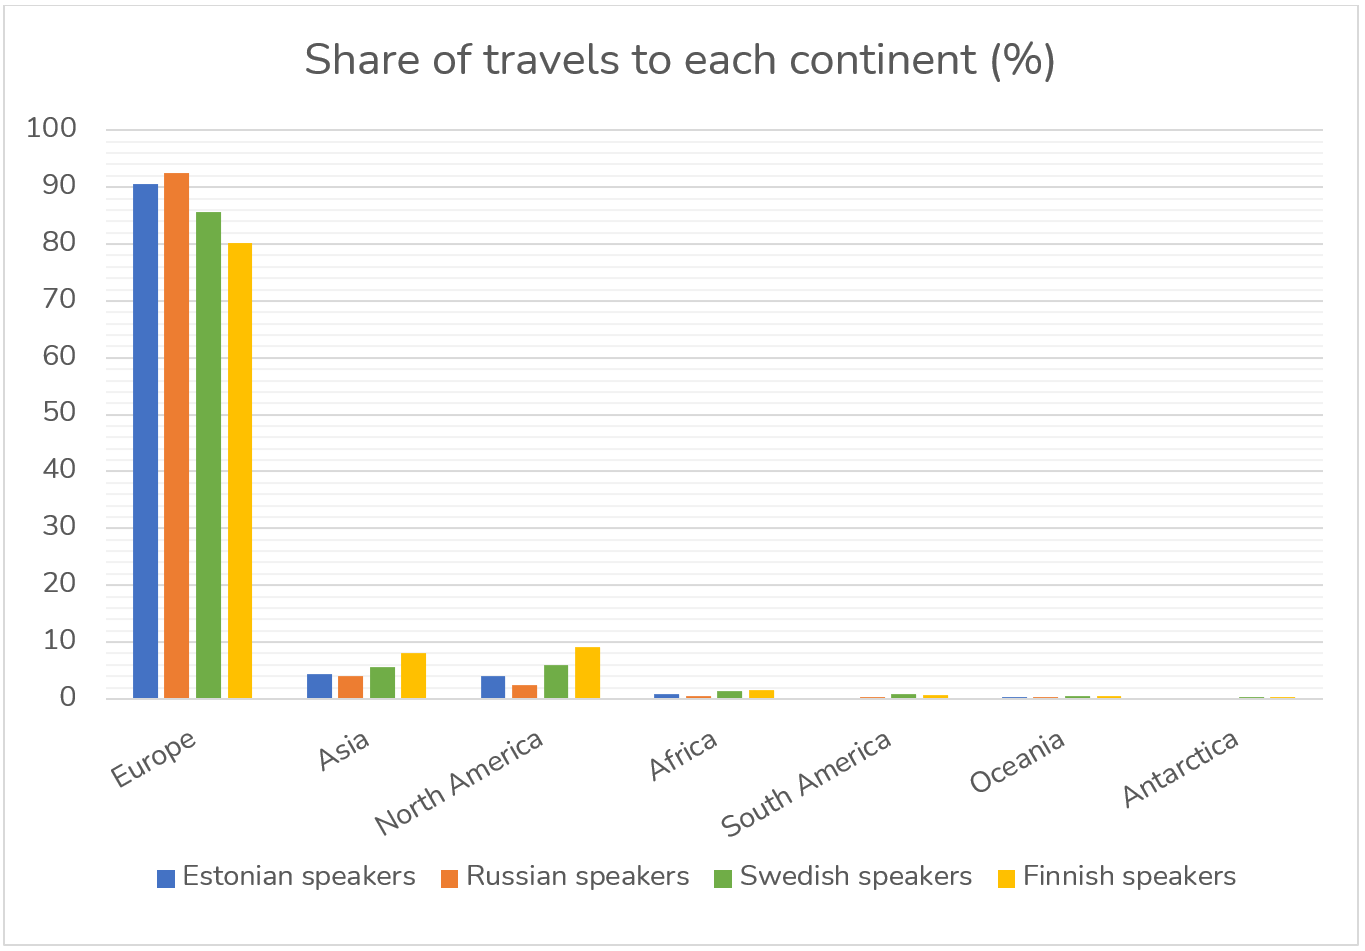
Also, for each language group I mapped their cross-border movements. The bar chart below shows the share of travels to each continent. Europe is, as expected, the most visited continent, but we can also spot some differences between the language groups. Finnish speakers for example tend to travel more to other continents than the three other language groups.
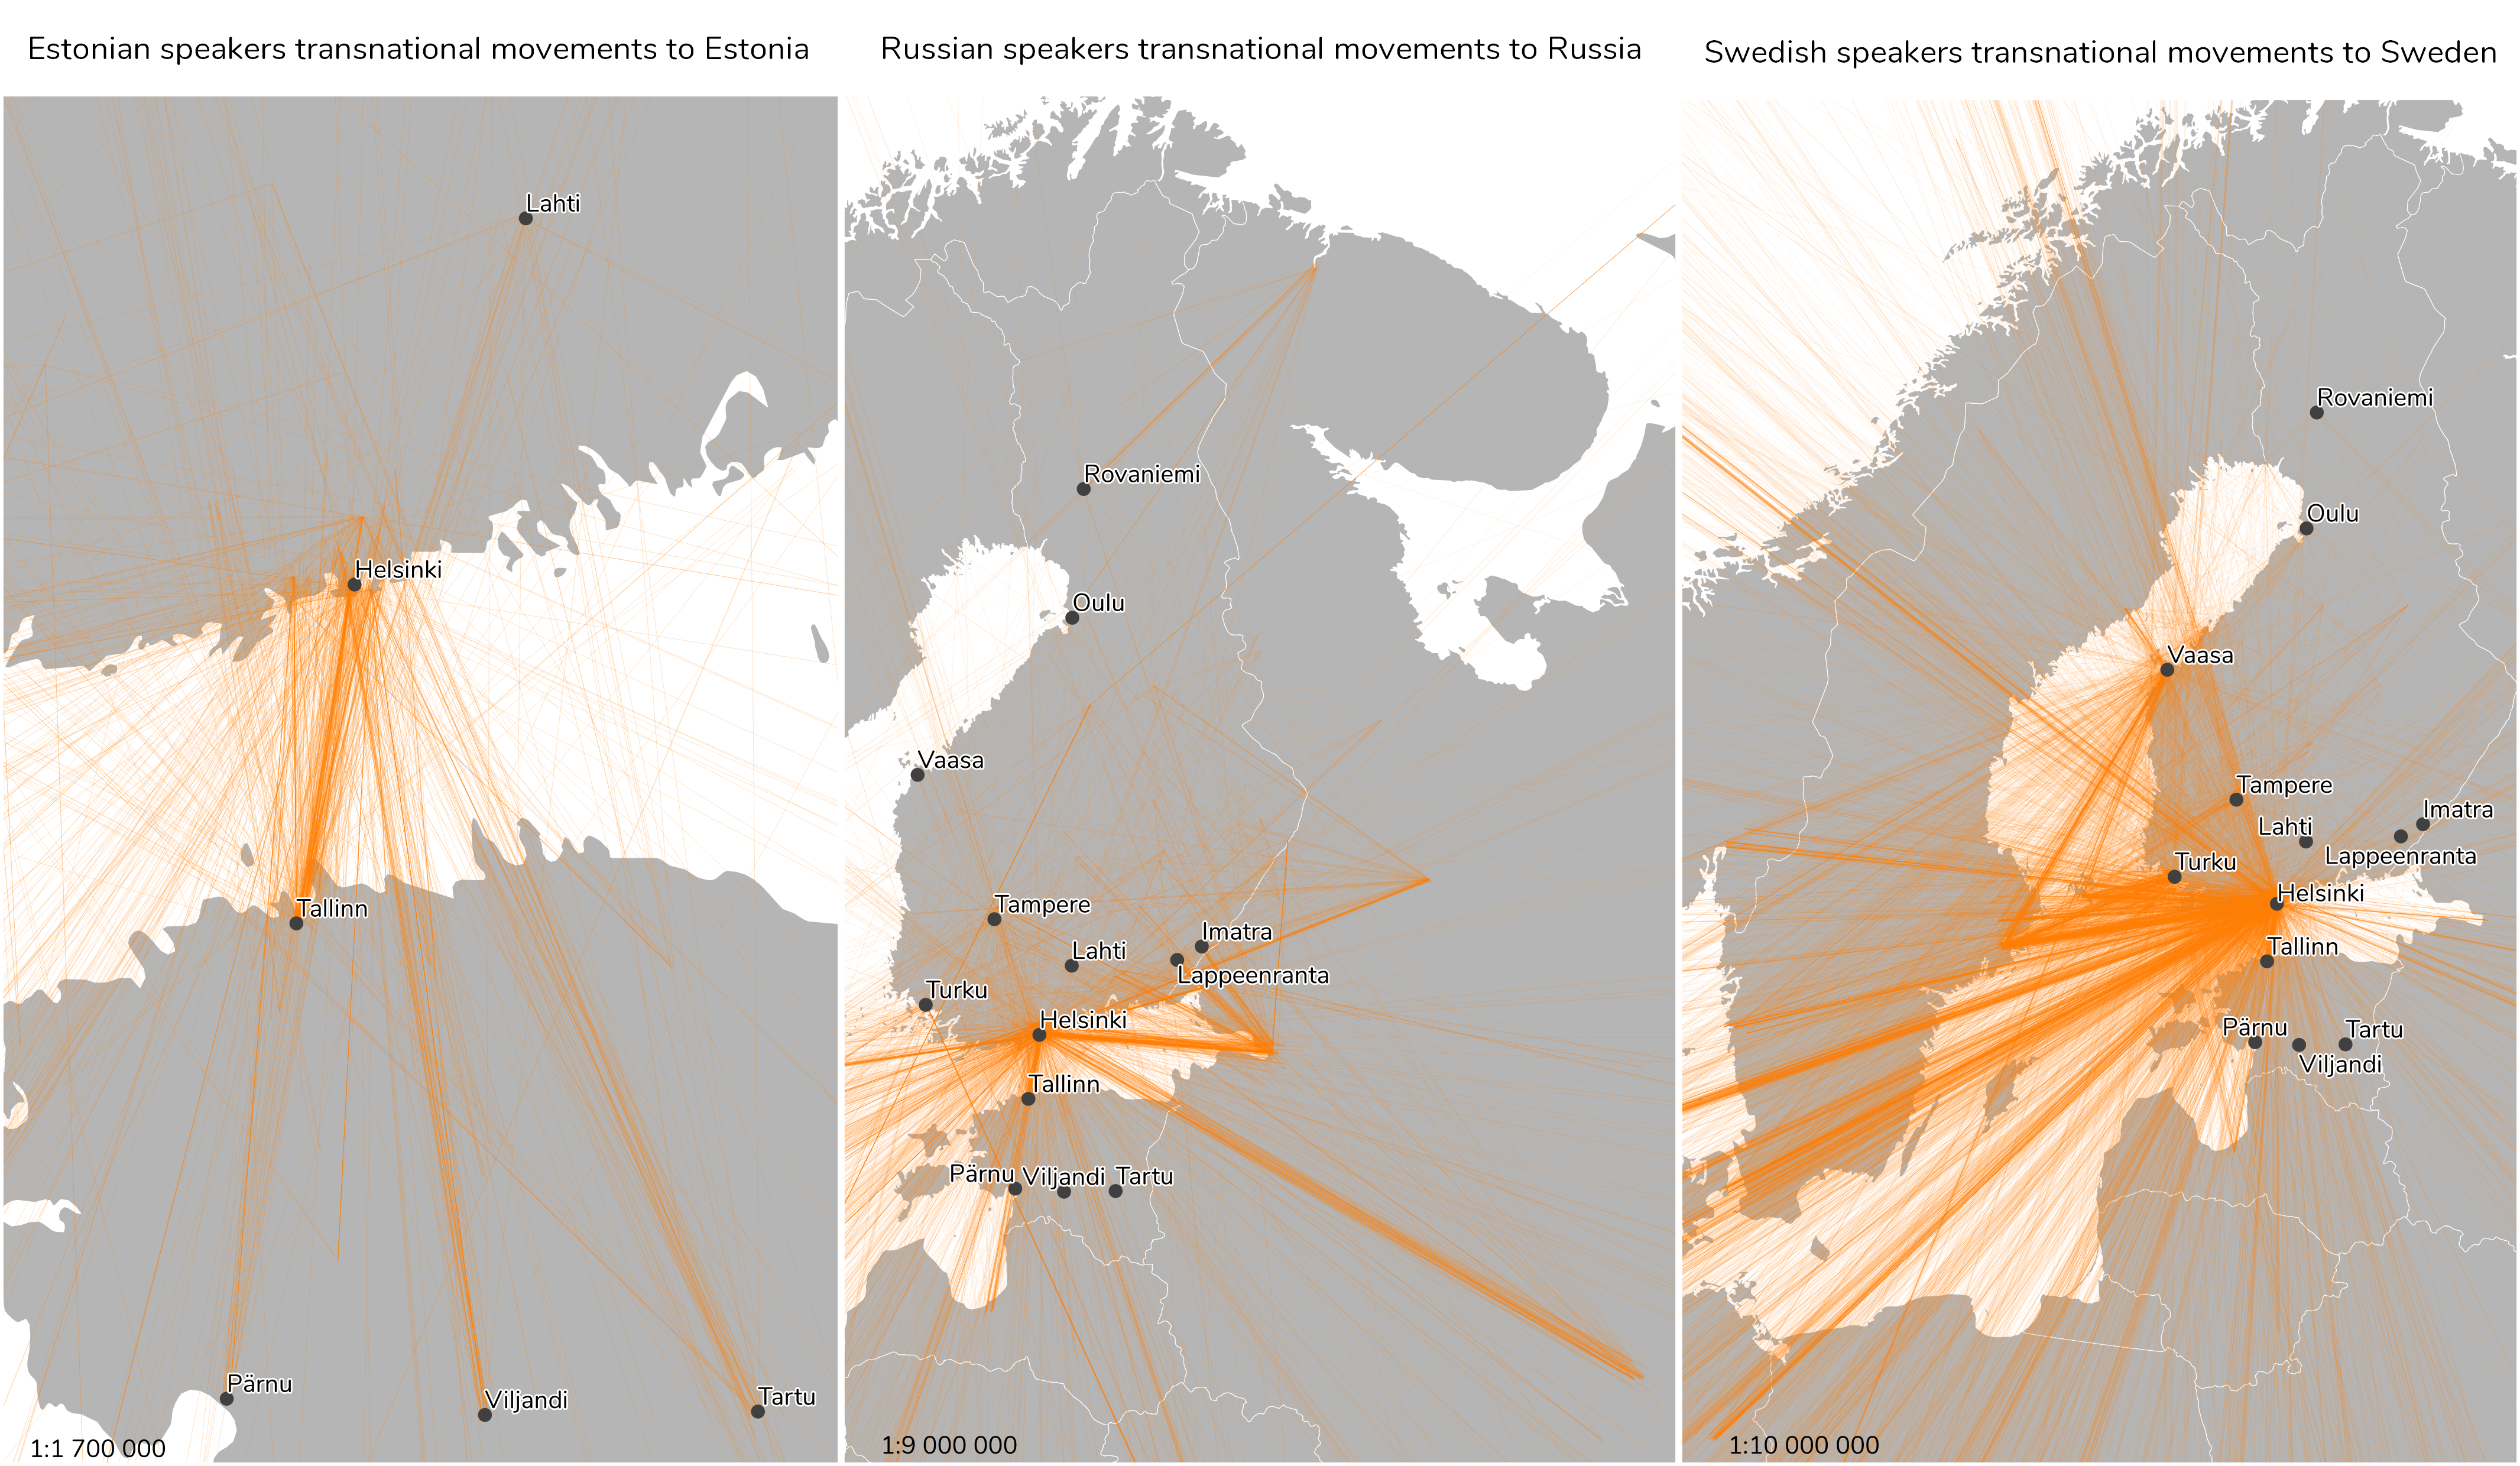
 From the maps below we can see that Estonian speakers often travel between Helsinki and Tallinn, but on the Estonian side also Pärnu, Tartu, and Viljandi show up. For Russian speakers we can see that the main travel lines go from Helsinki to Moscow and St. Petersburg. Petrozavodsk in Russia also seem to be highlighted, as well as some towns in eastern Finland. Swedish speakers travel mainly to Stockholm and to some other major cities. Swedish speakers from Ostrobothnia also travel to Umeå.
In future, I think it would be interesting to examine these mobility patterns even further. For example, looking more closely at the travel diversity. Which countries does each language group visit more often than other groups? Another important aspect would be to look at the temporal variation. By looking at the temporal variation, we could for instance get a better understanding on how mobility differs between weekdays and weekends. For instance, could we see if Estonian speakers tend to travel to Estonia for weekends and spend their leisure time there, instead of being in Finland?
In general, the results show that the language groups have different mobility patterns. Estonian speakers are more immobile within Finland, and travel a lot between Estonia and Finland that provides some evidence about their tight connectedness to the Estonian society even while they live in Finland. Russian speakers’ mobility patterns vary quite a lot, with some being highly mobile and others less. Swedish speakers have very similar mobility patterns to the Finnish speaking population that confirms their integration to the Finnish society. These results also indicate that spatial mobility derived from social media data could provide some insights into integration and transnationality. To understand these patterns more thoroughly, I look forward to more research on this topic.
Read the full MSc thesis here: Capturing International and Domestic Mobility Patterns of Minority Language Groups: Case of Finland using Twitter data
This thesis was part of the BORDERSPACE project led by Academy Research Fellow Olle Järv. BORDERSPACE combines cutting edge big data analytics and critical theorizations to study the socio-spatial phenomenon of transnationalism through bordering practices of people. The novelty of the project stems from the use of big data sources with the purpose of providing valuable insights for cross-border research and practice. The project is carried out at the Digital Geography Lab – an interdisciplinary research team focusing on spatial Big Data analytics for fair and sustainable societies at the University of Helsinki.