Author: Bryan R. Vallejo (@BryanRVallejo)
I remember one day when I was carrying out research about the accessibility of elderly population in the context of the steep streets of the historical center of Quito, Ecuador. I found an outstanding paper related to accessibility modelling as a function of time. Since then, I started reading papers written by the members of the Digital Geography Lab (DGL) and my curiosity about their work in geography got awaken. I hoped that one day I will be able to learn from them and gain understanding how to examine our society through digital data and novel tools. Surprisingly, after a year and a half, I am a former visitor of DGL, and I can truly say that this experience was life changing!
Thanks to the University of Tartu, I got the opportunity to be an exchange student during my master studies in geoinformatics. I wanted to learn geospatial analysis and Python programming, and advance my skills in the well-known Python courses given by the members of DGL. The courses taken at the University of Helsinki were an excellent match, and fortunately, I was able to use my new coding skills when joining DGL as a trainee in the BORDERSPACE project under the supervision of Olle Järv.
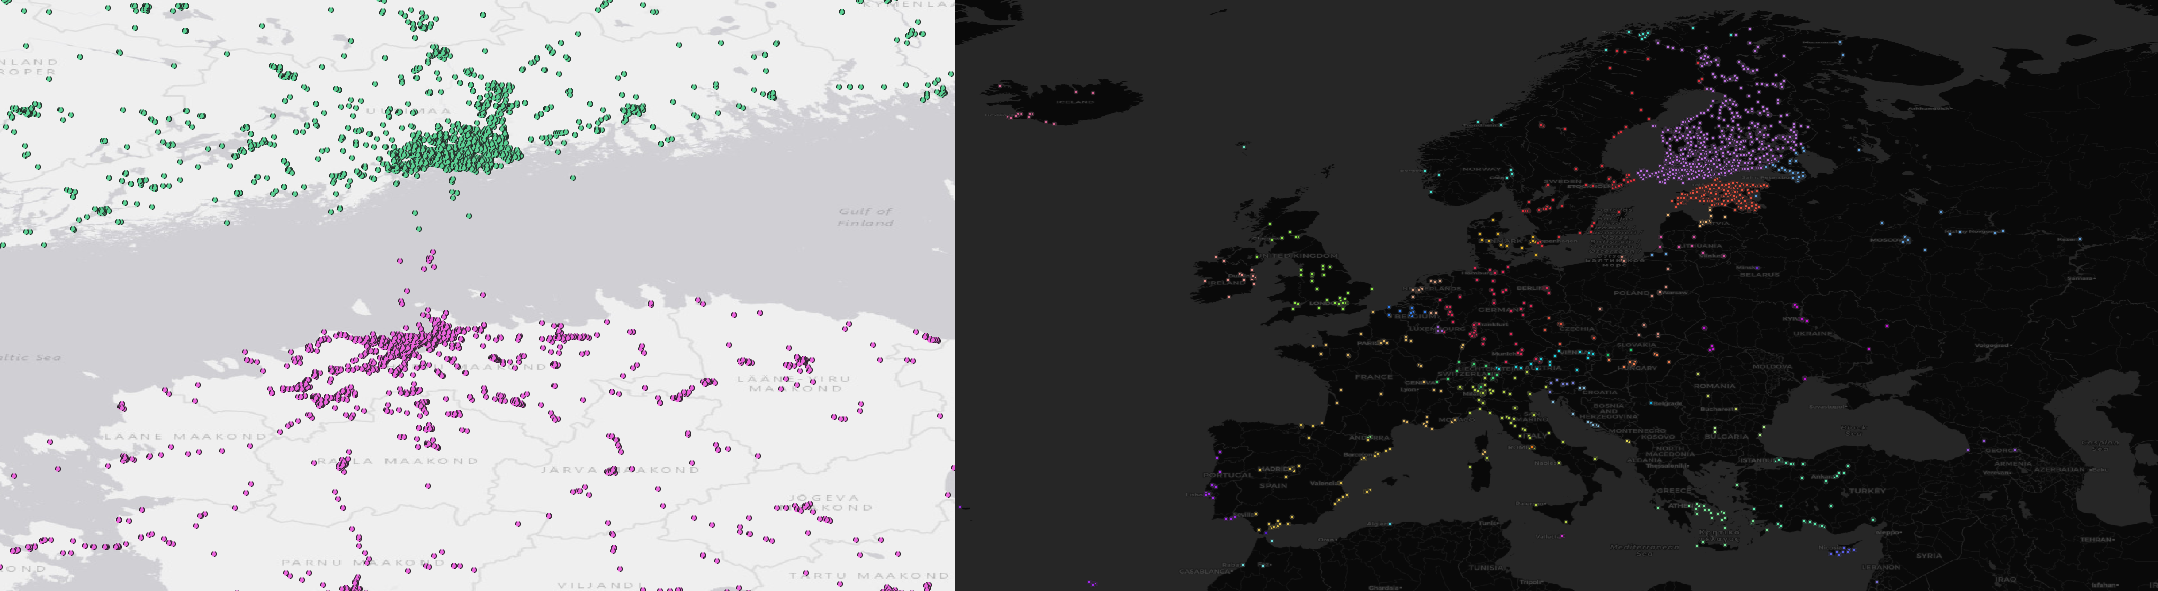
During my stay as a visiting member, I worked on the automation of methods for understanding human mobility from various perspectives. What makes fascinating the research at DGL is how innovative it is. I was surprised to learn how it is possible to capture human mobility from enormous datasets of social media data like Twitter posts. The courses I took and the traineeship had a perfect match – I was able to test and improve my coding skills in geospatial analysis and using advanced geoinformatics methods for ongoing research, and contribute to the projects at DGL. I obtained knowledge about accessibility and mobility analysis using novel data sources, and about spatial statistics for urban modelling. I also took a course on open GIS and spatial data infrastructure that not only taught me valuable open tools, but also the importance of open science for development on a global level. Not the least, DGL organized monthly journal clubs and supported my training in PostGIS and geo-visualization.
During the last months of my stay, I worked as a research assistant in the same Python courses that I had just taken myself. It was an awesome experience to learn from the teaching perspective and a pleasure to transmit my knowledge to other students. When I was a tutor in the courses in which I had started as a student myself, I realized that I had achieved what I came for – feeling confident about working with any spatial data and able to solve any problem, and to support research in the broad field of geography.
The short, but fruitful time at DGL helped me to find my path. I am glad and grateful that I had this opportunity, and I believe that every person who is a former DGL member feel that one had been in a right place like me. Being part of DGL was a wonderful experience from a personal, a social, and an academic perspective. I am taking with me the comfort I used to feel when entering the offices of DGL, and I will keep spreading this wellbeing to every place I go. The best I can say is thanks to all members of DGL who supported my stay and made me feel like home! Best wishes to all and hopefully our collaboration continues!
To wrap up my post, I list my published blog posts and publicly available codes that I created during my stay at DGL, and that contributed to the BORDERSPACE project and beyond. Inspired by the open science initiative, I would like to share them with you 😊
1. OptiSS – Tool for optimizing spatial joining of social media data
An integration of Anaconda and Arcpy to optimize computational resources for geodetic spatial join.
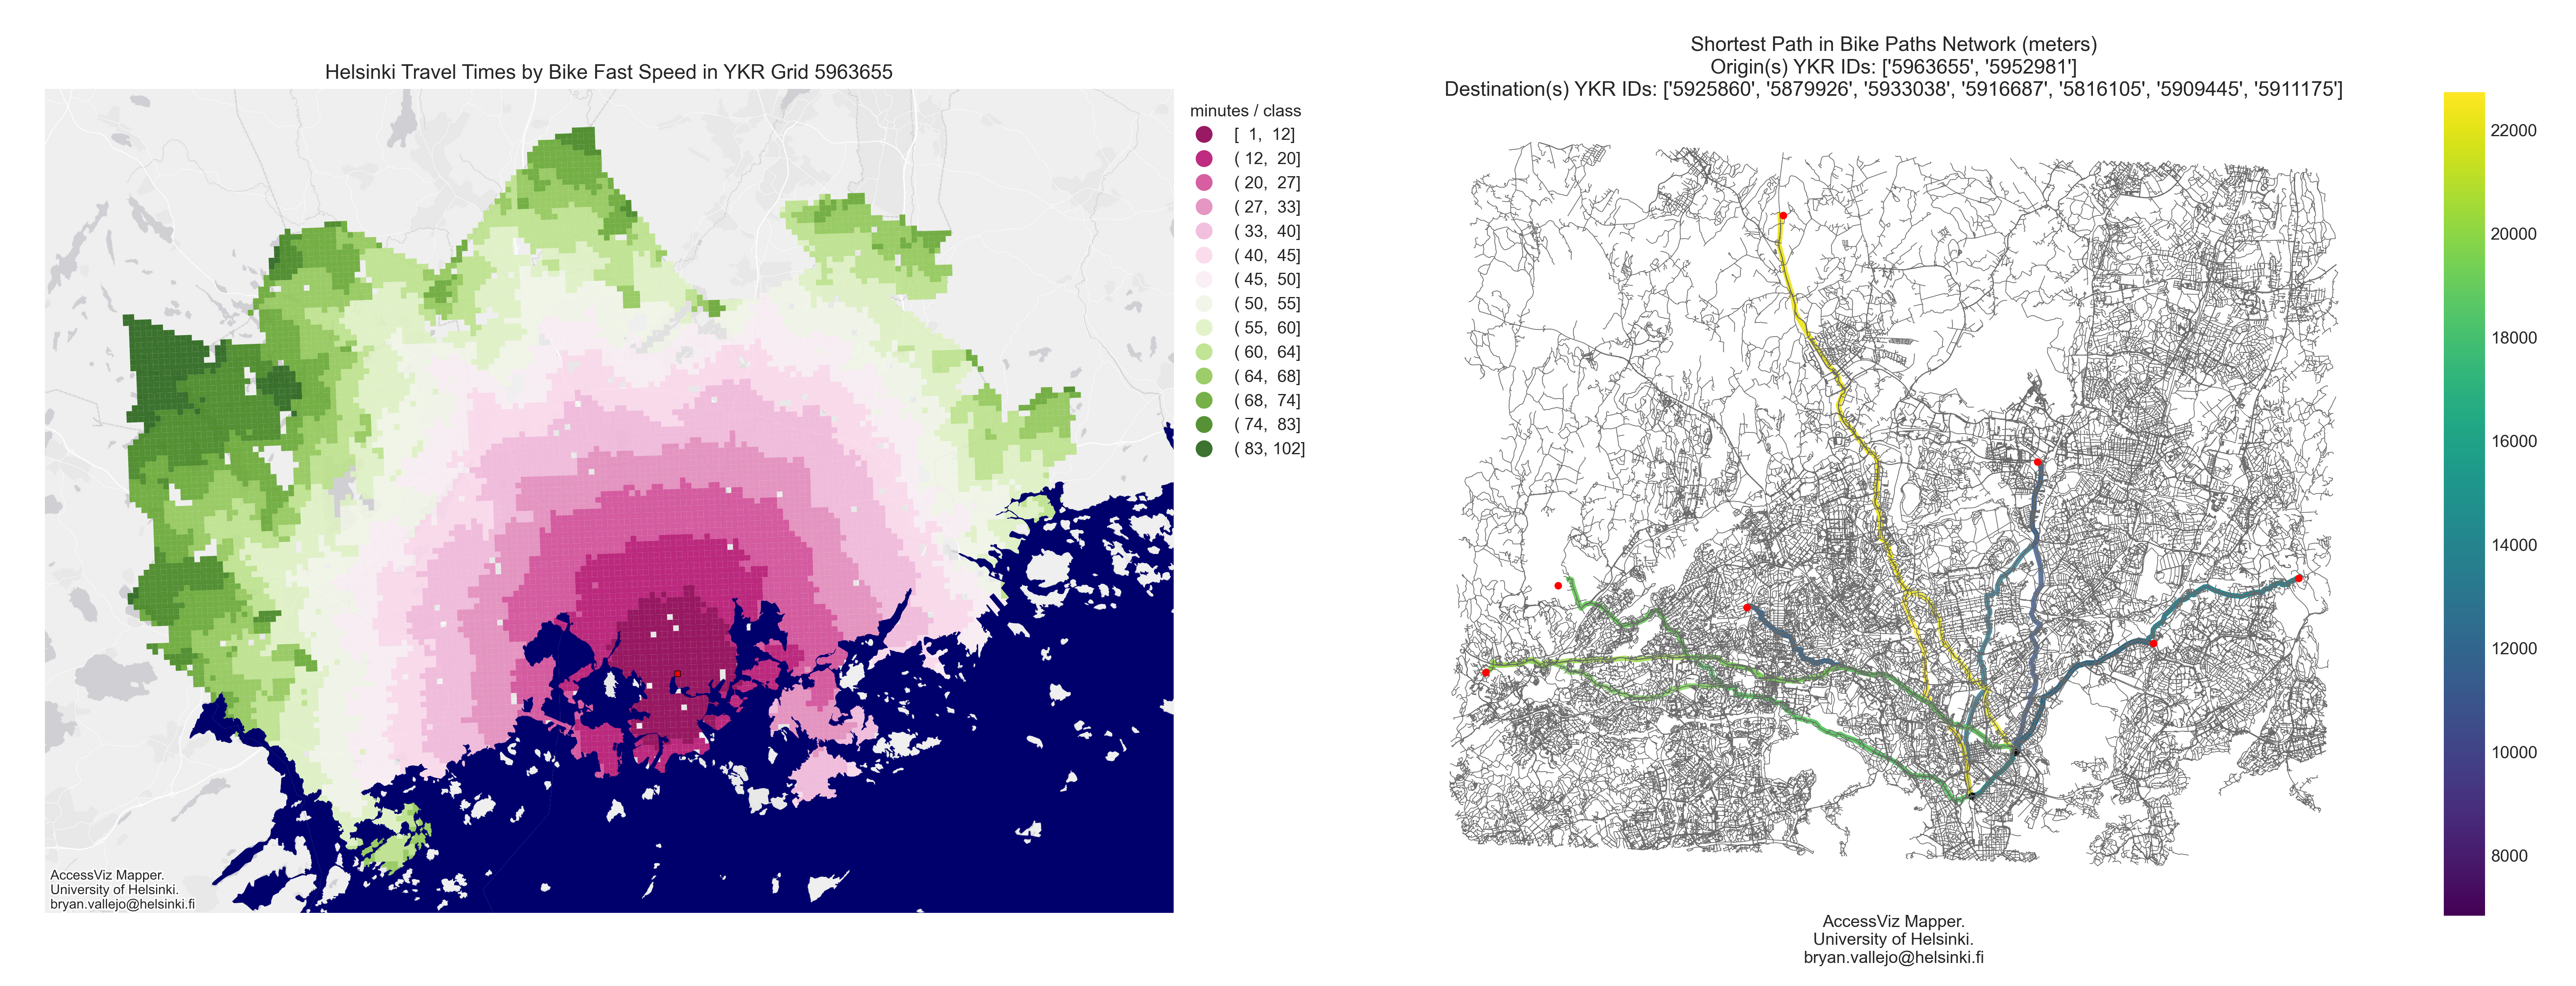
2. AccessViz Mapper – Tool for mapping accessibility by travel times in Helsinki Region
User-interactive local app to map the Helsinki Region Travel Time Matrix 2018. The maps can show accessibility by travel-times and/or transportation mode.
3. Nearest neighbor analysis for large datasets in Helsinki Region
Ball-tree function for efficient distance analysis between bus stops and restaurants.
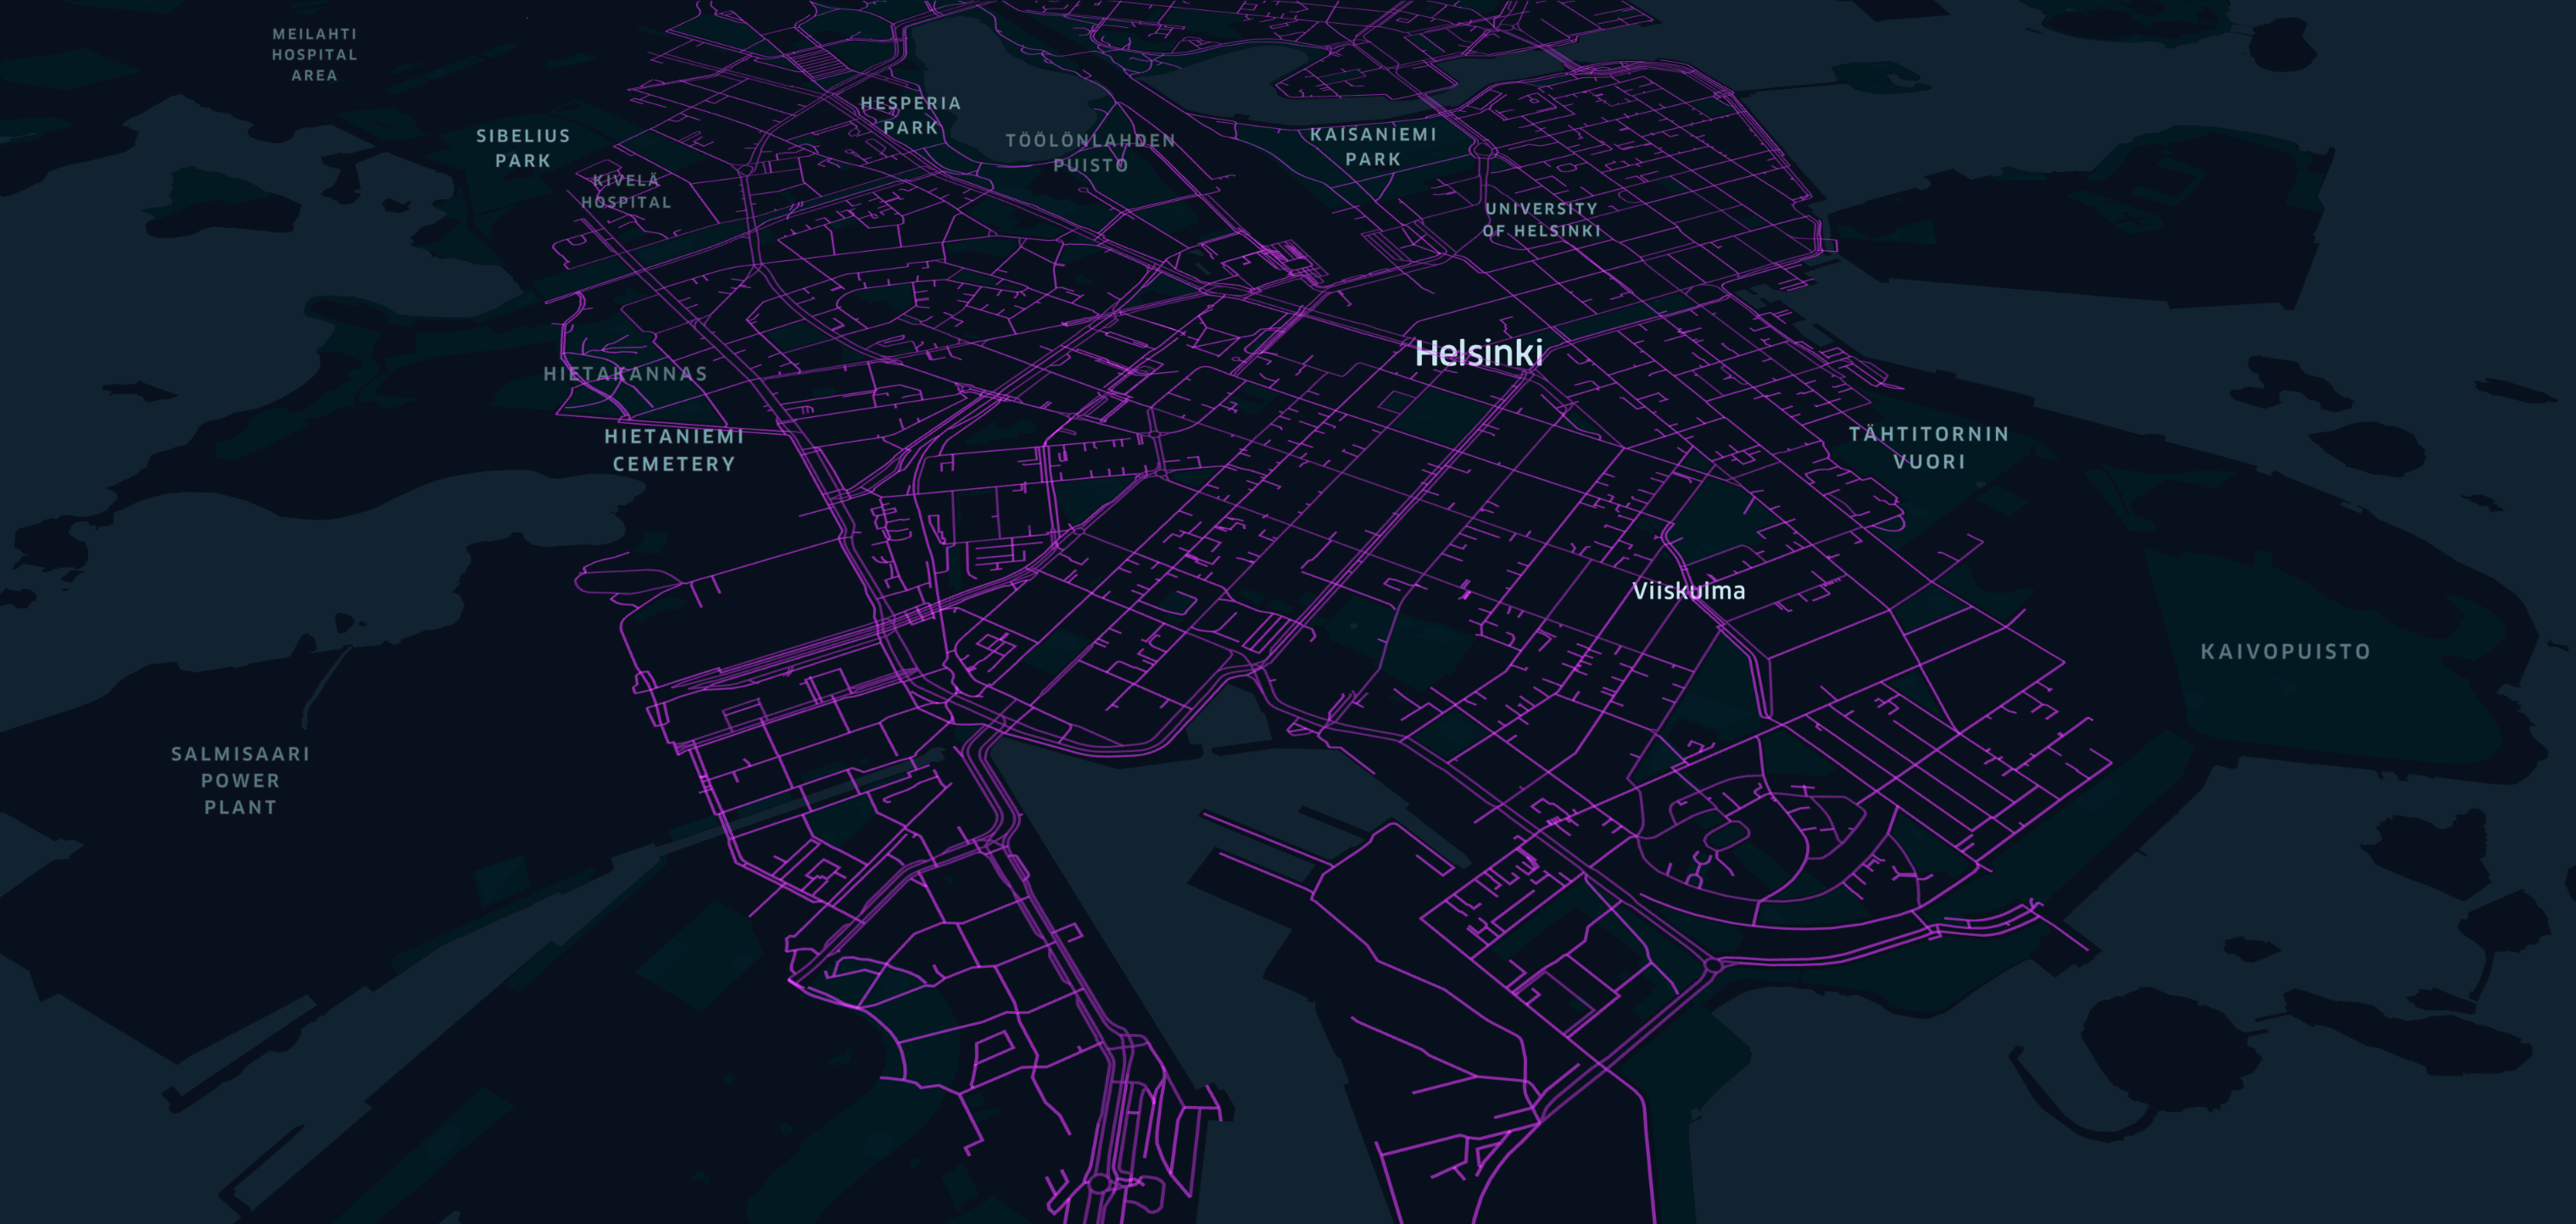
4. Shortest path algorithm with OSM walking network in Tartu, Estonia
Finding the shortest walking path with Open Street Map data from the Kissing Students monument to all cafes.
5. Shortest path algorithm used with OSM street network: biking, walking, and driving
GIS automation tips for shortest path analysis with cars, bikes, and pedestrians.
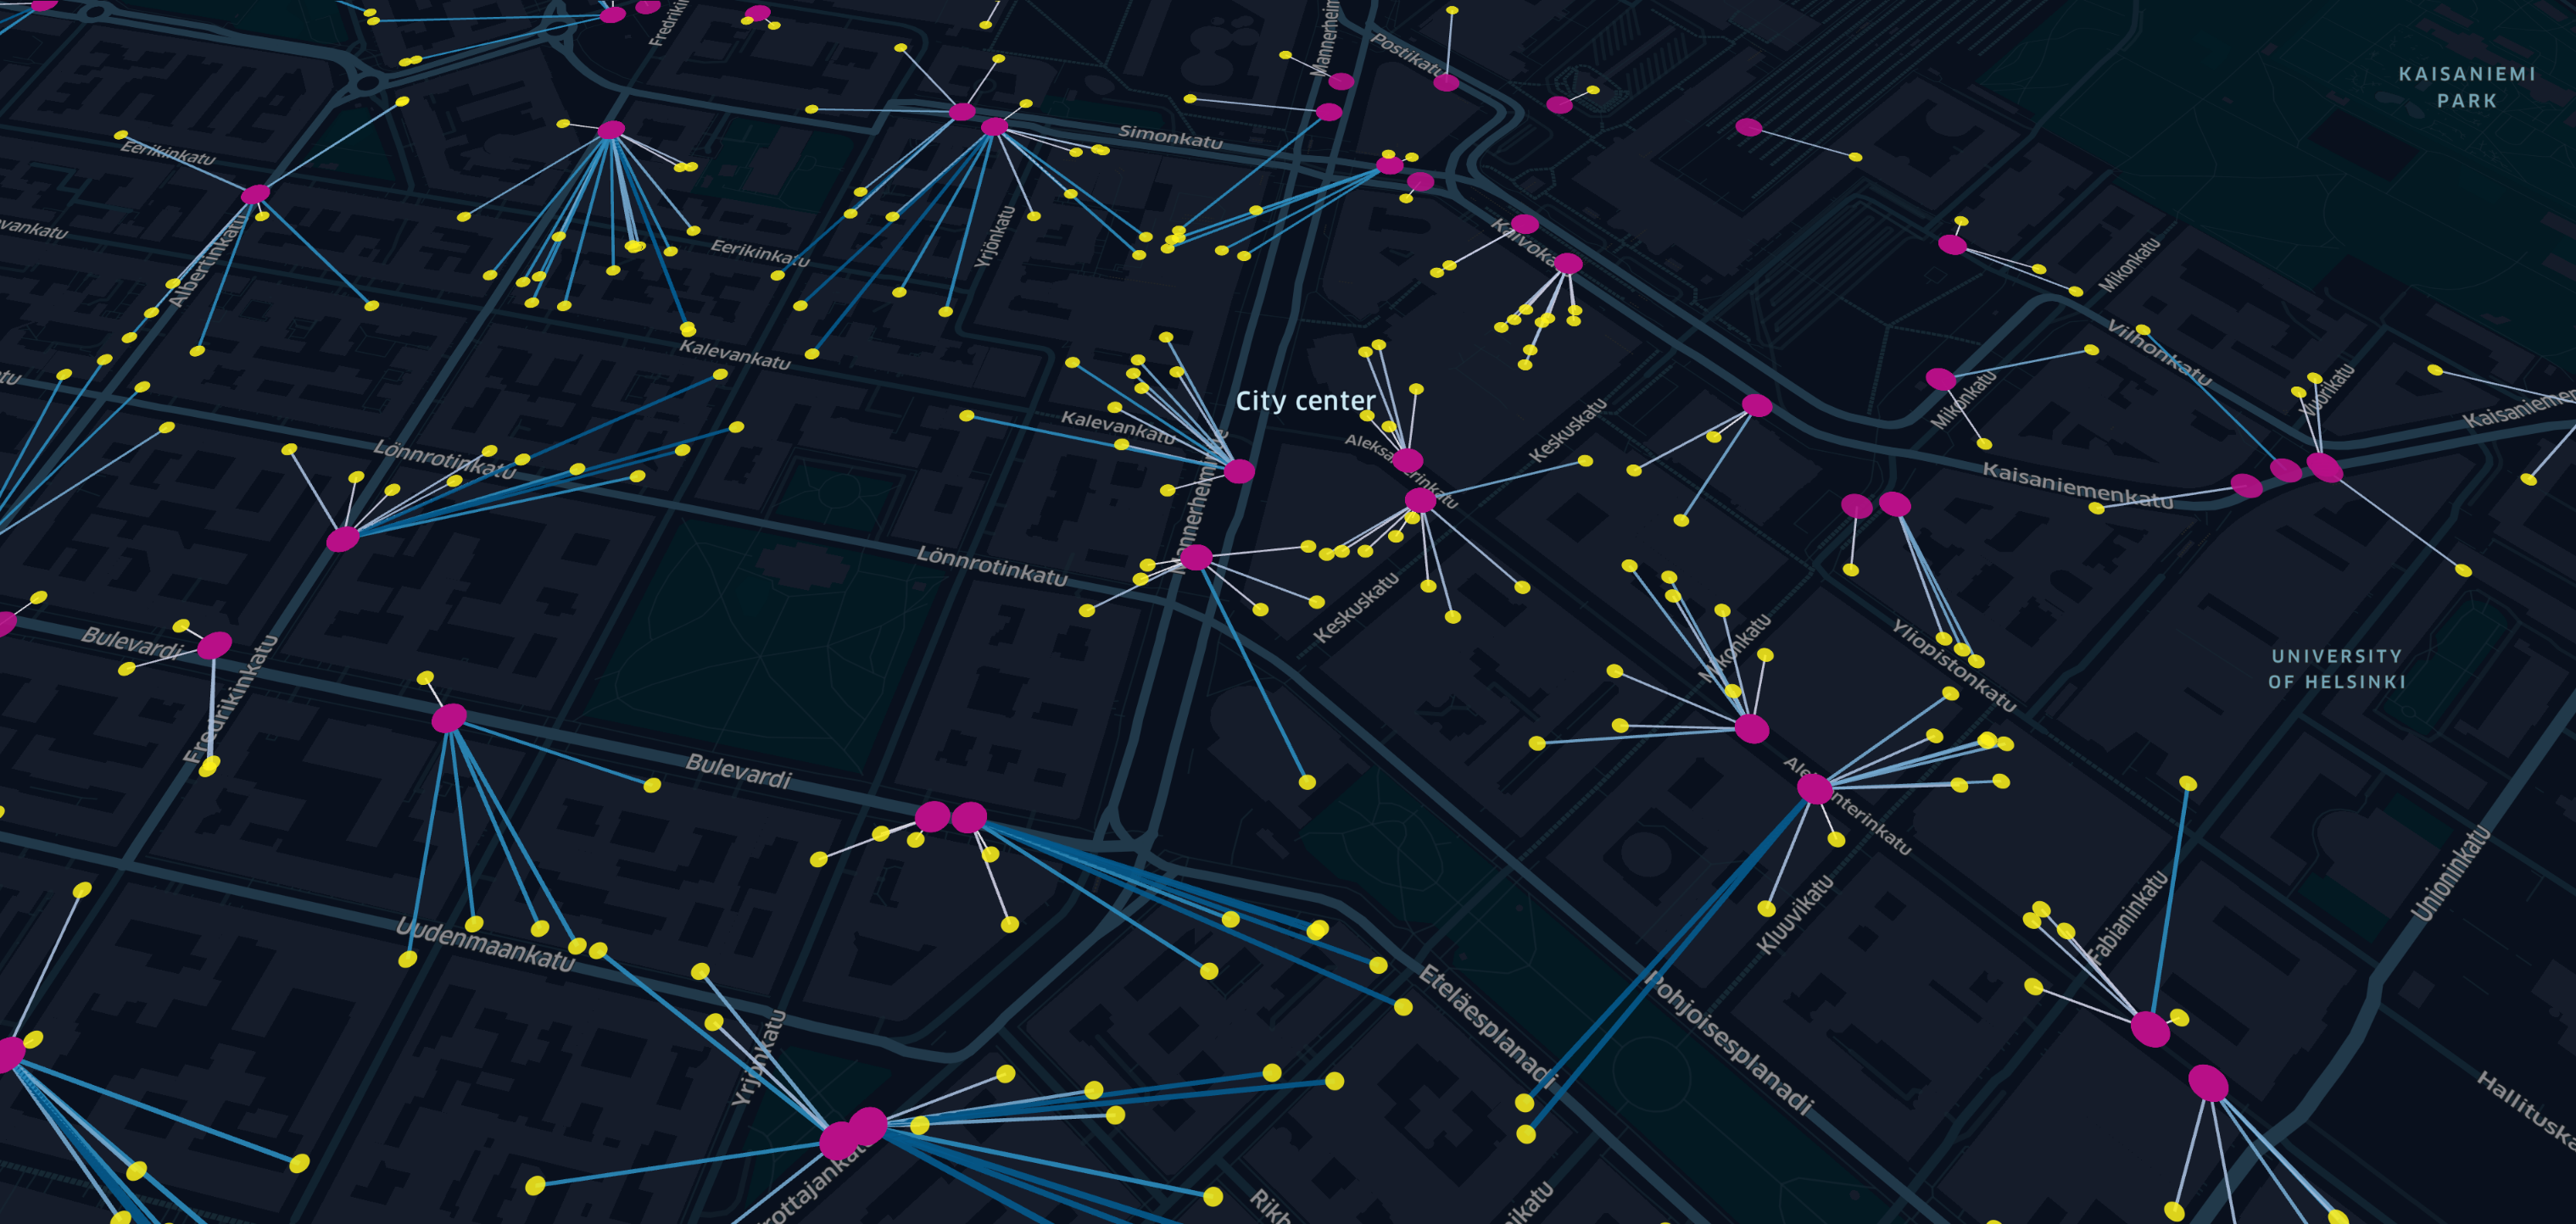
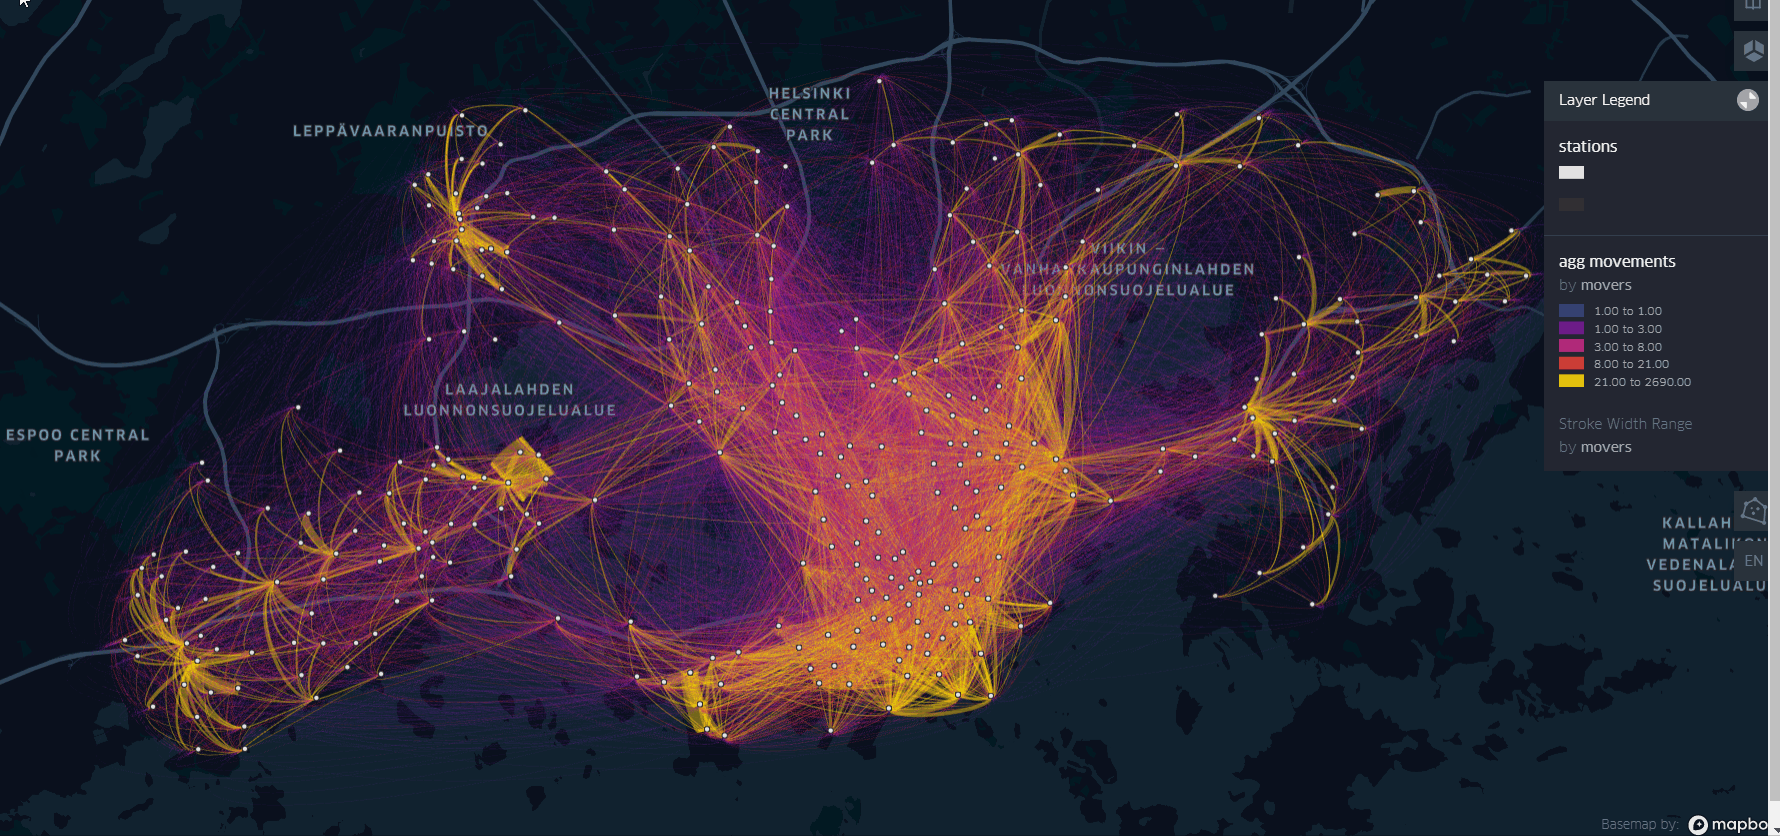
6. Bike Sharing System movements in Helsinki: aggregation and visualization with an interactive flow-map
Flow-map based on aggregated movements from OD-matrix of Bike sharing system movements during July 2019.
7. Discover the Urban viewer: an interactive web map to visualize population of Urban Areas Worldwide
How to create a web map with the Urban Agglomerations Worldwide in Leaflet?
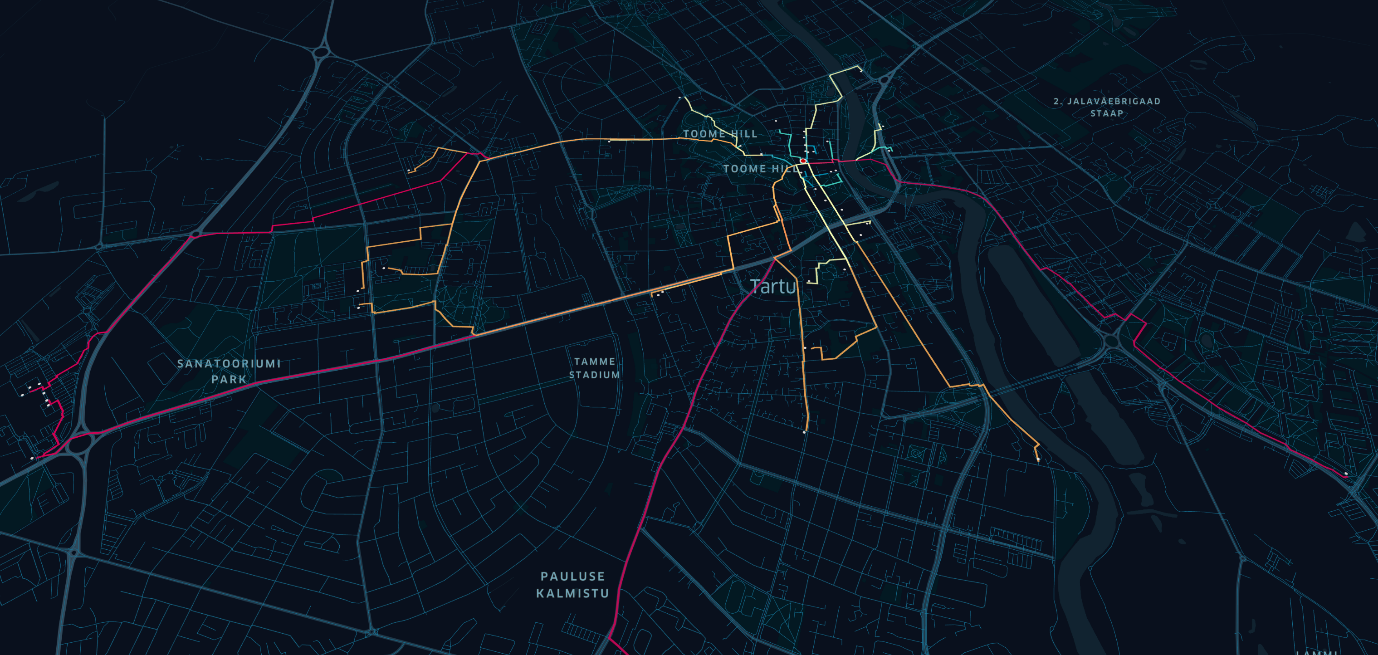
8. Interactive flow-map with an OD-matrix of regular movements in Tartu, Estonia
Interactive visualization of home-work commuting in Leaflet obtained from Call Detail Records (CDR).
9. Spatiotemporal visualization of yearly wildfires in Madagascar
Heatmap-animation with VIRS (375m) active fire data in Unfolded.
10. Stop detection in GPS tracks — MovingPandas & KeplerGl
How to create a point map with stop’s duration in birds migration tracking?
11. Stop detection in Blue Whales GPS tracking — MovingPandas 0.6
How to create a map animation with marine megafauna GPS tracks in KeplerGL?
12. Orthographic projection with pyproj for penguin tracking in Antarctica
How to create a map in Orthographic projection and a map-animation with penguin tracking data — Pyproj and KeplerGL?
13. Time-filter for Great Whale’s migration routes
Great Whale’s tracking records to Linestring with MovingPandas.
14. Foraging spots detection in Great Whale’s migration routes
Stop detection in Great Whale’s tracking records with MovingPandas.
15. Great whales migration and Phytoplankton hotspots
Personal project awarded as the 3rd place in the Blue Cloud Hackathon 2022.
16. Participation in the 30 Day Map Challenge
Twitter posts with maps by topic.