How is our research related to Sustainable Development Goals (SDGs)?

Authors: Janika Raun with all Digital Geography Lab members

In 2015, all United Nations member states adopted the 2030 Agenda for Sustainable Development that includes 17 Sustainable Development Goals (SDGs), each with their own set of associated targets (169 in total). The goals address social, economic, and environmental development aspects and call for urgent action, e.g., to end poverty, reduce inequalities and tackle climate change (Fig. 1). The SDGs are increasingly used by different actors of the society to structure and communicate their actions around sustainability.Figure 1. 17 Sustainable Development Goals. Source: https://sdgs.un.org/goals

Why the SDGs matter for us in DGL?

Universities play a crucial role in the achievement of SDGs as knowledge, innovation, evidence-based solutions, and good quality education are the basis for reaching the targets. As an interdisciplinary research group focusing on spatial Big Data analytics for fair and sustainable societies, we have always worked towards advancing sustainability. As SDGs, despite critique towards them (Arora-Jonsson, 2023), are increasingly used to communicate the sustainability actions in the society, we decided to map also our research activities at the Digital Geography Lab against the SDGs.

Continue reading “How is our research related to Sustainable Development Goals (SDGs)?”

MOPA project successfully completed! We showed the potential of electricity consumption data in multi-local living and second home research

Authors: Janika Raun, Olle Järv

MOPA (Monipaikkaisen asumisen rytmit, paikat ja asiakasryhmät) project revealing multi-local living patterns in South Savo based on electricity data analysis has reached its end. The project was led by the researchers from Ruralia Institute (Torsti Hyyryläinen, Manu Rantanen, Toni Ryynänen) and was done in collaboration with the Digital Geography Lab researchers Janika Raun, Olle Järv and Tuuli Toivonen.

AIM OF THE PROJECT

We started the project by thinking more broadly about how different big data sources could be utilised in second home research. We first provided an overview on the potential use cases in Finnish (Raun & Järv 2022), which then finally resulted in a coherent perspective paper, “New avenues for second home tourism research using big data: prospects and challenges”, published in the Current Issues in Tourism Research (Raun et al., 2022). The article is available open access here: https://doi.org/10.1080/13683500.2022.2138282.

Our literature analysis for the article revealed that so far utility consumption data has been used relatively little in second home and multi-locality research. However, it has a high potential to uncover where second homes are located and when they are actually used and visited. Thanks to the fruitful collaboration between Ruralia Institute and the local electricity company Suur-Savon Sähkö Oy we were able to use monthly-level electricity consumption data of second homes and analyse what it can tell us about the multi-local living practises in South Savo. Our aim was to understand the spatiotemporal rhythms, variations, and trends in second home usage patterns and identify different user groups. Read more about the start and aims of the project from one of our previous blog posts.

WHAT WERE THE MAIN RESULTS?

Electricity consumption in second homes increased during the COVID-19 pandemic.

Our results reveal that the electricity consumption in second homes has increased, especially during the years 2020 and 2021, indicating the intensified usage of second homes during the pandemic. The increase was biggest in areas with the highest relative share of free-time residences, such as Hirvensalmi, Mäntyharju, and Puumala municipalities. This finding is in line with the results of a previous study made in Finland using mobile phone data, which indicated that people escaped from cities when the pandemic started, and the increase of people was biggest in municipalities with the highest relative share of second homes (Willberg et al., 2021; and DGL blog posts here). The increase in electricity consumption was highest during the spring and autumn months, indicating that people extended their summer season and spent more time in their second homes also late spring and early autumn (Figure 1).

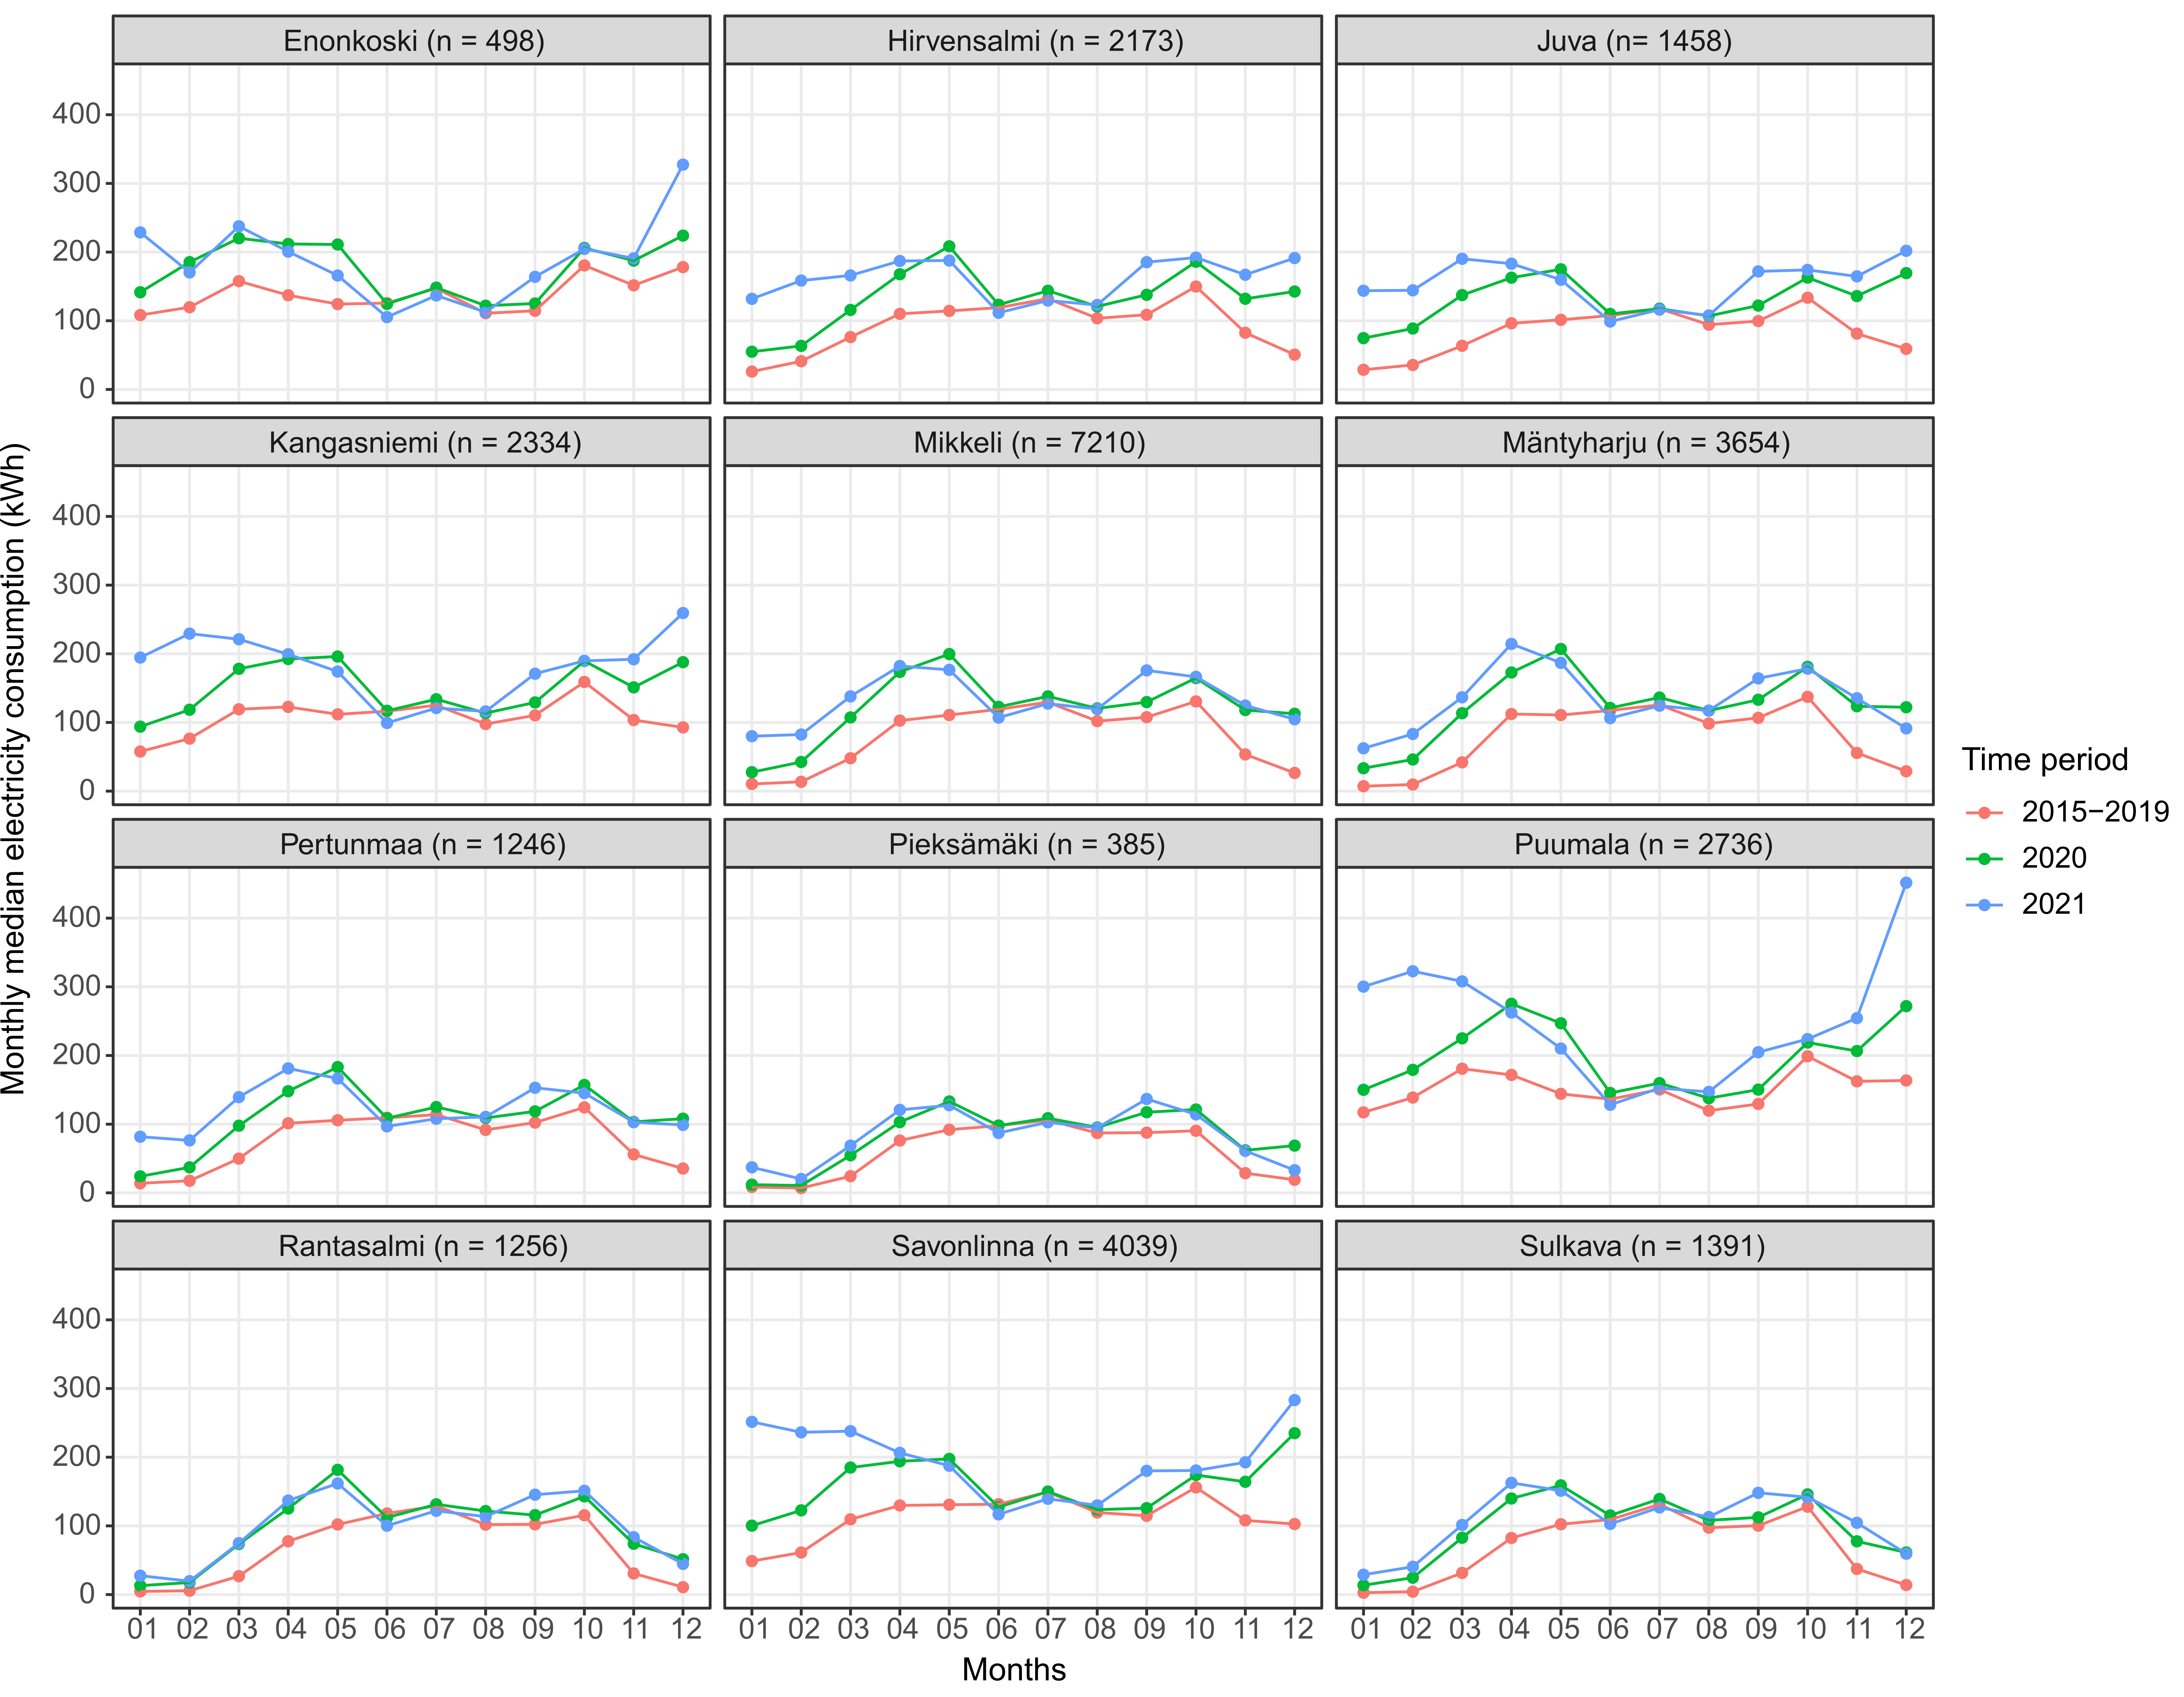
Figure 1. Monthly median electricity consumption (kWh) in municipalities during three periods: average for 2015-2019, 2020 and 2021. N represents the number of free-time residences in January 2021. Continue reading “MOPA project successfully completed! We showed the potential of electricity consumption data in multi-local living and second home research”

MSc thesis on studying multi-local living in Finland using mobile phone data and electricity consumption data

Author: Iivari Laaksonen

Why is the study relevant?

Multi-local living can be defined by individuals or families having access to more than one residence in their everyday lives. It is a complex social phenomenon causing weekly and seasonal changes in population numbers as people move between regions. This means that the phenomenon is tightly connected to human mobility. In prior research, multi-locality has been mainly studied using official statistics that fail to capture the dynamic nature of people’s mobilities and dwelling. To address this in my thesis, I utilized spatially and temporally accurate big data sources − mobile phone and electricity consumption data − to capture people’s presence and mobility. More accurate information about multi-local living can be useful for local businesses and regional planning in rural areas.

How was the research done?

In my thesis, multi-local living was studied in Finland and in the county of South Savo, which has the highest proportion of second homes/free-time residences in the country. The study was done by analyzing spatiotemporal changes in people’s presence (mobile phone data from Telia Crowd Insights) and by examining how the changes relate to the number of second homes (official statistics) in different areas with correlation analyses. In addition to monthly comparisons, analyses were conducted separately for workdays and weekends to assess how people’s multi-local practices differ between weekdays. The study period of the thesis was from November 2018 to August 2019.

Mobile phone data also contains information about people’s origins (previous night location). This allowed to assess the proportions of origin counties of people visiting South Savo. Moreover, mobile phone data was used to assess the results of second home occupancy in South Savo gained from electricity consumption data which had been previously calculated in the MOPA research project.

Continue reading “MSc thesis on studying multi-local living in Finland using mobile phone data and electricity consumption data”

Geoparsing: How to gain location information from (Finnish) texts?

Author: Tatu Leppämäki

In a nutshell: A geoparser recognizes place names and locates them in a coordinate space. I explored this topic in my thesis and developed an open source geoparser for Finnish texts: find it in this GitHub repo. 

As geographers, we are interested in the spatial aspects of data: where something is located is a prerequisite to the follow-up questions of whys and hows. Of the almost innumerable data sources available online – news articles, social media feeds, digital libraries – a good portion are wholly or partly text-based. Texts and the opinions and sentiments within are often related to space through toponyms (place names). For us humans, it’s very easy to understand a sentence like “I’m enjoying currywurst in Alexanderplatz, Berlin” and the spatial reference there, but geographical information systems process data in unambiguous coordinates. To bridge this gap between linguistic and geospatial information, the text must be analyzed and transformed: in other words, it must be parsed. This is the motivation for the development of geoparsers. 

Geoparsing: what and why 

Geoparsing can be divided into two sub-tasks: toponym recognition and toponym resolution. In the former, the task is to find toponyms amidst the text flows and in the second, to correctly locate the recognized toponyms. A geoparser wraps this process and outputs structured geodata. 

Geoparsing: a top-level view. 

Continue reading “Geoparsing: How to gain location information from (Finnish) texts?”

Modelling and understanding greenery on the scale of people: A look into Jussi Torkko’s MSc thesis

Author: Jussi Torkko

The highlights of the study

Throughout late 2020 and 2021, with the help of Digital Geography Lab, I did my master’s thesis on modelling and understanding how people experience greenery. Most often greenery is observed from a top-down point of view, through the sensors of aerial vehicles or satellites. However, we do not know sufficiently well how greenery measures captured from high above match the true greenery experience by the people on the ground level. This experienced greenery is termed human-scale greenery for this thesis. Methods for modelling and quantifying human-scale greenery are based on data sources like street view images or LiDAR. Similarly to the top-down perspective, it is not known how well these data and methods reflect the experience of people.

This lack of knowledge is what I set out to solve with this thesis. By comparing greenery assessments collected from people by interviews to modelled greenery values from the same locations, I was able to show that all tested greenery modelling methods have a strong linear relationship with the greenery that people experience. However, the results also revealed that the modelling methods underestimate the amount of greenery people perceive and that while the modelled values share a strong relationship with surveyed greenery, there are significant deviations between the modelled and perceived values. Also interestingly, methods created specifically for quantifying human-scale greenery do not always appear to have an advantage over traditional top-down greenery assessment methods.

While interviewing people, I also collected limited sociodemographic data of the respondents. I found that age may affect people’s relationship with greenery, but this could not be confirmed with certainty. However, it was clear that people with less experience of nature and belonging to the age group around 30 years were met more frequently at study sites with low greenery values than other groups of respondents. In future studies, additional attention should thus be given to how people can experience human-scale greenery. More detailed descriptions of the results for both modelled and sociodemographic pathways can be found in the thesis.

Continue reading “Modelling and understanding greenery on the scale of people: A look into Jussi Torkko’s MSc thesis”

Wrapping up my unforgettable stay at the Digital Geography Lab as a visiting member

Author: Bryan R. Vallejo (@BryanRVallejo)

I remember one day when I was carrying out research about the accessibility of elderly population in the context of the steep streets of the historical center of Quito, Ecuador. I found an outstanding paper related to accessibility modelling as a function of time. Since then, I started reading papers written by the members of the Digital Geography Lab (DGL) and my curiosity about their work in geography got awaken. I hoped that one day I will be able to learn from them and gain understanding how to examine our society through digital data and novel tools. Surprisingly, after a year and a half, I am a former visitor of DGL, and I can truly say that this experience was life changing!

Thanks to the University of Tartu, I got the opportunity to be an exchange student during my master studies in geoinformatics. I wanted to learn geospatial analysis and Python programming, and advance my skills in the well-known Python courses given by the members of DGL. The courses taken at the University of Helsinki were an excellent match, and fortunately, I was able to use my new coding skills when joining DGL as a trainee in the BORDERSPACE project under the supervision of Olle Järv.

Continue reading “Wrapping up my unforgettable stay at the Digital Geography Lab as a visiting member”

Open spatial data reveals 24-hour population dynamics of people in Helsinki Metropolitan Area

Press release

The researchers of the Digital Geography Lab at the University of Helsinki have published spatial data describing the daily rhythms in the population distribution in the Helsinki Metropolitan Area as open data.

Spatial population distribution in the Helsinki Metropolitan Area between 11-12 AM on a regular workday. The diagrams show the variation of the population in given locations during 24 hours from the daily average. (Bergroth et al. 2022)

Their article in the journal Scientific Data describes how the data set was created based on mobile phone data, and how it can be used. This is one of the first times that detailed dynamic population data is released openly for any city of the world. Continue reading “Open spatial data reveals 24-hour population dynamics of people in Helsinki Metropolitan Area”

OptiSS 🧐 — A tool to optimize spatial joining of social media data

Authors: Bryan Vallejo, Olle Järv

We developed the OptiSS tool to optimize geodetic spatial joining for assigning geographical attributes to social media data in the BORDERSPACE project at the Digital Geography Lab. The tool has a user-friendly local app, yet its Python script can be easily used in any workflow.

Why we developed the tool?

In the BORDERSPACE project, we need to assign hierarchical spatial attributes (municipality, region, country) to each geo-located tweet. Mostly, geo-located tweets obtained from Twitter’s API already have geographical information such as an administrative unit and a country, in addition to exact coordinates. Yet, not all tweets have such information and, most importantly, some tweets are not located on land – some are just off the coast or somewhere at sea (Figure 1). However, geodetic spatial joining requires computational resources and is time consuming, especially when we have 100+ million geo-located tweets to handle. Thus, we created the OptiSS tool to make computation more efficient. The tool works for any social media data that have at least geographical coordinates.

Figure 1. The OptiSS tool assigns geographical attributes like municipality or country efficiently to social media posts. This is useful particularly when posts are not only located on land, but also off the coast (highlighted in red circles). Continue reading “OptiSS 🧐 — A tool to optimize spatial joining of social media data”

New project revealing multi-local living from electricity data has taken off

Authors: Janika Raun, Olle Järv

The Digital Geography Lab is taking part in the MOPA-project (Monipaikkaisen asumisen rytmit, paikat ja asiakasryhmät) to analyse the spatiotemporal patterns of second home use and its users from electricity consumption data. The project is led by the researchers from the Ruralia Institute.

Why and what we study?

The recent Covid-19 pandemic has rapidly increased the number of people spending time and working remotely in their second homes. Thus, second home tourism is increasingly blending with multi-local living – people are residing in several homes and moving often between them. To understand those dynamic changes in mobility patterns new data sources are needed, because the traditional methods cannot fully grasp the rapid changes in second home use, neither provide timeliness information for stakeholders to quickly adopt. During the last decade, mobility studies in general, have widely taken advantage of the use of different big data sets to understand human mobility. However, there is little research carried out that utilizes big data in second home research.

The aim of the MOPA project is to use primarily electricity consumption data to understand the spatiotemporal mobility patterns to second homes and distinguish between different user groups based on the consumption patterns. The data is provided by the electricity company Suur-Sävon Sähko Oy about the South Savo region that is one of the well-known second home hotspots in Finland. We also use aggregated mobile phone data to evaluate how well electricity consumption data properties reveal the presence of people. Continue reading “New project revealing multi-local living from electricity data has taken off”

MSc thesis on capturing the mobility of minority language groups in Finland using Twitter data

Author: Emil Ehnström

Why study the spatial mobility of language minorities?

People are increasingly more mobile that has led to a more complex world. One outcome of this is the linguistic diversification of societies, which has raised the issue of language groups’ integration to a society, but also of their transnationality while people in their new society are still connected to their previous society and culture. One way to understand people’s connectedness to their origin society and integration to their host society is to study their mobility patterns. With novel data sources, like geo-located social media data, it is possible to acquire information on both cross-border and local mobility patterns of language groups.

The three language groups studied in my thesis have different characteristics. Swedish is a national language of Finland and Swedish speakers are generally considered an integral part of Finnish society. Russian speakers have arrived in Finland during multiple time periods, but significantly more since the 1990s during the immigration of the Ingrian-rooted people from the former Soviet Union. Therefore, Russian speakers form a rather heterogeneous language group in Finland. Estonian speakers started moving to Finland since the 1990s and in particular after Estonia joined the EU and the Finnish labour market became more accessible for Estonians. As Estonia and Finland are geographically close, people from Estonia have moved to Finland mainly due to work, while keeping tight connections to Estonia. This has hindered them from fully integrating to the Finnish society. Continue reading “MSc thesis on capturing the mobility of minority language groups in Finland using Twitter data”