

Different kind of built sport facilities have different kind of density and service networks. Some sport facilities such gyms (fitness centres) are high in number compared to for example disc golf courses. There are several reasons why amount, location and density of such facilities differ. Disc golf courses need more space and frequent users are ready to travel longer distances to play a round in their favorite courses. But gyms are higher in number and the density of gyms in the city is higher. Typical gym users most likely use the closest gym and gyms need less space. And typically different gyms or fitness centres might have been specialized to certain forms of exercises or sports. In addition gyms are typically commercial, but ball parks for example are maintained by municipality or city. Ball parks are typically located near schools or larger sports parks. Therefore, the spatial network and density of different sport facilties vary a lot.
Writer: Petteri Muukkonen
For above mentioned reasons, if a researcher or a planner studies spatial accessibility of sports facilties, one should consider what sports they are studying. MSc Pyry Lehtonen has studied in his master’s thesis in geography how spatial accessibility to those three types of sport facilities occur in the city of Helsinki and city of Jyväskylä. These three types of sport facilties provide a brief overview for spatial accessibility of different age groups. In one thesis one can’t study all sports and sport facility types. Therefore Lehtonen selected these three sport facility types. Ball parks can be used for various ball games and are typically used by younger citizens. Disc golf is popular within young adults, but also families are playing that. And fitness centres (gyms) are used by adults of various age. And fitness centres are providing supervised sessions for various groups. What we are missing is the ordinary walking or everyday mobility. Walking is the most common habit of physical activity within adults and especially elderly people. But that can’t be studied in the same context what Lehtonen has done because walking routes are line features but selected sport facilties are point features in the map. And people are staring their walking in most cases from their home steps. So studied sport facilities in this thesis were: 1) disc golf courses, 2) fitness centers, and 3) ball parks. The assumption was that as the distance grows larger the interaction decreases with the facility or service.
In his study Lehtonen analyzed spatial accessibility as travel times with two main transportation modes when considering moving from home to do sports – cycling and driving by car. Then he compared these calculations with demographic data (Ruututietokanta) provided by the Statistics Finland. Both data sets (travel times and demographic data) use same 250 x 250 m grid. This helped to combine data sets easily. Geographer Pyry Lehtonen studied in his thesis what kind of spatial pattern these data sets and their variables form in the study areas. He tested the spatial autocorrelation and clustering with the Local Moran’s (so called LISA clusters) and Bivariate Local Moran’s calculations.
LISA clusters tell if various locations (grid cells in our case) are forming clusters where high-high values or low-low values are located near each others. For example in the figure 1 you can see how travel times by private car to nearest fitness centres form statistically significant clusters both in Jyväskylä and Helsinki. In the result map dark blue grid cells form clusters in certain neighborhoods. This means that on those areas travel times for nearets fitness centres are short, and therefore the situation for people living there is better in the dark red areas in the map. These clusters are neighborhoods or living areas with poor spatial accessibility to fitness centres. In both cities these areas are typically remote or surrounding living areas. But anyway, this creates an unequal situiation for the potential opportunities to do certain sports. One should use more time to travel to the nearest fitness centre. This might prevent people to do sports or live with active life style – or they must do something else than gym exercises. Pyry Lehtonen has published all result maps as appendixes in his thesis, which is available online in the thesis repository here.
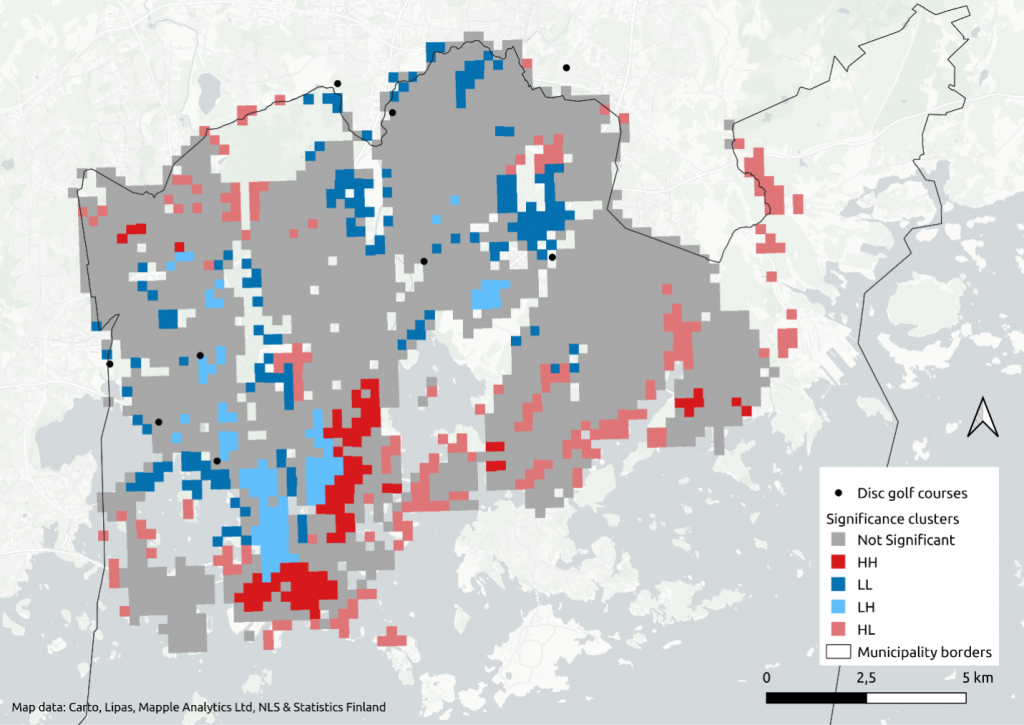
But when adding a second variable to analyses we can study how hight or low travel times are connected (and then clustered) with high or low proportion of certain demographic variable – let’s say amount of young adults for example (see Figure 2). In the map HH (high-high) means high travel time values and high amount of young adults, LL (low-low) means low travel time values and low amount of young adults etc. So, this analyse indicates how some potential disc golf players (most commonly young adults are playing the game) are clustered far away from disc golf courses (dark blue areas). LH (low-high) areas have large amount of potential players and travel times are low. So, in these places there occur a solid bases of potential users, and disc golf courses are more easily accessible. Again, for all results maps (all three sport facility types and all traportation modes see Lehtonen thesis and its appendix maps). To conclude Lehtonen’s main findings one should notice that there occur clustering in travel times when considering moving times to the nearest sports facility. And different kind of sports have different kind of service networks. This influences unequal opportunities to use certain sports – or in fact to travel to those facilities. And different sport facility types have different kind of pattern of potential users or customers. And these aspects and needs does not fit in every locations. These results indicate that there occur statistically significant clustering, but results does not tell how large these time differences are.
Source:
Lehtonen, P. (2021). Accessibility of sports facilities in Helsinki and Jyväskylä: a comparison. MSc thesis. Master’s Programme in Geography, University of Helsinki: Helsinki. 52 p. + 27 appendix pages. http://urn.fi/URN:NBN:fi:hulib-202110153894
This text is published earlier in the YLLI project’s blog at 28.6.2022.