Hi there, and welcome to the HiLIFE-Trainee blog! I’m Olivia Dreilinger, a second-year Master’s student in the Genetics and Molecular Biosciences program here at UH.
This winter I participated in Physalia’s course on Flow Cytometry Analysis with R/Bioconductor. The course was held digitally to facilitate a greater geographic range of students. Throughout the course, in addition to the lectures and coding sessions, I was able to interact with researchers and PhD students from all over the world. This made for an exciting learning environment. The conversations I had with the other participants about their work and career paths were especially inspiring.
And now, let me tell you a little more about flow cytometry, how we can analyze this fascinating data, and how I will apply this new knowledge in my work at UH.
Flow Cytometry
Flow cytometry is a powerful tool that can sort a complex mixture of cells, often from blood or bone marrow or cells from solid tissue that have been separated from each other (dissociated) into populations of different cell types. This can be used to count the number of cells belonging to a certain type or for downstream investigation of the cells such as gene expression analysis or functional assays. It has applications in cancer biology, immunology, infectious disease monitoring, and numerous other areas of cell biology. Here’s how it works: one by one, cells are sent through a machine which uses multiple laser beams to “read” properties of the cell. The machine does this by measuring how light is scattered in the forward and side direction and indicates the cell’s size and complexity (granularity) respectively. Additionally, the flow cytometry machine can detect fluorescence, making even finer distinctions between cellular subpopulations possible. Cells can be made to express fluorescent markers through staining, thus allowing for this higher level of resolution.
Once the cells have been sorted, the flow cytometry instrument returns a file regarding each cell’s fluorescent intensity with respect to each marker used. This data must then be analyzed in order to extract meaning and identify different cell populations, thus allowing for downstream research and diagnosis by comparing measures such as number of cells or mean fluorescence in each subpopulation of cells.
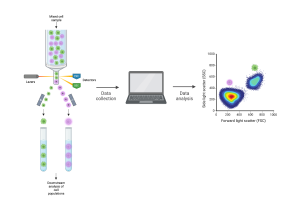 [Flow cytometry schematic. Cells are sent through the flow cytometry instrument one by one. The machine detects their properties and sends them to a computer for analysis. The cells can be separated by type for downstream analysis. Created with BioRender.com.]
Data Analysis
The trainee course I took focused on the step of turning the fluorescent intensity data into something meaningful about different cell populations. The first crucial step is preprocessing, which includes compensation, transformation, and cleaning—basically, the data needs to be tidied up for ease of use. Once this house-keeping task is complete, we can move on to the part we care about, namely identifying the cell populations.
The flow cytometry data can be displayed on a two dimensional plot with each axis representing the fluorescence of a given marker or how much light is scattered in a certain direction. The cells then cluster by type depending on their properties. Traditionally, these cell subpopulations were identified by eye and circled in a process called manual gating. This process can be repeated over and over again comparing different markers giving a complex gating strategy. The gating process can be automated with software packages in R such as FlowDensity and FlowSOM. This strategy looks at density of cells and uses it to determine the cell populations. 
[A gating strategy for identifying cell populations. Here we can see the step-wise identification of cell populations, beginning by first identifying live cells, and then distinguishing which cells are lymphocytes from the other cells. From there, the gating strategy separates the cells that are granulocytes and continues finding subpopulations from those that are not granulocytes, and so on, using the properties of the light detected by the flow cytometry machine for each cell. Figures generated in Physalia’s Flow Cytometry Analysis with R/Bioconductor course, 2023.]
Current Research at UH
The Integrative Evolutionary Biology lab, where I am doing my thesis, uses flow cytometry to identify and investigate different types of color cells (or chromophores). We study cichlids which are tropical fish native to lakes and rivers of India, Africa, and South and Central America. There are thousands of different species of these fish with distinct and vibrant color patterns making them an exciting model system to study when it comes to the evolution of cell types and the composition of these fishes’ colorful skin. As shown below, there are a number of different chromatophores: melanophores which are dark in color, iridophores which appear iridescent and blueish, and xanthophores which are yellow. We are using flow cytometry to study the composition of cichlid skin across different species within the Cichlidae family. I’m excited to start applying what I learned in this course to our data. 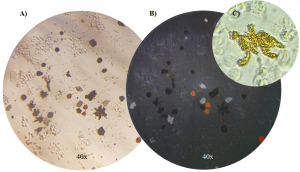
[Images of the color cells (chromatophores) we are studying in cichlid skin. A) dark dendritic melanophores, B) iridescent, blue iridophores, and C) a close-up of a dendritic yellow xanthophore. Credit Alexandra Faur, Integrative Biology Lab.]
I am grateful to HiLIFE for awarding me the HiLIFE Trainee Conference Grant and to the Integrative Biology Lab for making it possible for me to participate in this excellent course, which deepened my knowledge of flow cytometry, and provided me with the tools to find meaning in this kind of data. I look forward to utilizing this technology in the future.
— Olivia Dreilinger