Hi, all of you reading this HiLife trainee blog! I am Vilja and I am a master’s student in genetics and molecular biosciences. At the beginning of this year, I was looking for a master’s thesis position, and I wished to find a project related to cancer or other tumors. I also wanted to further develop my skills on bioinformatics. I was super excited to get a master’s thesis position at Pia Vahteristo’s research group studying gynecological tumor genomics. I was supposed to start with my master’s thesis project in June, but the COVID-19 pandemic changed my plans. In the middle of August, I was happy to finally start with a very interesting project.
In my master’s thesis project, I am analyzing the genomic data of uterine leiomyomas. Uterine leiomyomas are benign smooth muscle tumors of the uterus. The prevalence is up to 70–80% in women. I am focusing on structural variants, such as translocations, inversions, insertions, huge deletions and amplifications. The HMGA2-RAD51B translocation is one of the best characterized structural variants in leiomyomas. This means that part of the chromosome 12 is attached to a part of the chromosome 14, so that HMGA2 receives active regulatory elements of RAD51B. This leads to a much higher expression of HMGA2 in tumor cells compared to normal cells. In addition to this well-known translocation, we have been lucky to come across and characterize some other structural variants in uterine leiomyomas.
Structural variants can be studied in many ways. Sometimes, if you have a hunch of the putative genes mutated and you are lucky enough, you might find something interesting by simply visualizing genomic data on IGV or some other visualizing software showing the alignment of paired-end data. There are also many bioinformatics tools which look for structural variants by utilizing algorithms. These tools, such as Delly, are analyzing discordant reads and split reads of the paired-end data. Also, bioinformatics tools analyzing read coverage can be used to detect copy number variations. Once you have found a structural variant, you may want to validate your finding. This can be done by using PCR and Sanger sequencing. These steps are exactly the ones that I am using for my master’s thesis project.
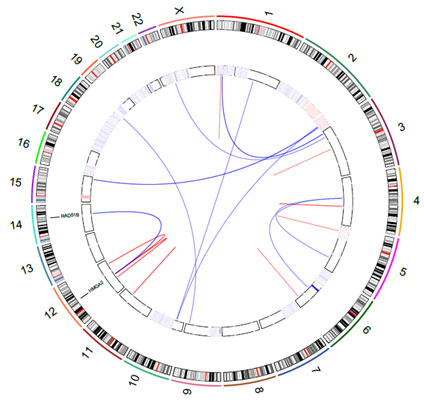
Circos plots are a nice tool for visualizing these structural variants. In the figure, you can see one of the preliminary Circos plots I have made by using RCircos (R package). Lines show translocations between chromosomes and intrachromosomal inversions, and the circular heatmap indicates copy number variations.
I have learned so many new things during the process, and the project is not even completed yet. For example, I have developed my skills in bioinformatics and learned about genetics and tumorigenesis of leiomyomas. I have also gained a better understanding of how research projects are performed and how technical difficulties can be approached and tackled. I am super lucky that I have had such great supervisors and colleagues, who I really want to thank. Also, I am very grateful for the support I have received from HiLife. It has been extremely valuable.
Vilja Jokinen

