Author: Justin Gage
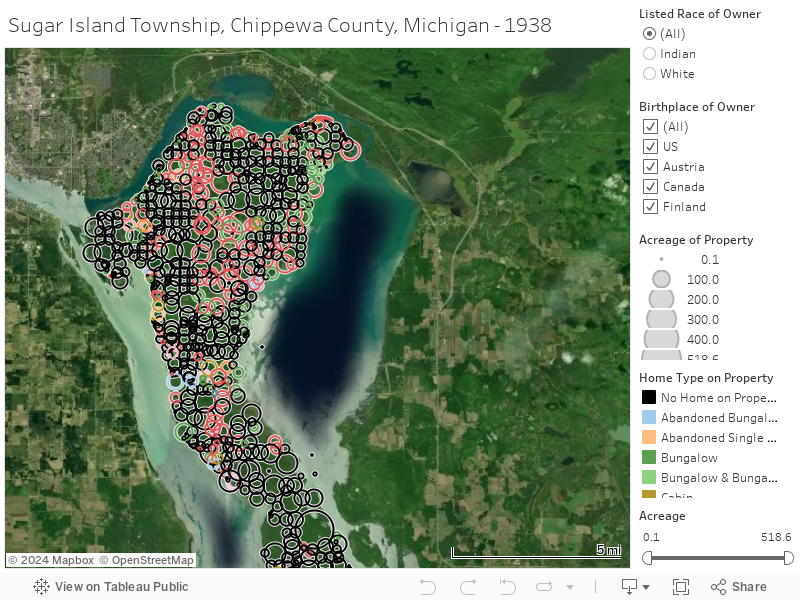
We are ready to publish our first visualization! This is a preliminary or “beta” version mapping Finnish property ownership on Sugar Island in 1938.
Most land records from the 19th and early 20th centuries are not particularly detailed. If the land is west of Ohio, it was surveyed in accordance with the Northwest Ordinance of 1787, divided into squares inside of squares inside of squares. Take a look out the window the next time you are flying over the American West and you will see these multi-colored squares, neatly apportioned by surveyors. On the records of these western plots, a description of its location gives you the township, section, quarter section (and half-quarter section and quarter-quarter section), an effective locator in a pre-GPS world, but there is not usually a description of what is on that plot – the buildings, the crops, or the background of its owner.
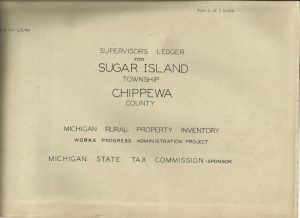
Fortunately, governments sometimes make an effort to collect more information about the land they govern. In the case of Sugar Island, Michigan, properties were given a detailed survey in 1938 as part of a state
Rural Property Inventory. During the Great Depression, the
Work Progress Administration (a massive New Deal federal program) in cooperation with the Michigan State Tax Commission conducted the project, employing two thousand surveyors, appraisers, and engineers. The Michigan State Tax Commission realized that they did not have much data on the rural property in the state, potentially leaving tax revenue unassessed. Officials thought they could collect the data they needed while providing work for some of the many unemployed Michiganders.
The project was massive, there were over 1200 townships to be surveyed (townships are 36 square miles or 23,040 acres), and it took several years (1935-1942) to complete. Surveyors noted the buildings on properties (giving details on their size in square feet, the year they were built, the type, the type of exterior and interior materials, their condition, even a drawing of the floor plan and more), what crops were being grown, what trees were growing and if they were being harvesting, what the land looked like (swamps, lakes, ridges, etc), and if the property had fences, silos, barns, access to roads and communication, or even a school district. There are 828 properties included in the inventory of the Sugar Island Township (in Chippewa County), which is the focus of our study. Each property is detailed on the front and back of an 8×10 inch sheet.

The
Michigan State Archives in Lansing holds the Rural Property Inventories of 58 Michigan counties, but some of those are incomplete and there are 25 counties that are unaccounted for. The Archives does not hold a copy of Chippewa County’s Sugar Island Township. Fortunately, the giant 1700-page, two-volume inventory was recently found by a Sugar Island Township official buried in storage along with other old township records. Those records, which still belong to the Sugar Island Township, were made available to the Sugar Island History Preservation Society, and are stored at the
Chippewa County Historical Society. They were graciously made available to the HUMANA Project.
All of information recorded by the Rural Property Inventory is useful for our project, especially the details about where individuals were living in 1938 and what they were doing on their land. With the inventory alone, however, it is impossible to visualize where the properties were in relation to one another. I used a spreadsheet and mapping software called
Tableau to make easy to see where the Sugar Islanders lived and how big their plots of land were, including the ability to filter certain information about each plot. Our map can show only the plots owned by Finnish-born residents, for instance, or which landowners were listed as Native American or white.
Land records and digital mapping can tell us a lot about human migration and about the social networks in a community. Patterns of settlement, community development, and land use become more apparent. The HUMANA Project is working to learn more about how Sugar Island properties evolved, to whom were they were bought and sold, how Finnish landownership increased, how Native American landownership declined, and how families, companies, and governments used their lands over time.
We hope you spend some time with our preliminary map below. Click on the different filters on the right to see if any patterns emerge! Let us know in the comments below.
Very interesting, highly detailed and very well done!
Thank you Sandee. We appreciate all comments and especially those coming from people Who actually know the place and the people 😀
Best wishes
Rani
Very interesting. The house of my grandparents, Esko/Hella Kaikkonen must have had additions added because it more than the 4 rooms suggested her. It had an upstairs with two full bedrooms. I know a bathroom was a new addition on the 1st floor sometime in the early 50s.