St1 Oy planned to build the world’s deepest geothermal power plant in Otaniemi, Espoo. Their goal was to produce 20–40 MW of thermal energy for district heating. To achieve this, the company drilled two of the world’s deepest wells, approximately 6 kilometers deep, between which they planned water circulation. To maintain the water reservoir needed for the water circulation and energy production, St1 conducted two hydraulic stimulations, where high-pressure (fresh) water was pumped kilometers deep with the aim of fracturing the rock mass surrounding the wells. This type of power plant is called an Enhanced Geothermal System (EGS). In Otaniemi’s case, two stimulations were carried out: a larger main stimulation lasting 49 days in June–July 2018 and a smaller 16-day counter-stimulation in May 2020. Both stimulations were carried out in several pumping phases, among other things, to manage the earthquake risk. In case you’re interested in practicalities of the measurement and the precise location of the power plant, the geometry of the seismic measuring network monitoring the 2018 stimulation was touched on by Amir Sadeghi-Bagherabadi’s earlier Seismoblog. The stimulations caused tens of thousands of induced earthquakes. The majority of these occurred during and immediately after the 2018 main stimulation. This was due to the fact that the main stimulation involved approximately six times the amount of pumped water compared to the counter-stimulation. Although the largest induced earthquakes were generally felt in the Helsinki metropolitan area and even made headlines in the media — even yours truly was invited to explain the phenomenon! — the vast majority of these events were very small; most had a magnitude roughly equivalent to the energy produced by a single scratched match. These small events correspond to a seismic magnitude of approximately -1.0 and below. For comparison, the largest event observed in Otaniemi had a magnitude of 1.8 (on Sunday, July 16, 2018, at 19:26 local time)— the 2.8-unit difference in magnitude corresponds to a whopping 16,000 times greater energy, due to the logarithmic nature of the magnitude scale! This puts the induced earthquakes into a perspective: It can be estimated that observable damage to buildings and infrastructure would only occur with earthquakes of magnitudes 3.5–4.0, which would be about 10,000 times larger than the events ever induced in Otaniemi.
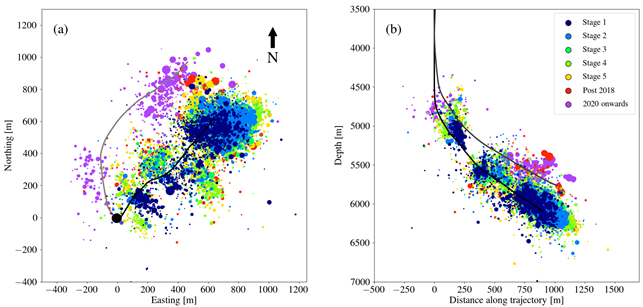
Figure 1. The location of earthquakes observed in Otaniemi relative to the boreholes: the black line represents 2018, gray 2020, and the black dot marks the planned power plant itself. The data consists of induced earthquakes detected by an algorithm based on cross-correlation (i.e., the similarity of events), which could be located with sufficient accuracy from the beginning of the stimulation until the end of 2022. The coloring is based on the timing of the earthquakes relative to the different pumping phases of the 2018 main stimulation, i.e., it essentially represents the time since the start of the main stimulation. Events following the start of the 2020 stimulation are shown in a different color. The size of the point represents the magnitude of the earthquake. The locations of the cases shown in the image are preliminary, so it should be considered indicative.
Anatomy of Earthquakes – What Does the Similarity of Earthquakes Mean?
The induced earthquakes observed in Otaniemi were roughly of two main types. The majority of the earthquakes were reverse faults (also known as thrust faults) where the blocks essentially collide with each other, but about one percent of the earthquakes were strike-slip faults where the blocks move laterally past each other. As an analogy, a reverse fault is like two people colliding face-first while walking, whereas a strike-slip fault is like two people walking in opposite directions whose hands bump into each other. The fault plane solutions of the Otaniemi earthquakes will be further detailed by doctoral researcher Annukka Rintamäki, who is conducting research on the topic, in a forthcoming Seismoblog! What is more important here is to note that the main types of earthquakes differ in the signals recorded at seismic stations. However, the events within these earthquake families were very similar to each other across different stations. The similarity of events is also influenced by their proximity to each other, as seen in the upper image where most of the cases occurred close to each other. Surprisingly, there is no significant time or magnitude dependency: if the same fault is activated from roughly the same place in the same direction, the seismic signals of the resulting earthquakes can be very similar even if several years and very different magnitudes separate the events! An illustrative example is shown in the lower image. The similarity of earthquakes — or signals in general — can be described by a normalized cross-correlation, which takes a value between -1.0 and 1.0 depending on how similar the cases are: a value of 0.0 corresponds to complete randomness, and a value of 1.0 indicates perfect similarity; a value of -1.0 means perfect opposition, as if the signals are mirror images of each other. Cross-correlation can also be used to find new cases. In this method, a known manually analyzed earthquake is taken, a template (model event) is created from the earthquake, and it is “run” over the continuous data recorded by the seismic stations. When the template correlates well enough with the continuous data across sufficiently many stations, a potential new earthquake is picked out, which can then be further analyzed and located using different methods. However, as there are differences even within earthquake families, for example due to the location of the events, and there is always background noise in field measurements — especially when conducted in an urban area!— so the approximately 10,000-event earthquake dataset shown in the upper image was collected by correlating the signal of several hundred templates over the continuous data. This is not computationally trivial given the scope of the station data: it would take several months to calculate the required cross-correlations and pick out cases on a relatively powerful desktop computer (as of 2024).
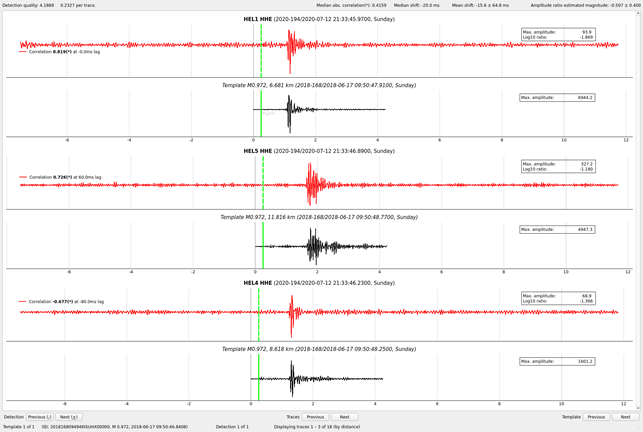
Figure 2. In this second image, a template event in black is shown along with an event it picked from the continuous data in red. The image is taken from software created for quick comparison of these cases. The template event with a magnitude of 1.0 occurred on June 17, 2018, but the event it found occurred over two years later on July 12, 2020! The software estimated the magnitude of the found event as -0.5, so the energy of the found event can be estimated as 190 times lower! The stations shown are Seurasaari (HEL1), Lintuvaara (HEL4), and Suvisaaristo (HEL5). The seismograms in the image show the east-west movement measured at the stations (channel identifier letter E). The correlation coefficients for each channel are also shown.