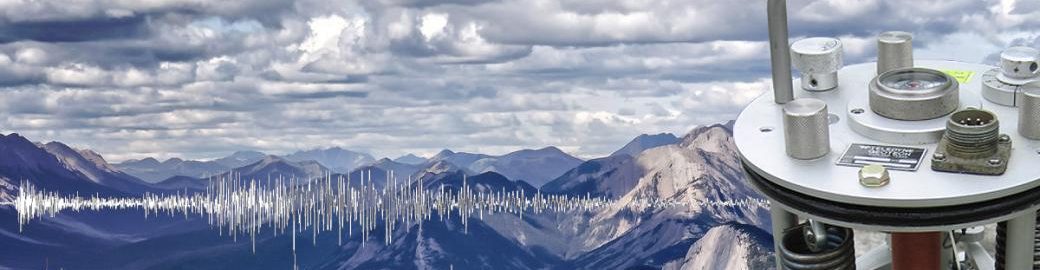
Finland’s first seismograph began operating in Helsinki at 6:50 a.m. on 3rd July 1924. The instrument had already been installed onto a concrete pillar fixed to the bedrock a while ago, but now the plotter pen finally began to shiver and plot back-and-forth arcs, signifying seismic waves passing Helsinki. They had been triggered by a magnitude 7.0 earthquake in China 5000 km away approximately ten minutes earlier. Thus, Finland joined the early instrumental era of seismology.
Registering earthquakes at long distances was demonstrated to be feasible in the late 1800s, and the global collection of earthquake recordings began shortly after. The seismograph stations established in various countries initially operated quite independently and sent their observations directly to international data centers. The time lag between recording and manual analysis of seismograms was so long that seismograph stations did not yet constitute real seismic networks. Seismic networks in the modern sense and standardized seismographs were created at the turn of the 1960s.
Mechanical seismographs were in use in the early instrumental era. They were unwieldy constructions the size of a cupboard with a frame, a heavy pendulum mass, and a complicated system of levers that enabled the detection, magnification, and recording of ground motion. Excessively violent ground motions could derail levers, but modest magnification left a large proportion of earthquakes undetected. An important part of recording was precise timing.
Finland’s seismograph was a three-component (a vertical and a north–south and an east–west horizontal component) Mainka named after its constructor Karl Mainka. The pendulum mass was 730 kg in the horizontal components and 300 kg in the vertical component. The amplitude magnification was 140, with a maximum of 250 at period 12 s (frequency 0.08 Hz), but a modest 70 in the vertical direction. Thus, the device was suited for detecting large-magnitude earthquakes.
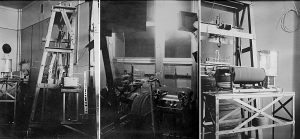
Mainka seismographs in the physics department building in Helsinki, possibly in the early 1950s. Photos: Helsinki University Museum Liekki
Seismographs were analog, and registrations happened on paper. Smoked paper was used in Helsinki at the beginning of recording. Each component produced a seismogram per day. Continuous recording thus produced almost 1,100 seismograms (size approximately 88 cm × 21 cm) per year, so storage space was quickly in demand.
Data exchange took place by mail. When investigating a given earthquake, a seismologist sent letters to the seismograph stations with registrations of the same event, asking them to kindly lend their original seismograms. The requested seismograms were located at the respective stations. If already moved to the storage room, someone went and lifted piles of seismograms until the correct ones were found. They were rolled into a neat package and mailed to the requesting seismologist.
In practice, seismogram analysis includes identifying various phases and picking phase arrival times. Every wiggle and turn of the seismogram has a reason. In analog times, using a loupe helped to figure out the overlapping recordings of two earthquakes arriving close together and the phases of a very long recording.
Seismograms include information about the source, path, and site of the recording station. The distance from the station to the earthquake focus is calculated from the time difference between P and S wave arrivals. They arrive close together from nearby regions, but with long distances the faster P waves grow a long lead to the S waves. A single station is not sufficient to determine the epicenter, though, because all points on the circle with a radius equal to the distance around the recording station are possible earthquake epicenters.
The seismic waves triggered by strong earthquakes propagate various paths across Earth’s interior from the focus to the recording station. The paths, or phases, are denoted by various combinations of letters. For example, phase PKIKP propagates the first part of its path as P from the earthquake focus downward to the Earth’s outer core, the second through the outer core (K), the third through the inner core (I), and the fourth and fifth parts back again through outer core to mantle or crust.
The observatory practice in the early instrumental era formed the basis for a global monitoring system of earthquakes and for the investigation of Earth’s deep interior. A geophysics study book published as late as 1897 included weak assumptions of gas, liquid, and solid layers within Earth. Seismologists combined the phase arrival times from all over the world into increasingly better travel-time tables. They provided the empirical travel times of various phases for various distances. They inverted the travel times and the differences between them in different parts of the world into the gross structure of the Earth’s interior. The thickness of the mantle was given as 2900 km already in 1912. In the next decade, it was proved that Earth’s core must be liquid. The solid inner core was discovered in 1936.
Finland’s three-component Mainka seismograph contributed to global seismology. It also provided learning opportunities to local physics students. The Mainka seismograph was in operation until the early 1960s, when the Helsinki seismograph station was closed, and new types of seismographs had already been installed at other localities. The Mainka seismograph was donated to the technical museum in Tampere, where it was destroyed in a fire in 1989.
Päivi Mäntyniemi, University Researcher