Air quality in Finland is among the best in the world. Nevertheless, in cold winter days even Finnish cities experience unhealthy pollution levels. Developed countries have been able to curb pollutants and improve air quality during the past decades but in many developing countries the trend is reverse. According to World Health Organization, 99 % of the world population live in areas where air pollution levels exceed WHO guidelines1. Air pollution is the biggest environmental health risk globally, causing almost 7 million premature deaths every year.
Air pollution can be classified by the type of particles, or by the environment where it is experienced. Ambient pollution refers to pollution outdoors, while household pollution is particles are caused by domestic activities such as cooking and heating. Estimated 2.4 billion people still prepare food with open fire or inefficient stoves fueled by kerosene, wood, animal dung, crop waste and coal2. Household pollution is a gendered issue affecting especially poor women and the effects of outdoor pollution don’t spread equally, either3. Energy Policy Institute at the University of Chicago estimated that lives of residents of New Delhi, India, are being shortened by up to 11.9 years compared to a situation where air pollution levels were within a healthy range. Still, wealthy residents have more means to avoid unhealthy outdoor air than poor rickshaw drivers or vegetable sellers. Pollution inequality exists also in rich countries. According to one study, poorest regions in Europe experience PM2.5 levels one third higher than the levels in richest regions. In the US, non-Hispanic white people are exposed to 7 % lower levels of PM2.5 than the average but cause 12 % more emissions than the average, because of higher consumption6.
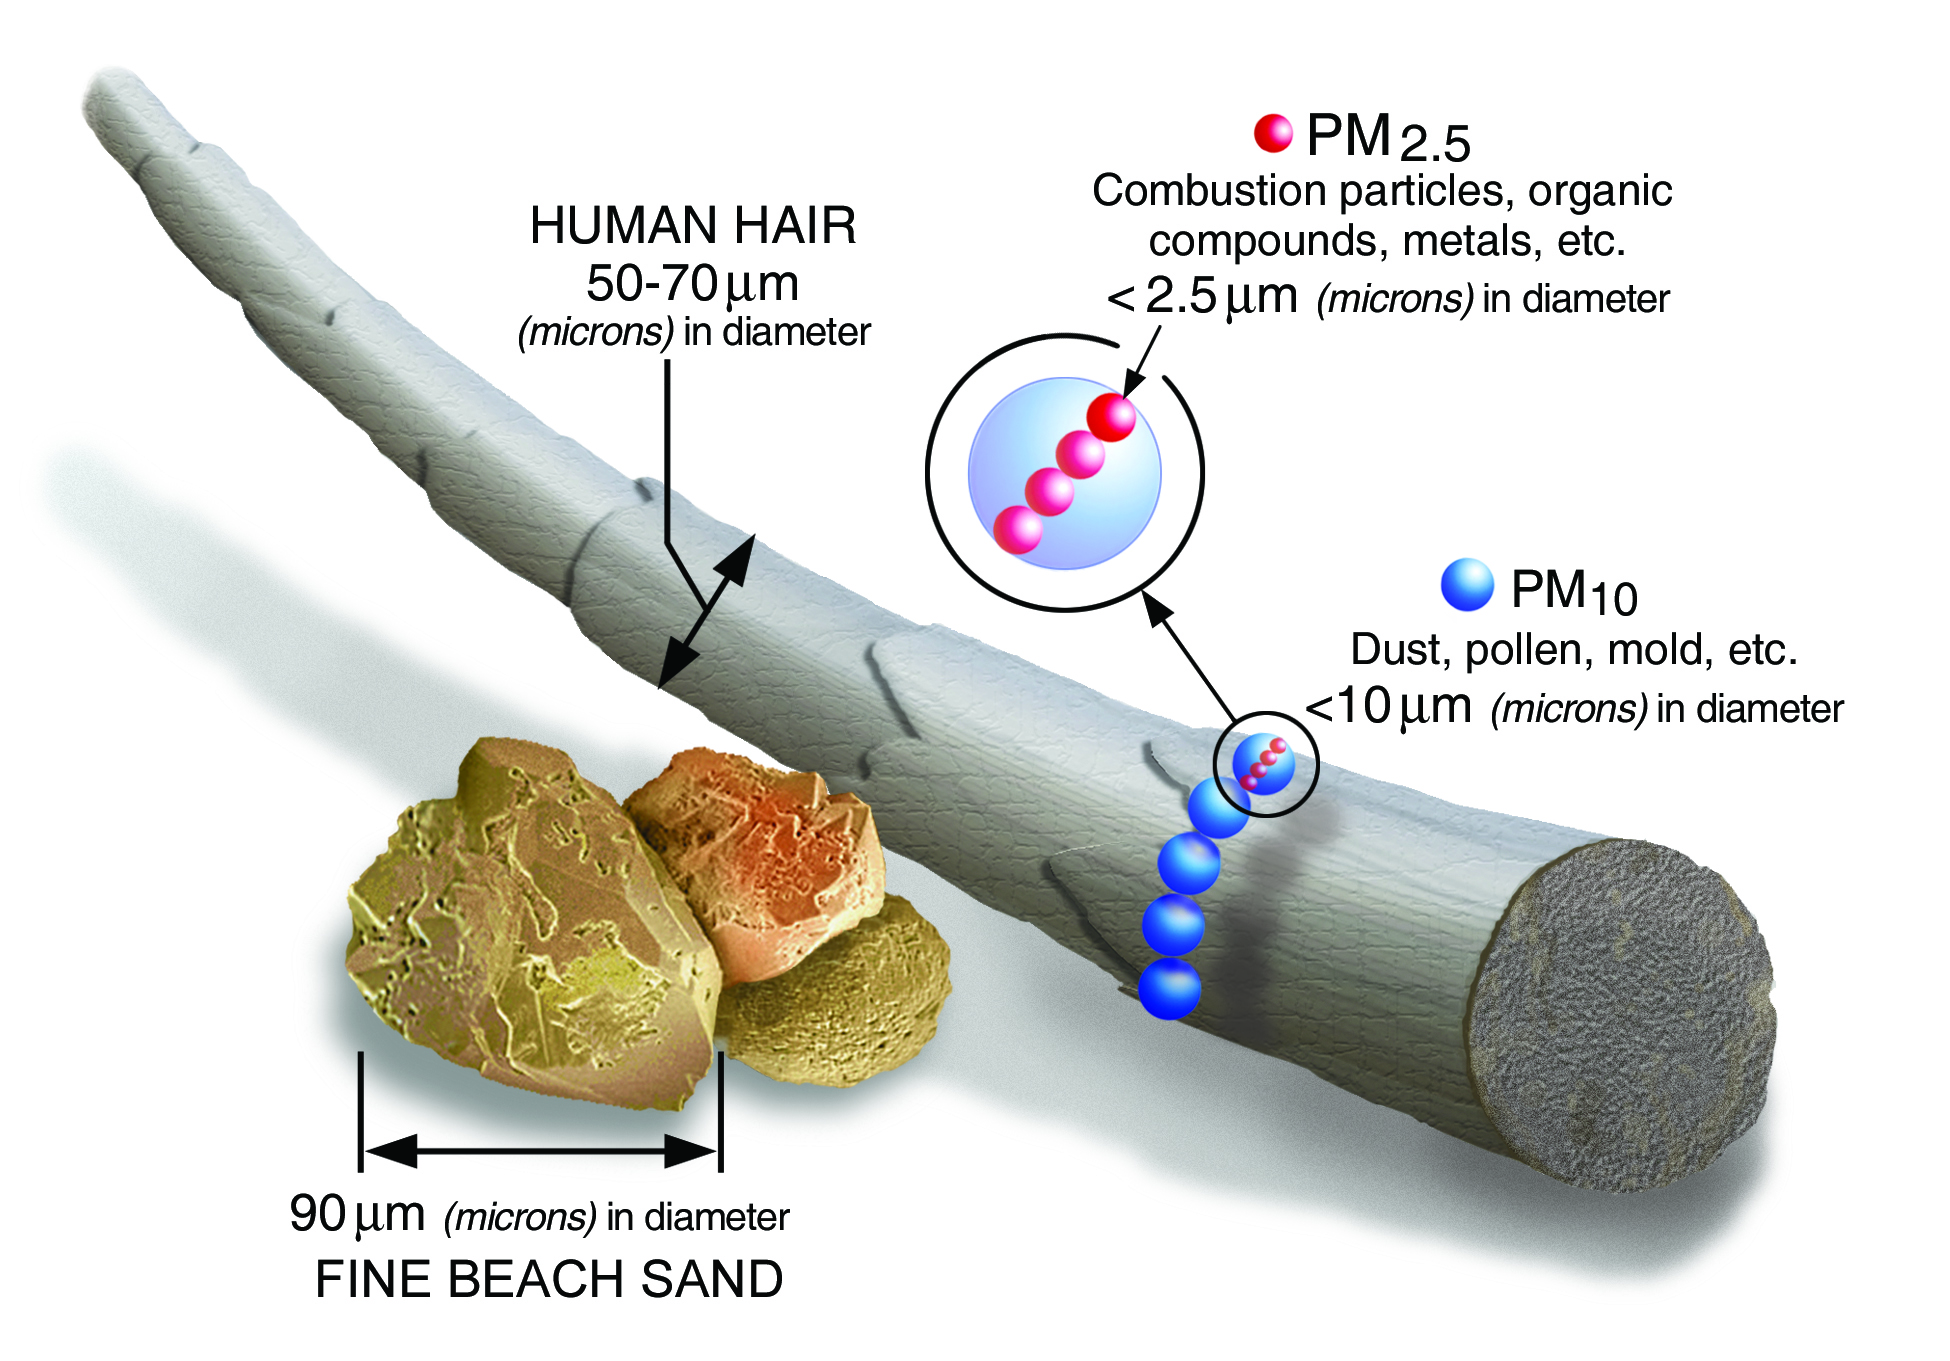
Air pollution is inhalable particles of sulphate, nitrates, ammonia, sodium chloride, black carbon, mineral dust or water. Its adverse effect on health is caused by the ability of fine particles to penetrate lungs and other organs. Coarse particles can irritate the eyes, nose and throat. Finer particles such as PM2.5 are a bigger risk since they can easily enter lungs and even bloodstream.
An air quality index is an indicator developed by government agencies to assess the healthiness of outdoor air. AQI takes into account several pollutants, such as carbon monoxide, nitrogen oxide, ozone, sulphur dioxide, lead, PM10 and PM2.5. However, it is difficult to obtain historical data of AQI levels globally, and the way to calculate the index can vary from country to country. In this blog post we analyze data on PM2.5 levels of which are monitored globally.
Concentration of pollutants is measured by cubic meters of air. This obviously means that densely populated areas have worse air quality than sparsely populated areas. The continuous growth of world population poses a challenge to pollution-reducing goals. Pollution levels of a country are also linked to the rate of growth of its Gross Domestic Product (GDP). If we plot the GDP and PM2.5 data from the last couple of decades we can see that many African countries are experiencing fast economic growth and rapidly rising levels of pollution. Meanwhile, in large Asian economies such as India and China, PM2.5 levels are high, but decreasing while their GDP is growing.
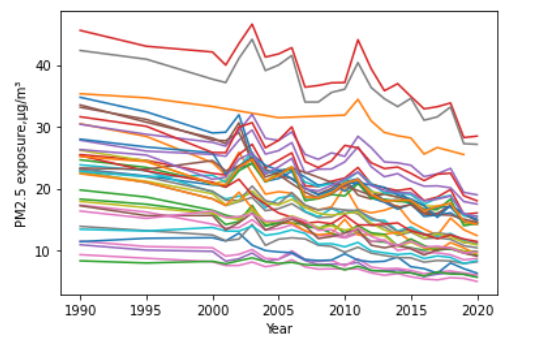
In most developed countries in Europe and Northern America changes are less drastic – GDP is rising slowly and pollution levels are stable or slightly decreasing. This connection between income per capita and environmental degradation is the basis of a hypothesis called Environmental Kuznets Curve (EKC).
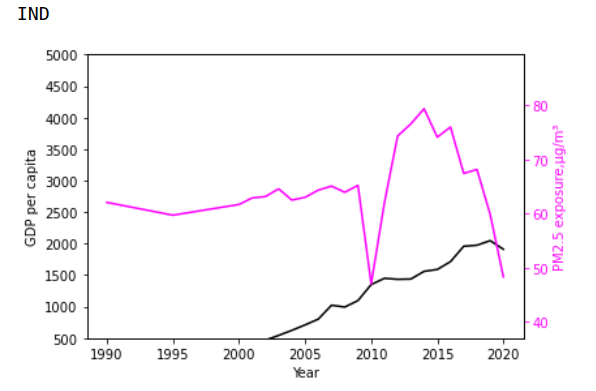
According to EKC, economic growth will be environmentally detrimental in its early stages. Consumption, construction, traffic and usage of fossil fuels increase but old technologies are still in use. At a later stage, when a country has reached a certain level of development, it starts to invest in cleaner technology and pay more attention to the harmful aspects of growing economic activity. The resulting curve of environmental degradation is roughly the shape of an inverted U. Most countries Europe and Northern America have have had decreasing pollution levels for several decades already. Periodic economic conditions, such as the 2007 – 2008 financial crisis and the boom that followed, cause changes (unrelated to EKC) in pollution levels which can be seen in the graphs below.
Can we predict future levels of pollution based on historical data? Machine learning applications based on Environmental Kuznets Curve include, for example, forecasting turning points of carbon emissions in Beijing4. The study observed that Beijing CO2 emissions reached a turning point in 2011 and started to fall. Unfortunately, the model predicts Beijing emissions will start to grow again in 2026. Another study, utilizing a neural network, found a relationship in the shape of EKC between GDP and per capita carbon dioxide emissions when using production-based emission data5. However, this correlation disappears for OECD countries when using consumption-based emissions data. It seems that OECD countries have been able to cut emissions by moving production plants elsewhere!
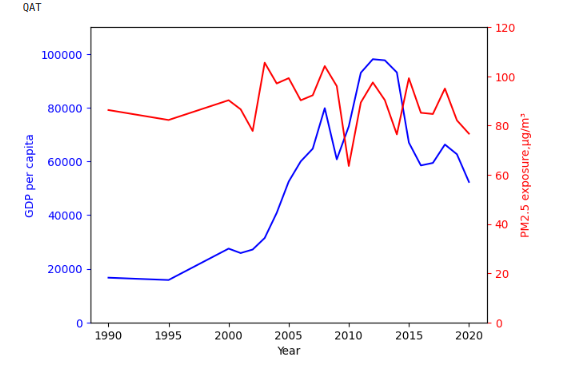
Moreover, not all wealthy countries experience decreasing pollution levels. Oil-producing countries around Persian Gulf have very high GDP combined with high exposure to particulate matter. Availability of fossil fuels, fast population growth, consumption habits and dry, hot climate contribute to this phenomenon.
We cannot expect pollution levels to automatically decrease along with technical advances and reduction of poverty. Climate change may worsen the problem as forest fires become more frequent. On the other hand, global reserves of fossil fuels are not not endless and alternative fuels will have to be introduced. Looking at pollution data makes you feel that clean air already is a commodity more valuable to any country than oil ever was.
References
- World Health Organization. Ambient (outdoor) air pollution. 19 December 2022. who.org
- World Health Organization. Household air pollution. 28 November 2022. who.org
- Thiagarajan,K. Why clean air is a luxury that many can’t afford. 18 October 2023. bbc.com
- Yao T, Wang Y, Li X, Lian X, Li J. Forecasting Turning Points of Carbon Emissions in Beijing Based on Interpretable Machine Learning. Atmosphere. 2023; 14(8):1288. DOI
- Bennedsen, M., Hillebrand, E., & Jensen, S. (2023). A neural network approach to the environmental Kuznets curve. Energy Economics, 126, 106985–. DOI
- Tessum, C. W., Apte, J. S., Goodkind, A. L., Muller, N. Z., Mullins, K. A., Paolella, D. A., Polasky, S., Springer, N. P., Thakrar, S. K., Marshall, J. D., & Hill, J. D. (2019). Inequity in consumption of goods and services adds to racial–ethnic disparities in air pollution exposure. Proceedings of the National Academy of Sciences – PNAS, 116(13), 6001–6006. DOI
Datasets
- GDP per capita (current US $). Compiled of data from World Bank, International Monetary Fund, national statistical agencies and central banks. Kaggle
- Organisation for Economic Co-operation and Development: Exposure to PM2.5 in countries and regions. stats.oecd.org
- ourworldindata.org: Outdoor Air Pollution. 2022. Kaggle
Credits
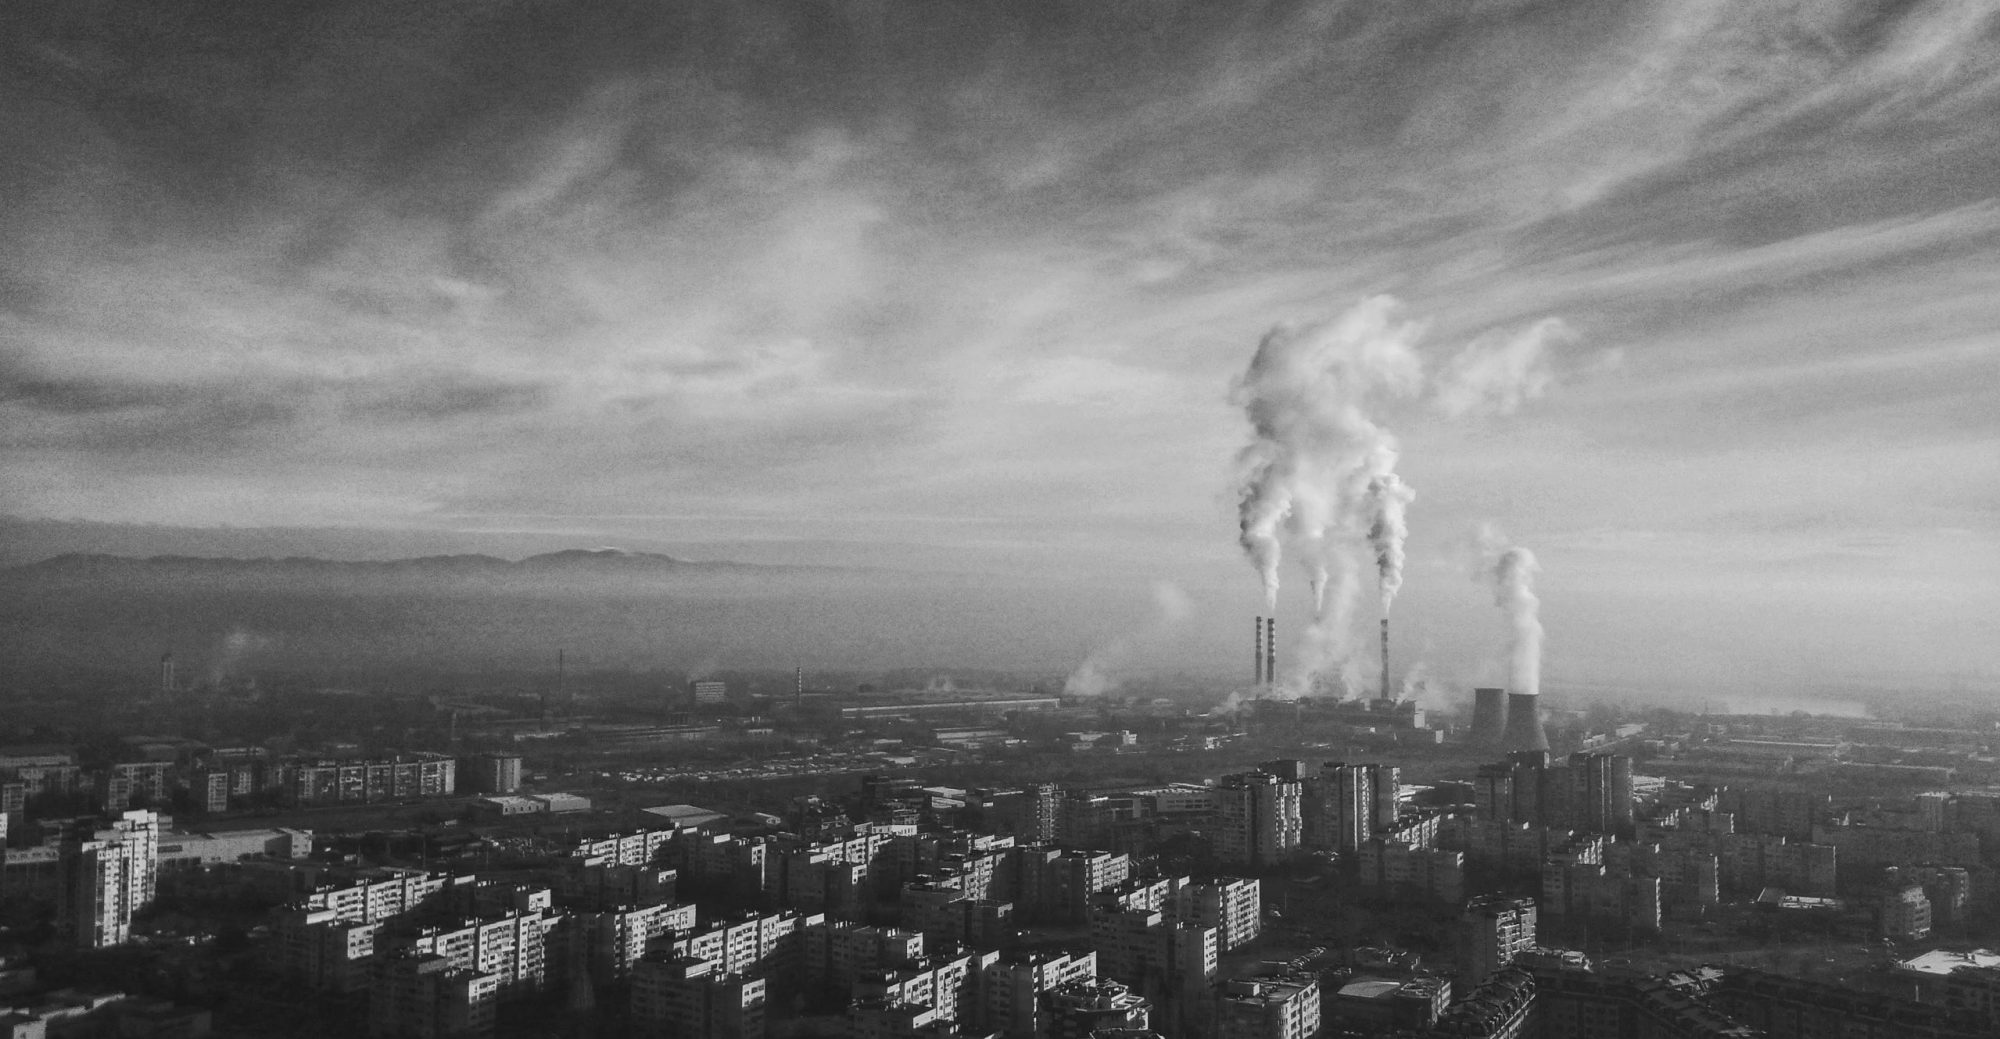
- Header photo: Yaroslav Boshnakov/Unsplash. Sofia, Bulgaria
- Particulate matter photo: United States Environmental Protection Agency.