16TH AUGUST, 2018.
Today we were introduced to the group assignment. The goal here is to study different development pathways of different countries, where the class is split into three groups and each group gets three random countries to make a presentation and written report about. At least 6 different development indicators are needed, such as human development index, CO2 emissions, food security, etc. We are to find out what has been emphasized in development and what the trade-offs are, what groups of people
have been affected in which ways, how the landscape of each country has changed over the years and we are to speculate what kind of future the countries are moving towards and make at least six recommendations for how to make things better. One reference point for this that was recommended to us by our course coordinator is Progressia, a website that presents a fictional country that resembles a landlocked African country.
We then had a small Q&A with Markku Kanninen about things people still were wondering about the course and the field trip. Markku then held his presentation about forest transition and also talked about acid rain and airborne pollutants in Finland and Russia. We talked about what the different definitions for “deforestation” and “forest loss” and in what countries deforestation occur. Very scary to think we lose the area of a soccer field of forest every 3 seconds! I thought it was very interesting to compare the drivers for deforestation in different countries, such as the main driver in Africa being
wood for fuel rather than logging and how the pressure to have certified products has forced farmers in Brazil to stop deforestation.
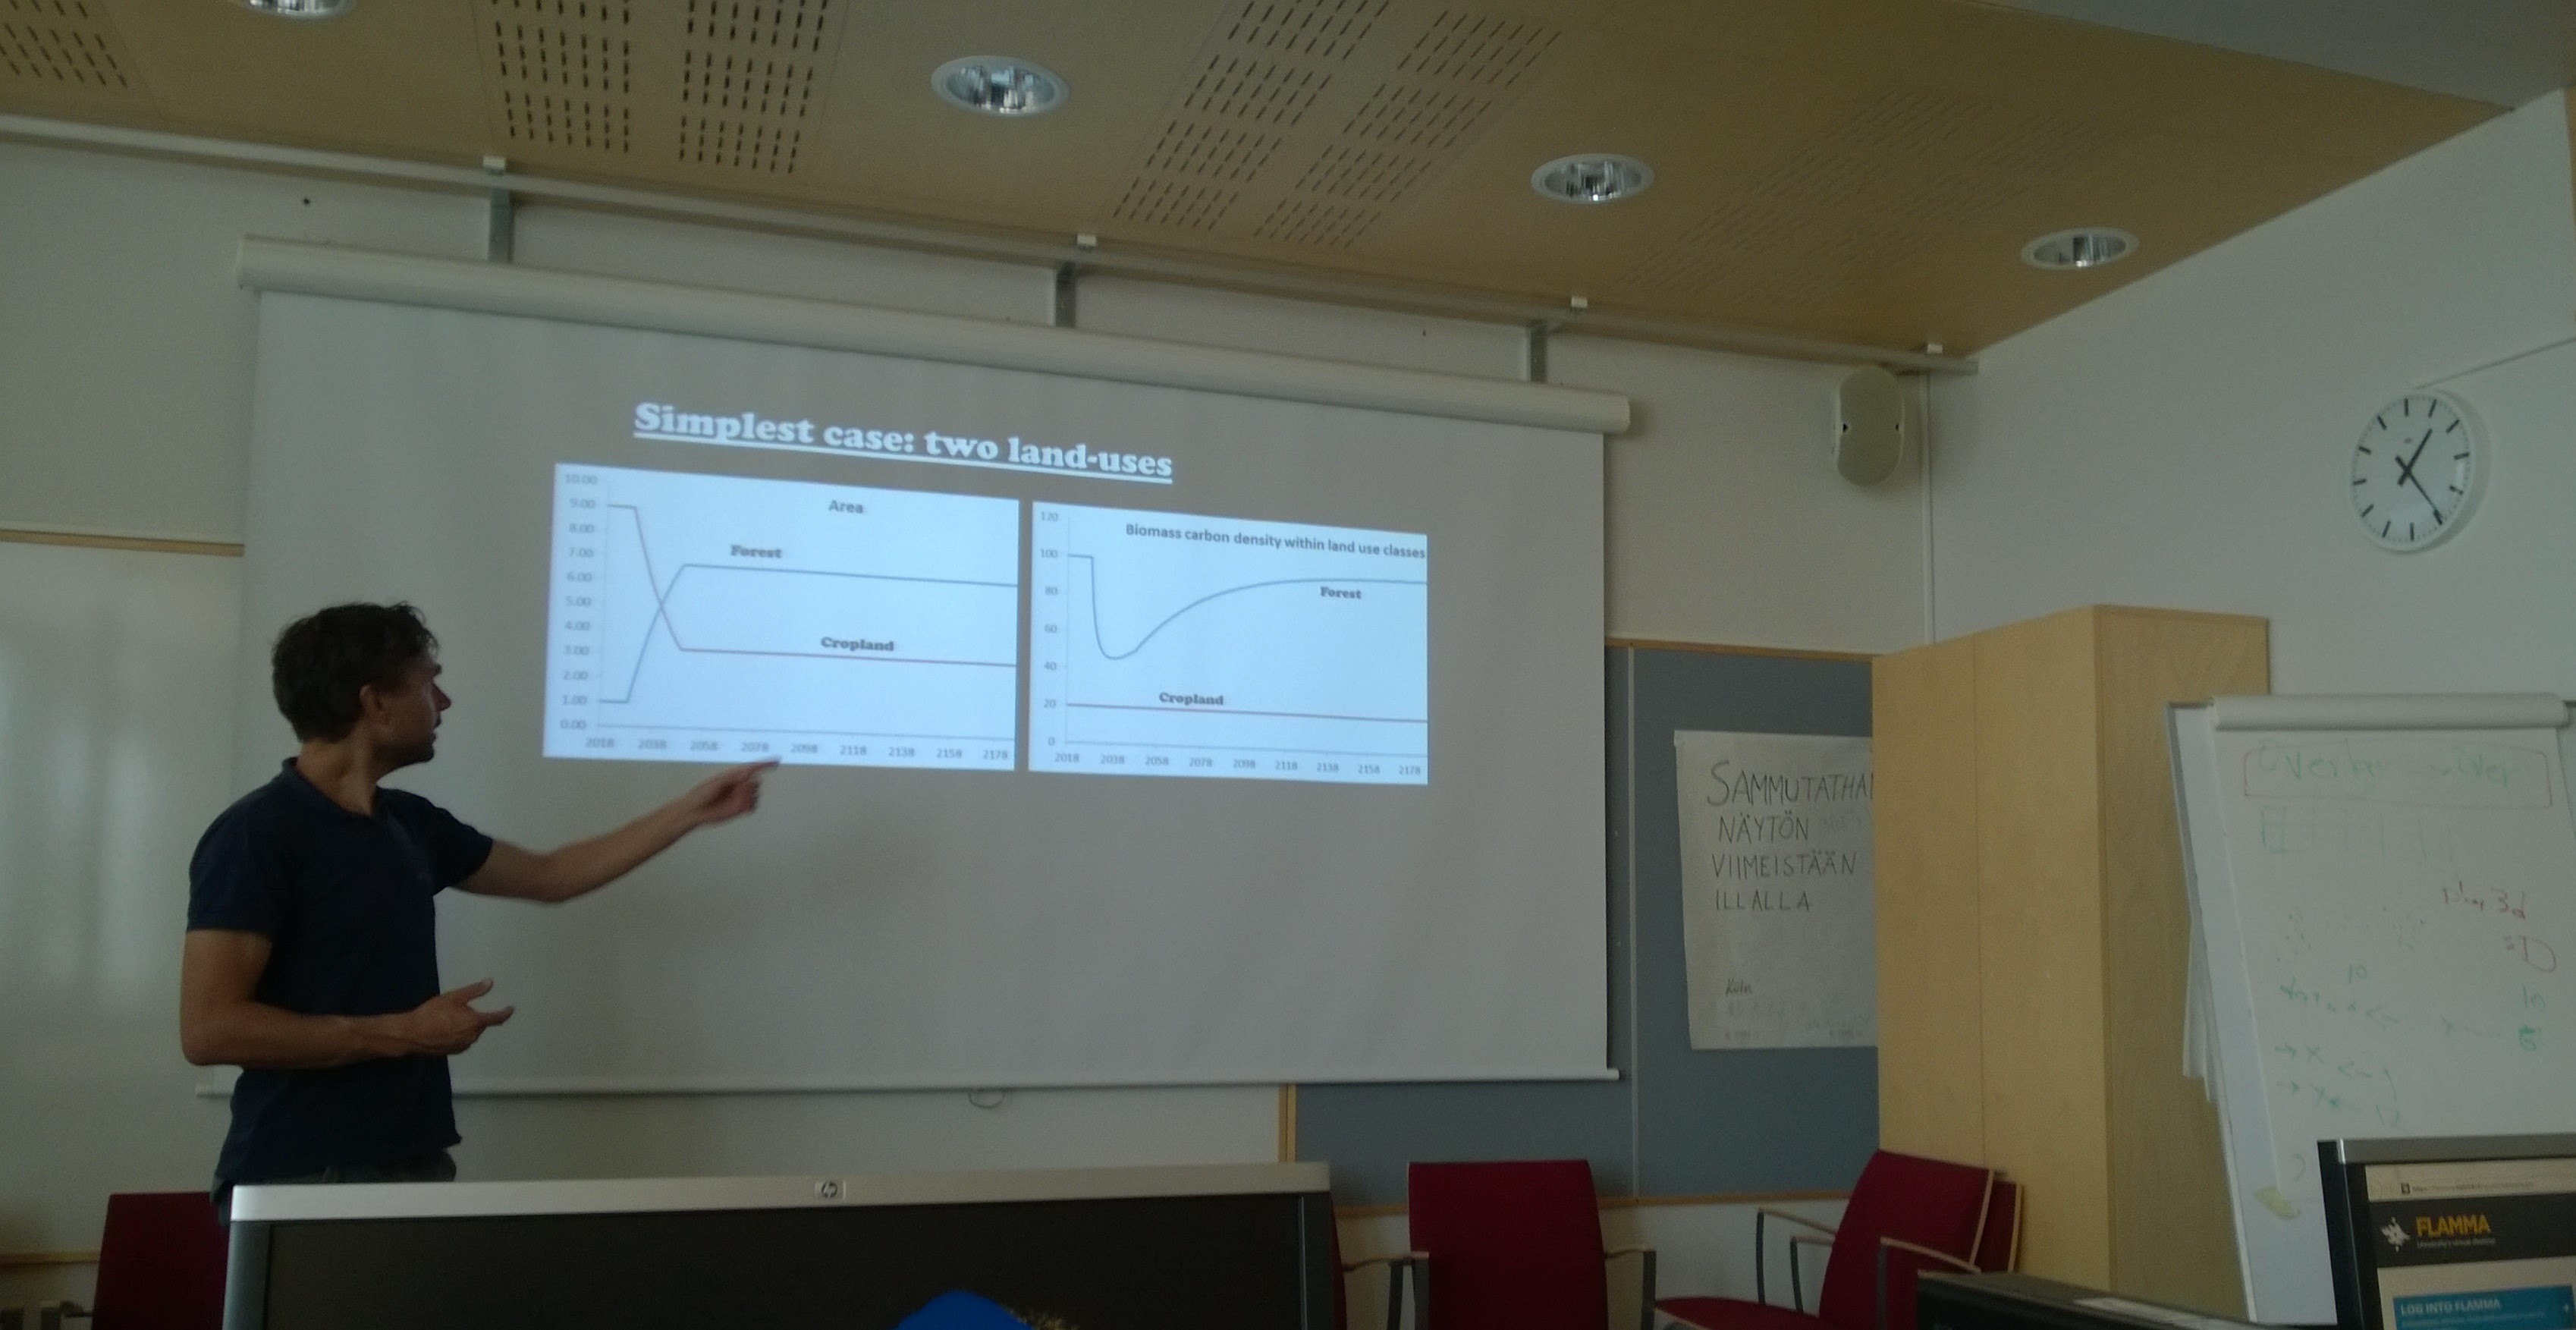
Next was a short presentation by Markku Larjavaara on climate change, forests and carbon. This presentation was supposed to give us some basic information about carbon fluxes and pools, terms and definitions so that we are prepared to use CarboSCEN more effectively. This is a computer program developed by VITRI and CIFOR that can calculate carbon in biomass over time and compare different
land-use classes. After lunch we had a workshop where we learned how to use the program. The program is simple but can be a bit tricky to learn at first. The program lets you put in your own data about biomass and soil carbon density and transition speed in different land-use classes and then run a simulation for how the carbon density ratios will change over long periods of time. We were asked to make our own fictional scenarios in the program and present them to the class afterwards. Most people
had a scenario where land-use of forests decreased for the next two or three decades as a result of deforestation and was then later restored. As a vegetarian I created my dream scenario where people started eating less meat and pasture lands and their carbon were slowly being converted into forests.
– Klaus Blomster