An article in Nature Tools on the “rise of R”

It is nice that R is so popular nowadays. I have been using it since 1999 or so, when Jaakko Heinonen introduced me to it, and been convinced since 2002 when I started teaching it to undergrads, that once one grasps the logic behind it, it is not difficult to use. At that time, I even developed a couple of simple packages for use in my courses. More recently, in the last three years I have been doing a lot of programming in R, as I am developing a suite of packages, while earlier I had been mostly writing simple scripts for analysing data.

R is as a programming language quite unusual and takes some time to learn to squeeze all the possibilities out of it, both in terms of performance and programming paradigms, but I have grown to like it a lot.

A very simple and a bit superficial note on R was published a couple of weeks ago in Nature. The citations record used, surely underestimates the use of R, especially early on, as it was frequent to not cite R as a publication, and least to have the “R project” as the ‘author’ but instead to mention it as a “product” in materials and methods, or to cite the paper “Ihaka R, Gentleman R. 1996. R: a language for data analysis and graphics. Journal of Computational and Graphical Statistics 5: 299–314.” In those times, even some editors refused to accept R itself as an entry in the list of references, something that did happen to me when I submitted a manuscript. The first article I published which cites R, or rather the 1996 paper on R, is from 2001, so although the first references to the “R project” may be from 2003 as mentioned in the Nature article, citations to books and articles describing R and R packages, appeared in the literature already in the late 1990’s.

http://www.nature.com/news/programming-tools-adventures-with-r-1.16609


“Flow”, success and hapiness

Yesterday after our Biophilosophy Society session, I had an interesting chat with Matan about whether switching research subjects is good or bad.

Today, just by chance I ended watching this video from 2008. I think it nicely answers what we discussed. NOW WATCH THE VIDEO… (19 minutes long, but really worth your time)

Only after watching the video, you will understand what follows:

If you you feel that the field your are working on, does not provide enough of a challenge to get you into ‘flow’ at least now and then, then you have two options: find new challenges that you find exciting within your current discipline, or shift your interests to another discipline. Which of these routes you take, is quite irrelevant as long as you can reuse enough of your current skills in the new subject to be within your safe zone of comfort. Reusing the skills does not require the skills to be used in the same way as in the previous discipline, just that you find a way of making use of your skills even if by analogy when analysing a new problem.

I am currently participating in the “Leadership training” organized by the university, and in one recent meetings of my research group when discussing how to better work as a group, I emphasized that for every member of the group their work should be fun. This idea is formalized, and backed with data in the talk in the video I embedded above. So, if you skipped it, scroll up the page and watch it!


Lovelacen kreivitär kirjoitti tietokoneohjelman, ja häntä opasti Mary Somerville (Hessari 7.11.2014)

Today there was an interesting article in Helsingin Sannomat.

http://www.hs.fi/ulkomaat/a1415168967244

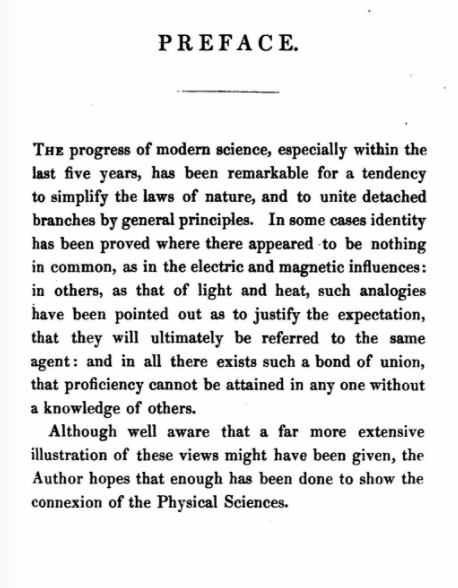
The book by Mary Somerville, that is mentioned in the article is in the public domain and available, as many other old and interesting books, through the Internet Archive.

https://archive.org/details/onconnexionphys00somegoog

I was particularly impressed by the preface written in the 1830’s:

In one of the comments in HS a reader writes that programming is boring… I disagree, just coding may be boring, but designing software and algorithms is anything but boring!

Another reader correctly says that Ada is not a super-computer language. In a way it was meant to be when it was designed, but in the sense of being a tool for creating reliable and bug-free software. However, as some other languages designed by a committee it ended being too complex and inconsistent, and because of this, difficult to use as a general purpose language.

However good data looks at first sight, check it!

Introduction

I will tell today two true stories, one old and one very recent. The point that I want to make today is that one should never blindly trust the results of measurements. This applies in general, but both examples I will present have to do with measurements made with instruments, more specifically with measuring UV-B radiation in experiments using lamps.

A case from nearly 20 years ago

Researcher A received a new very good spectroradiometer from the manufacturer and used it to set the UVB output from the lamps.

Researcher B had access to an old spectroradiometer that could measure only a part of the UVB spectrum. He knew this, and measured the part of the spectrum that was possible to measure, and extrapolated the missing part from published data. He also searched the literature and compared his estimates to how the same lamps had been used earlier.

Researcher A was unlucky enough that because of a mistake at the factory, the calibration of the new instrument was wrong by about a factor of 10. She did not notice until after the experiment was well under way, but before publication. The harm was that the results were less relevant than what had been the aim, but no erroneous information was published.

Researcher B was able able to properly measure the UVB irradiance after the experiment was well under way, and he found that the treatment was within a small margin of what he had aimed.

A case I discovered just a few days ago

A recently published paper concluded that they had obtained evidence that a low and ecologically relevant dose of UVB on a single day was able to elicit a large response in the plants. From the description of the lamps used, the distance to the plants and the time that the lamps were kept switched on is easy to estimate that in fact they had applied a dose that was at least 15 or 20 times what they had measured and reported in the paper. Coupled to a low level of visible light this explains why they observed a large response from the plants! Neither the authors, reviewers, nor the editor had noticed the error! [added on 8 October] I read a few other papers on similar subjects from the same research group and the same problem seems to also affect them. I will try to find out the origin of the discrepancy, and report here what I discover.

[added on 26 October]
I have contacted three of the authors. They have confirmed the problem. Cause seems to have been that the researchers did not notice that the calibration they used had been expressed in unusual units by the manufacturer. The authors are concerned and are checking how large the error was, but first comparative measurements suggest that the reported values were underestimated by a factor of at least 20 times.

About this case, I do not yet know the whole story, but evidently it yielded a much worse result: The publication of several articles with wrong data and wrong conclusions.

Take home message

Whenever and whatever you measure, or when you use or assess non-validated data from any source, unless you know very well from experience what to expect, check the literature for ballpark numbers. In either case, if your data differ significantly from expectations try to find an explanation for the difference before you accept the data as good. You will either find an error or discover something new.