Written by: Tommi Inkinen, Inka Kaakinen, Heli Ponto
Over 60 000 enterprises and 420 000 employees are situated in the Helsinki metropolitan area (HMA) that is the most important business region in the country. We have identified the most important knowledge intensive clusters (25 in total) in the HMA. These clusters are functional innovative environments. Our results show the importance of the traffic lanes and accessibility in business cluster locations. The Helsinki city center is the biggest knowledge intensive cluster in Finland.
The spatial cross tabulation of employment rate and relational employee rate in knowledge intensive business (figure 1) show the “hottest” knowledge intensive hot spots in in the HMA. These include Ruoholahti, Keilaniemi, Otaniemi, Pitäjänmäki and the zone connecting Kalasatama and Pasila (cf. figure 2).
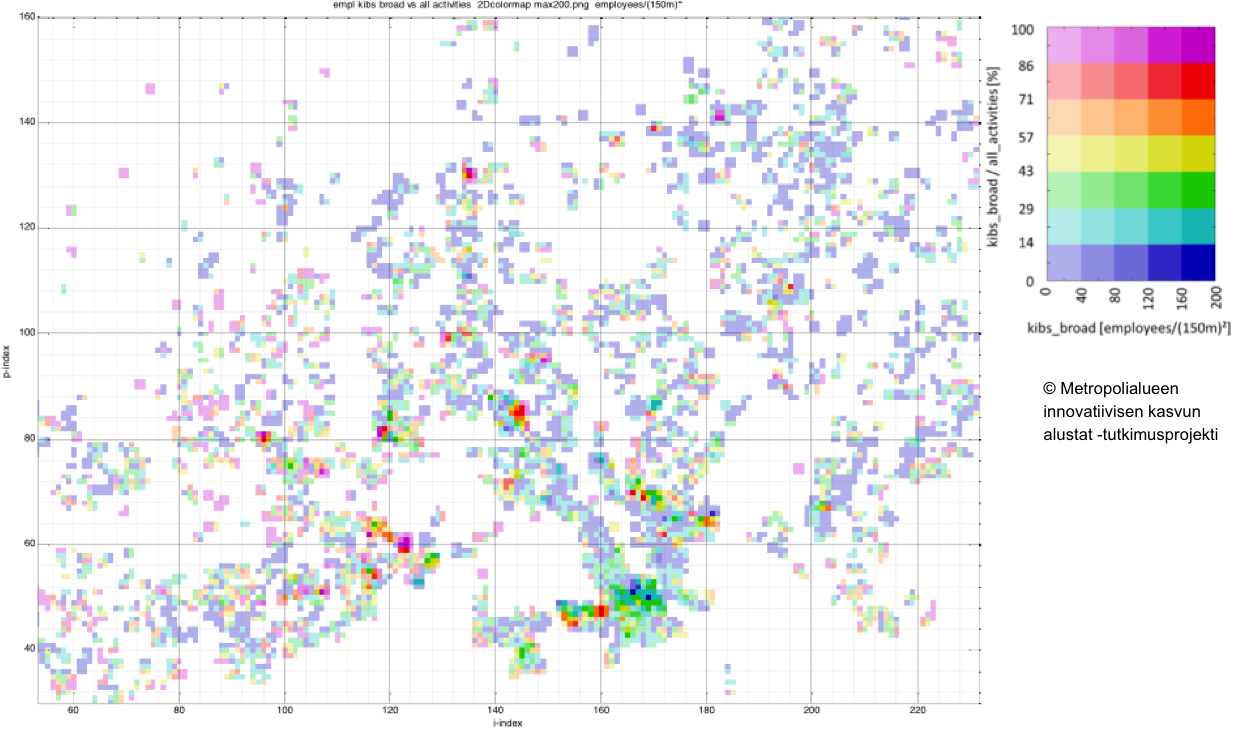
Figure 1. The spatial cross tabulation of employment rate and relational employee rate in knowledge intensive business.
Figures 2 and 3 show the turnover approximation and absolute employment number according of (the three differentiated categories) standard industrial classification (SIC). This enables the comparison of the 25 clusters according their knowledge intensive profile. The figure 2 shows the importance of the Helsinki city center in absolute employment in knowledge intensive business. In addition, the figure shows the different profiles of the different clusters.
The comparison between the three differentiated categories show that KIBS3 (including financing, administration and supporting services) is the most significant in employer. Also KIBS1 (including knowledge and communications, publishing, telecommunications, programming, consulting and information services) is an important employer. KIBS2 (including research and development and private training) is the smallest employer.
Figure 3 shows the relationship between turnover per employee and the advancing years of an enterprise. The figure suggests that 5 – 10 years old enterprises are the most effective in terms of a turnover.
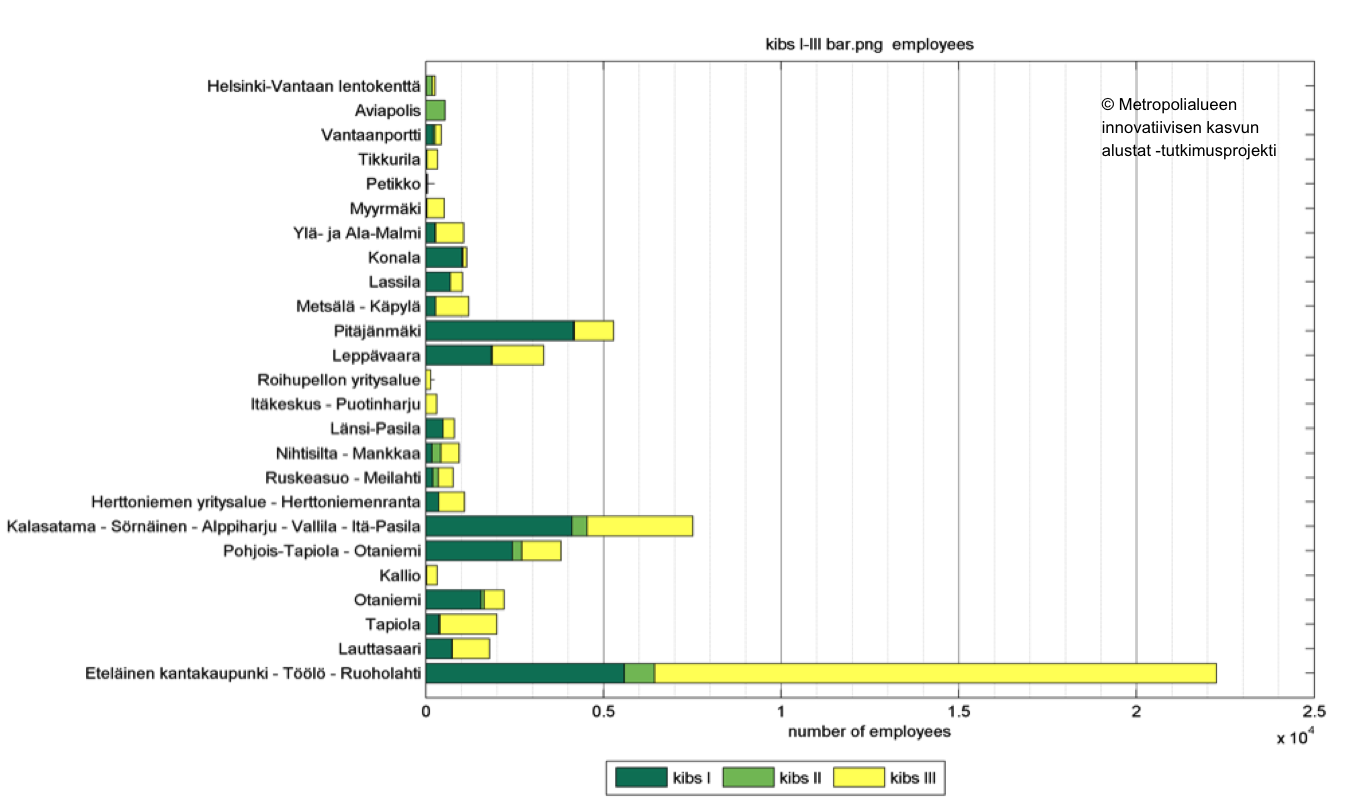
Figure 2. The turnover approximation and absolute employment number in the clusters.

Figure 3. Turnover per employee and the advancing years of an enterprise in the clusters.