
I have published through CRAN a suite of R packages for calculation and plotting tasks commonly needed in photobiology. Additional information and on-line documentation are available at The R for Photobiology Website.
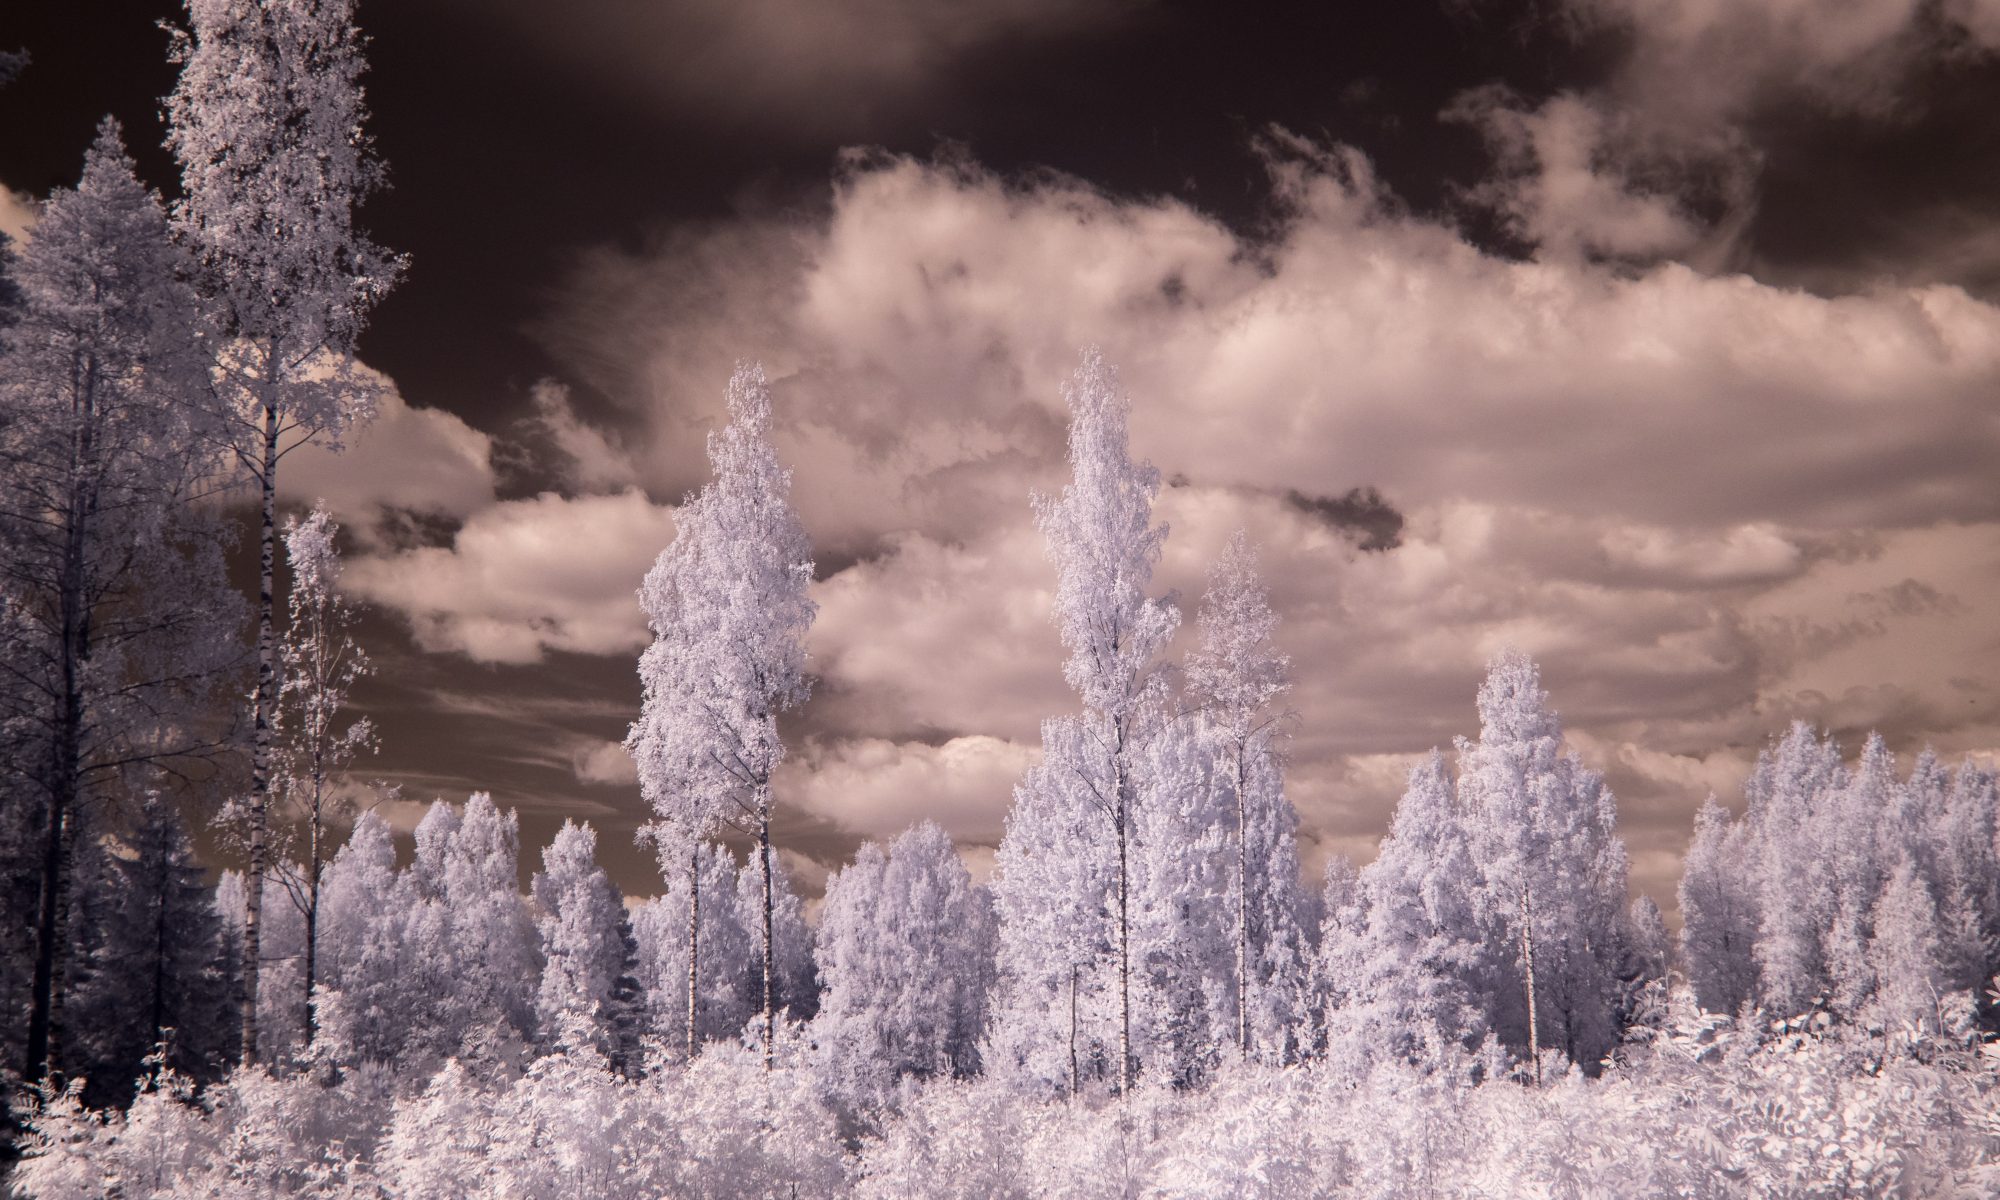
This is open source, free to use and modify software that aims to make it easier for all photobiologists to do calculations correctly and play with example data. In addition, the example data facilitates the production of original illustrations for use in teaching and text books.
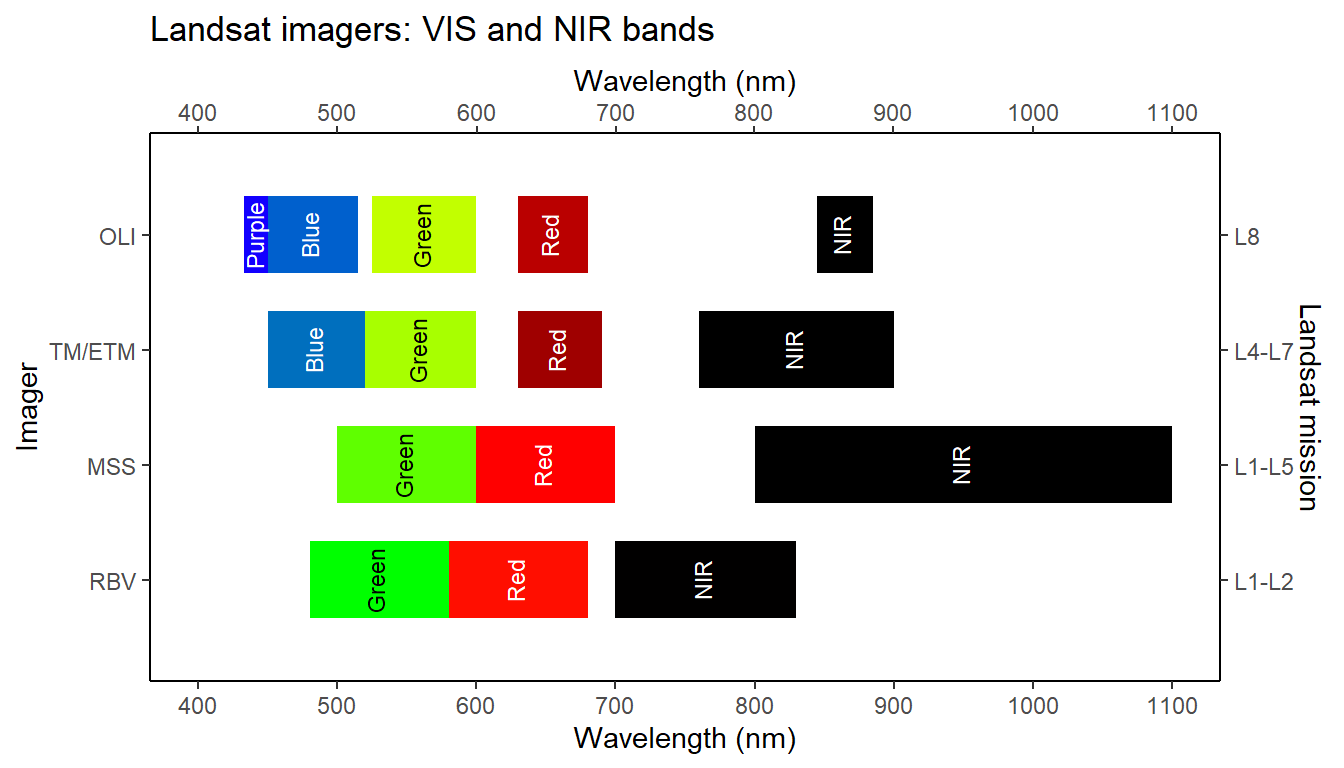
The suite consists of package ‘photobiology’ where core classes, methods and functions are defined. A second package called ‘ggspectra’ implements methods for plotting spectra using either autoplot() methods or the grammar of graphics with statistics, geometries and scales extending R package ‘ggplot2’. A third package ‘photobiologyInOut’ implements functions to automatically read and decode spectral data from spectrometers of several brands, output from radiation transfer models, some on-line repositories of spectral data and conversion methods between the classes defined in package ‘photobiology’ and those defined in packages ‘pavo’, ‘colorSpec’ and ‘hyperSpec’ . Package ‘photobiologyWavebands’ defines ranges of wavelengths according to different standard (ISO, CIE) and non-standard definitions (such as those used in photobiology and in LANDSAT imagers) and weighting functions (CIE erythemal, etc.) used to compute biologically effective exposures and irradiances. Package ‘photobiologyPlants’ contains functions and data related to plants and the sensory pigments (or plant photoreceptors), mass pigments and whole-leaf optical properties. In addition, action spectra for photosynthesis are included. The remaining packages contain only data and their documentation. Spectral data for optical properties of filters, plastics glasses, and other materials and emission spectra from various types of lamps and LEDs, and spectra for sunlight and shadelight are included.
I have done almost all the programming while Titta Kotilainen, Matt Robson and several postdoctoral researchers and PhD students have tested the packages and given many ideas for improvements and new capabilities.
The packages have been described in two publications Aphalo (2015, 2016) and used in several scientific publications.
Examples
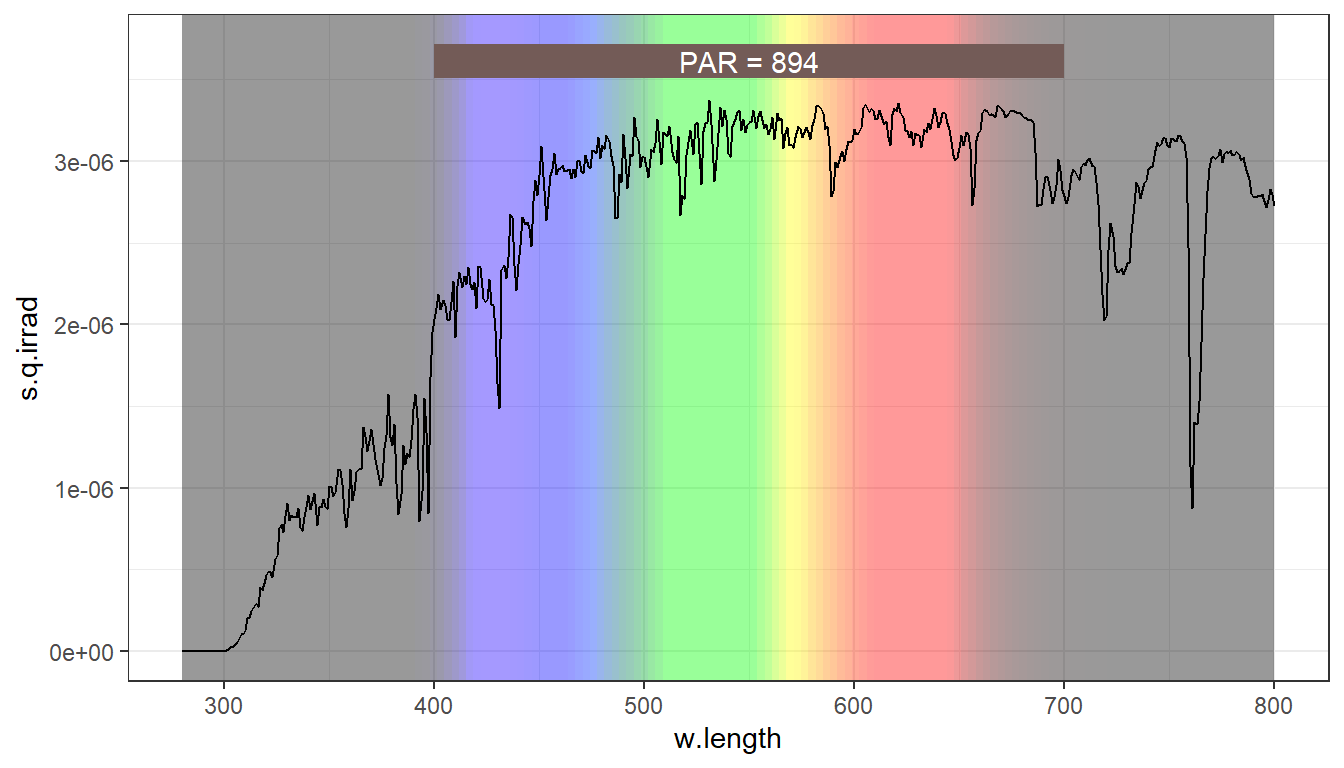
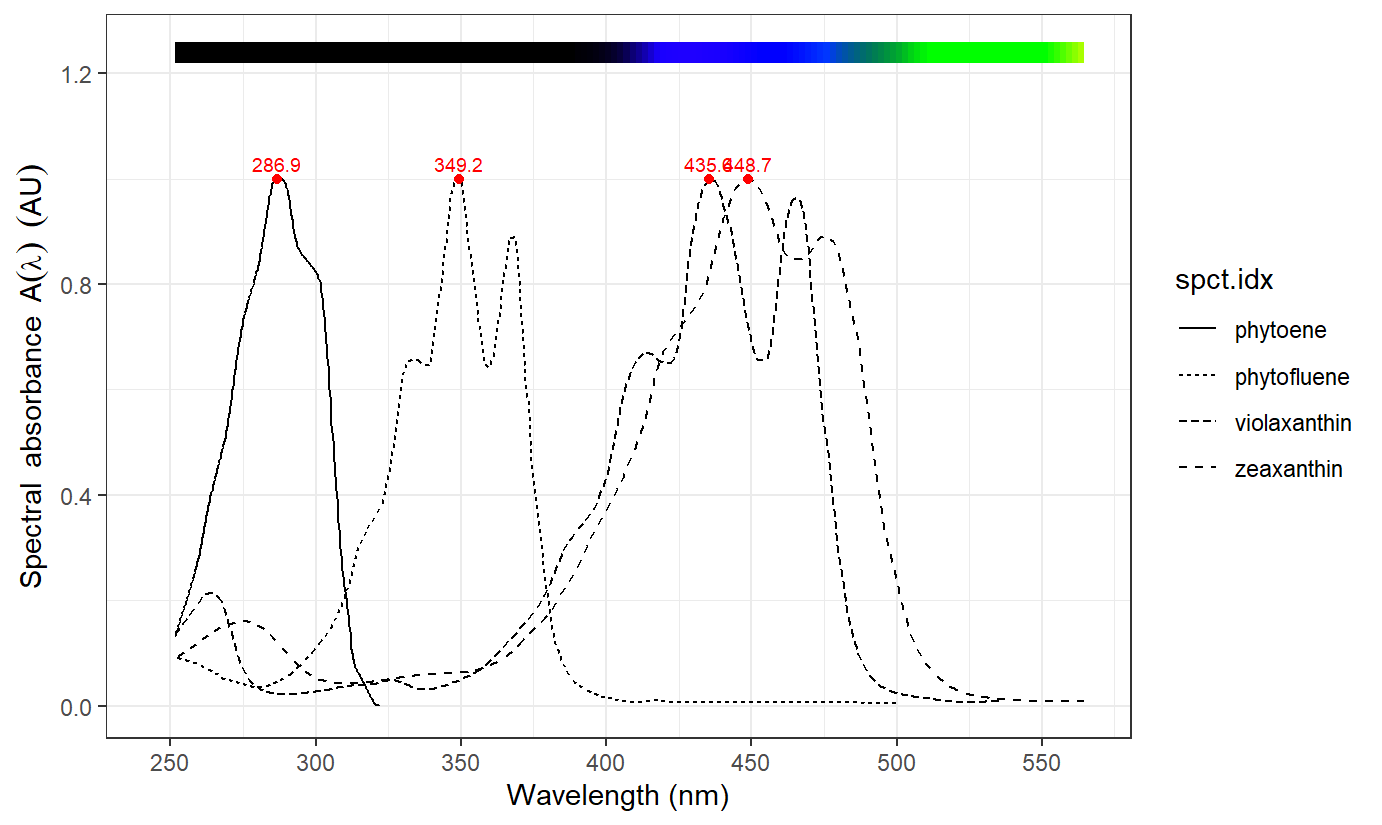
The figures below were produced using functions and data included in the packages in the suite.

Absorption spectra for some plant pigments
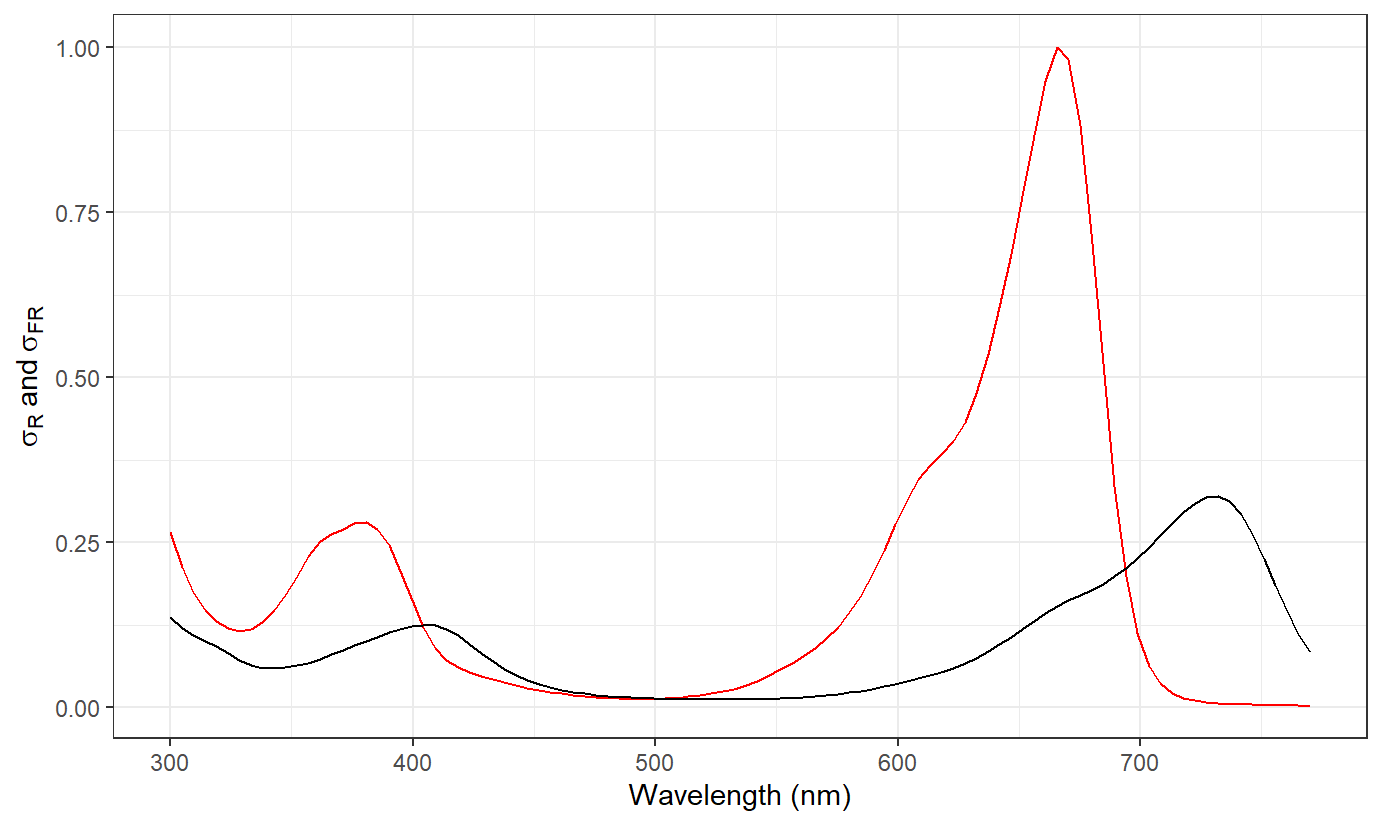
Absorption spectra for phytochrome
Action spectra of photosynthesis
