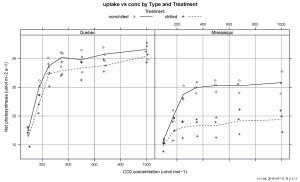
I just installed this program, and did a test run. Looks great for beta software. Replaces the whole R GUI. I am especially interested in Sweave support that is rather flaky in Tinn-R or requires a lot of setting changes in WinEdt. I will write again after some more testing. It is available for download at http://rstudio.org/ where there is also some documentation.
More R stuff
Some weeks ago I wrote a post about ggplot2, an R package for plotting. I have been playing with it for some time, and it tends to be much simpler to use than lattice, which we have been using lately. However, it tends to lack a bit of flexibility, as it is less mature than lattice. So, for relatively simple figures I would use ggplot2, but for more complex ones, I think that right now lattice offers more flexibility, at the cost of more complex commands. There is also the package latticeExtra that adds even more flexibility to lattice.
Today I came across the package latticist which adds a GUI for plotting with lattice. One creates the plot interactively using menus and the system displays the plot and the R code used to create it. It has different GUIs based on different code libraries. The one based on the playwith package seems to be the nicest one. The latticist web page gives more information and some screenshots. The person behind this package is Felix Andrews. Installation is a bit complicated as the GTK+ library needs to be installed. Under Windows this happens more or less automatically (one has just to agree to it being installed) but may need administrative rights (I am not sure about this, I did install from an account with administrative rights under Windows 7). I think the effort to get it installed if worthwhile.

A blog about R
This one in Finnish: http://www.r-ohjelmointi.org/ Full of very interesting stuff on R. Recommended.
Some new R stuff
Because I have some plans for an R course in Moodle, and also because I need to do some plots, I looked around in the web to see if there was something new. I found quite a lot, at least new to me. One is the package ggplot2 that may be easier to use than lattice and produces graphs with a different look.
The author is Had Wickman.
An example:
# load package
library(ggplot2)
# generate some artificial data
x=1:100
y2=x^2/100+rnorm(100)*5
# create a plot
qplot(x,y2,geom=c("smooth","point"))

Here are some links:
ggplot2 the home page for the package with links to videos, slides, etc. The package itself is in CRAN.
The author‘s PhD thesis
Some slides.
He has also written a book on ggplot2.
He has written other interesting packages but I’ll write about them later.
Mixed effects models and extensions in ecology with R
I recently bought this book (a Christmas self-present), by Zuur et al., 2009, and am starting to go through it. If anyone is interested it is available in my office, to augment SenPEP’s already impressive R bibliography!
There is an associated website:
Mixed effects models and extensions in ecology with R
Rob Hyndman’s research tips
Rob Hyndman’s blog has lots of interesting material aimed at graduate students in statistics, also very useful for us, plant ecologists.
http://robjhyndman.com/researchtips/
From reading Rob’s blog came the idea to start this blog for our own group.
