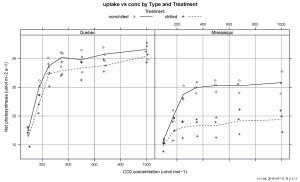
Some weeks ago I wrote a post about ggplot2, an R package for plotting. I have been playing with it for some time, and it tends to be much simpler to use than lattice, which we have been using lately. However, it tends to lack a bit of flexibility, as it is less mature than lattice. So, for relatively simple figures I would use ggplot2, but for more complex ones, I think that right now lattice offers more flexibility, at the cost of more complex commands. There is also the package latticeExtra that adds even more flexibility to lattice.
Today I came across the package latticist which adds a GUI for plotting with lattice. One creates the plot interactively using menus and the system displays the plot and the R code used to create it. It has different GUIs based on different code libraries. The one based on the playwith package seems to be the nicest one. The latticist web page gives more information and some screenshots. The person behind this package is Felix Andrews. Installation is a bit complicated as the GTK+ library needs to be installed. Under Windows this happens more or less automatically (one has just to agree to it being installed) but may need administrative rights (I am not sure about this, I did install from an account with administrative rights under Windows 7). I think the effort to get it installed if worthwhile.


