What is happening to arctic lakes and why should we care?

by Mingzhen Zhang

Arctic temperatures are warming more than twice as fast as the global average [1, 2], causing permafrost thaw, loss of ice and snow cover on land and over the sea. Moreover, feedbacks from these changes aggravate global warming; the phenomenon is termed Arctic amplification. These changes attract increasing public attention, which is centered at the shrinking ice-cover over the ocean, the melting ice sheets and glaciers and thawing permafrost. Increasing research interest, however, is devoted to studying arctic lakes, which make up 25% of the world’s laketotal and cover up to 50% of the Arctic terrestrial landscape [3, 4]. For the public, the nature and importance of arctic lakes has remained vague. In this post I will try to elucidate some facts based on my own experiences.

Arctic lakes make up 25% of the world’s lakes and cover up to 50% of the arctic terrestrial landscape

  1. The uniqueness of arctic lakes

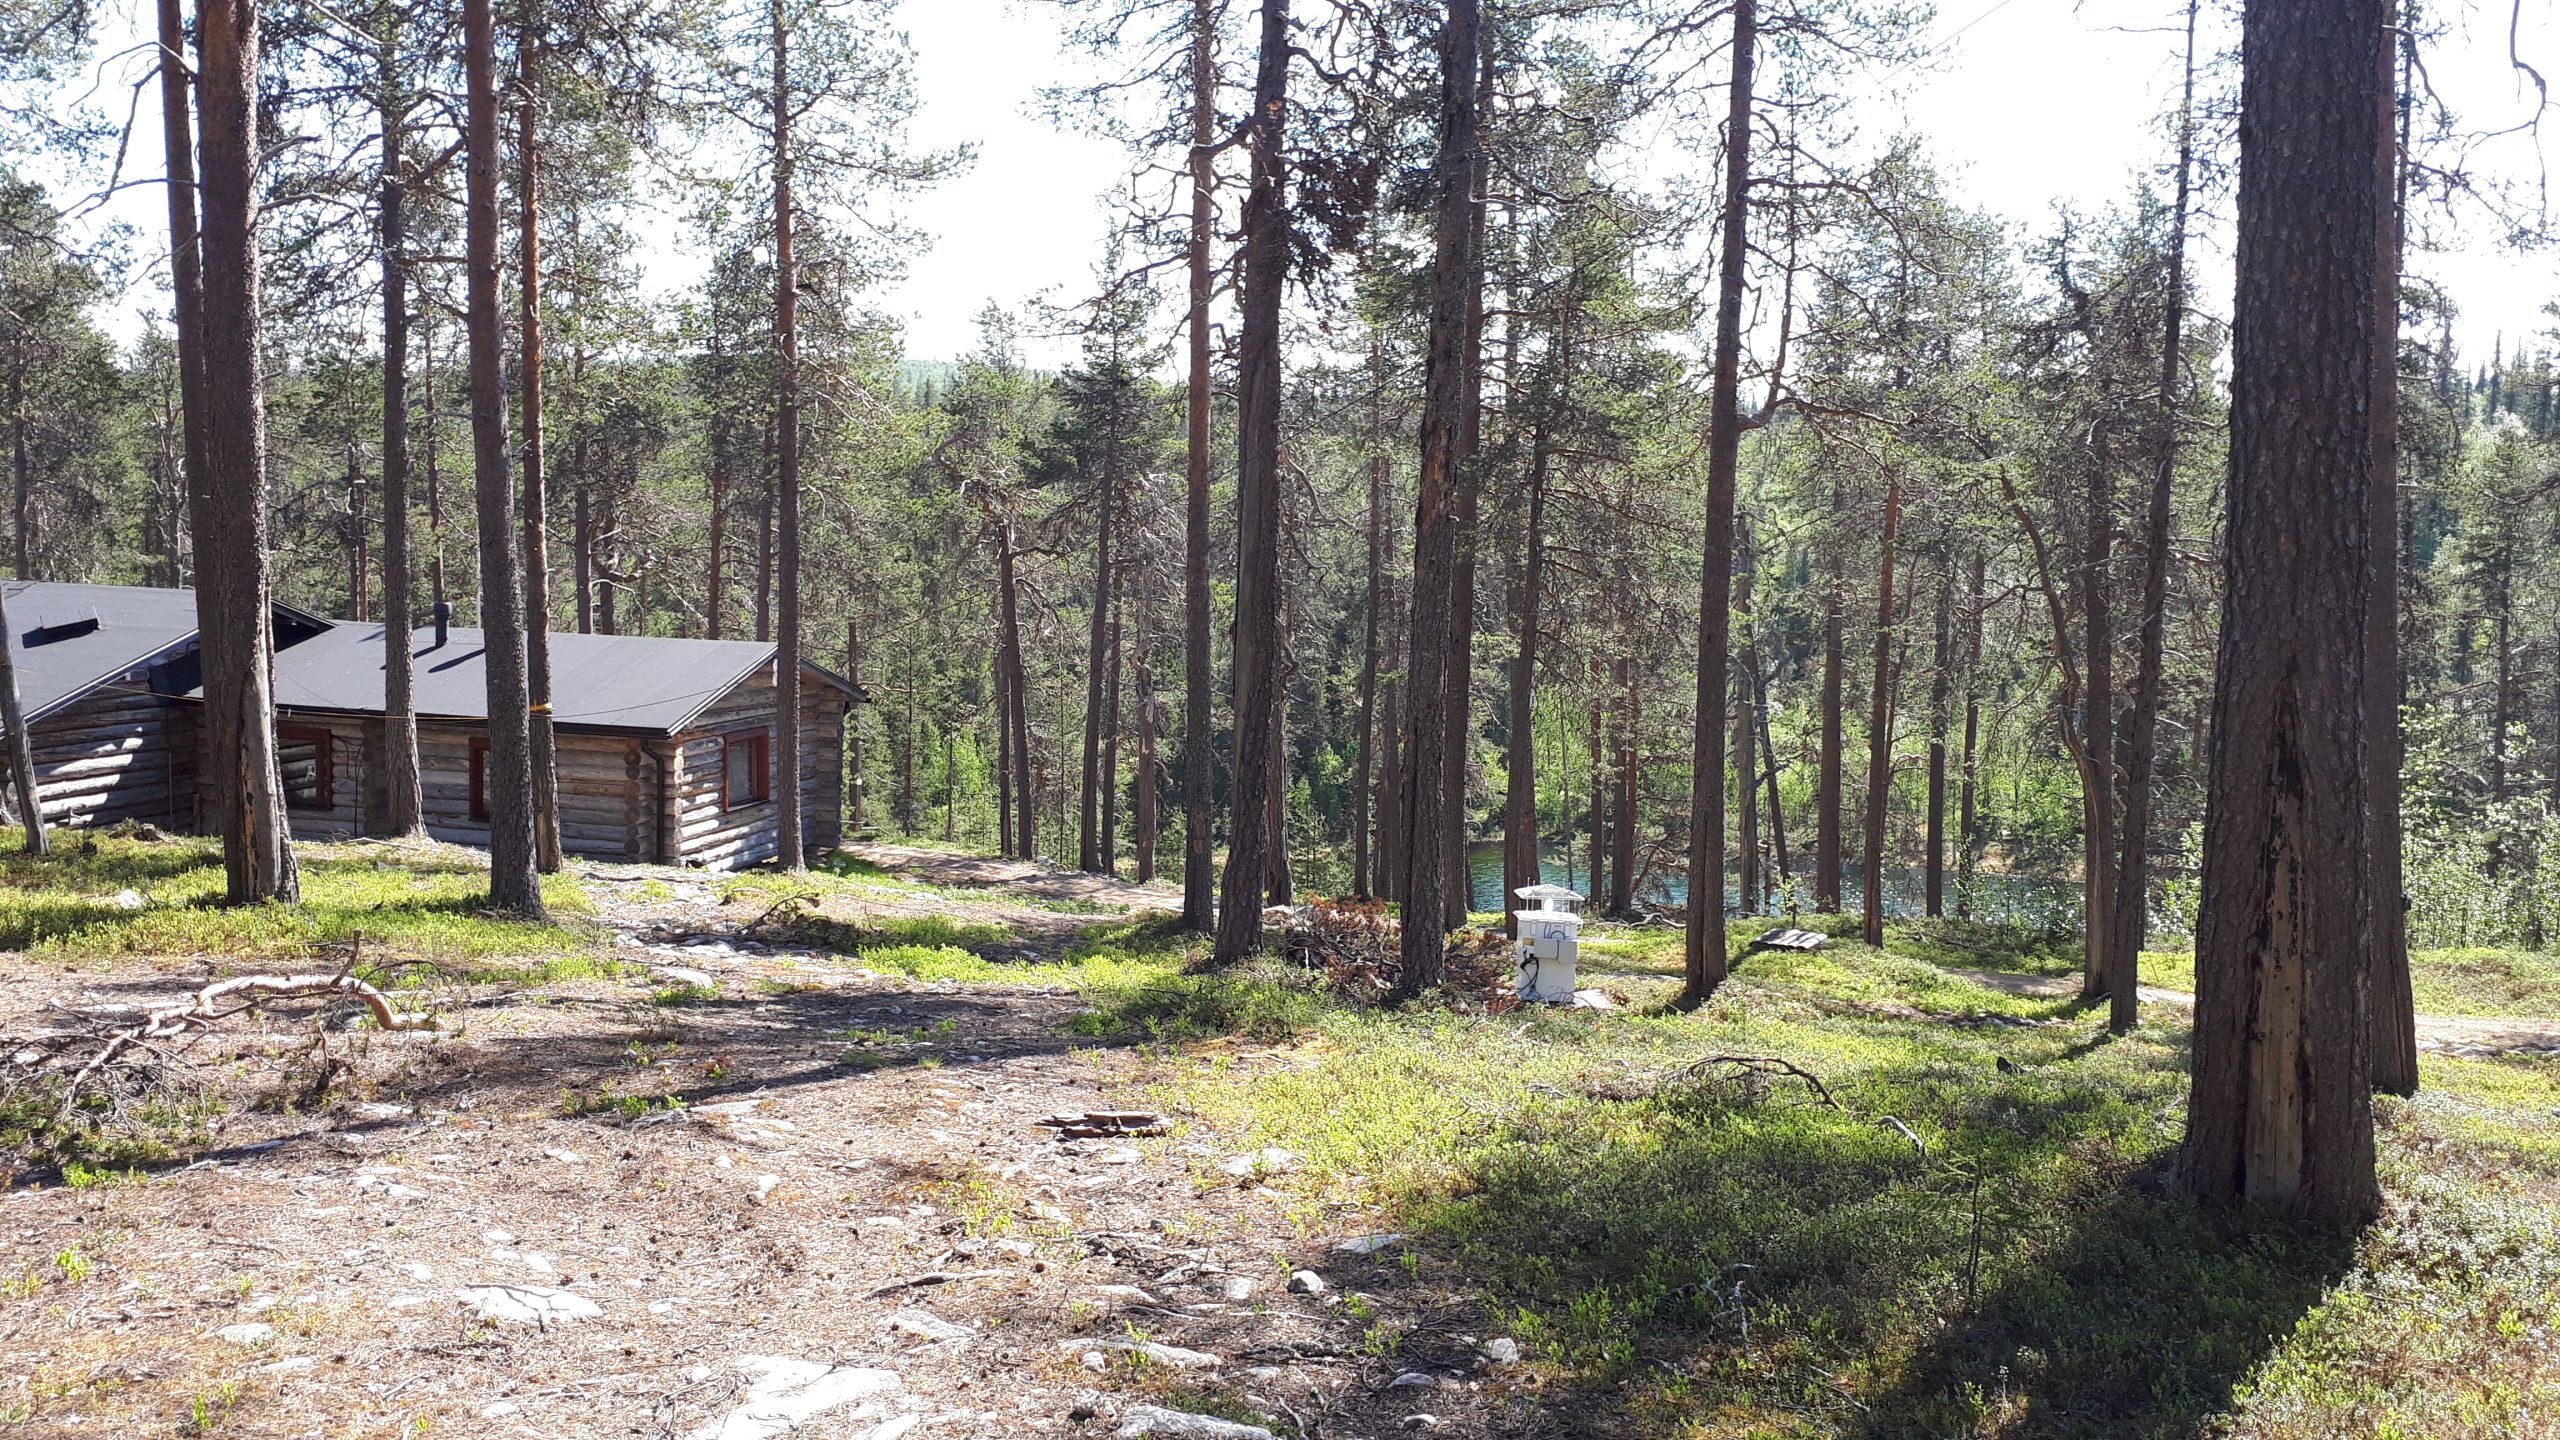
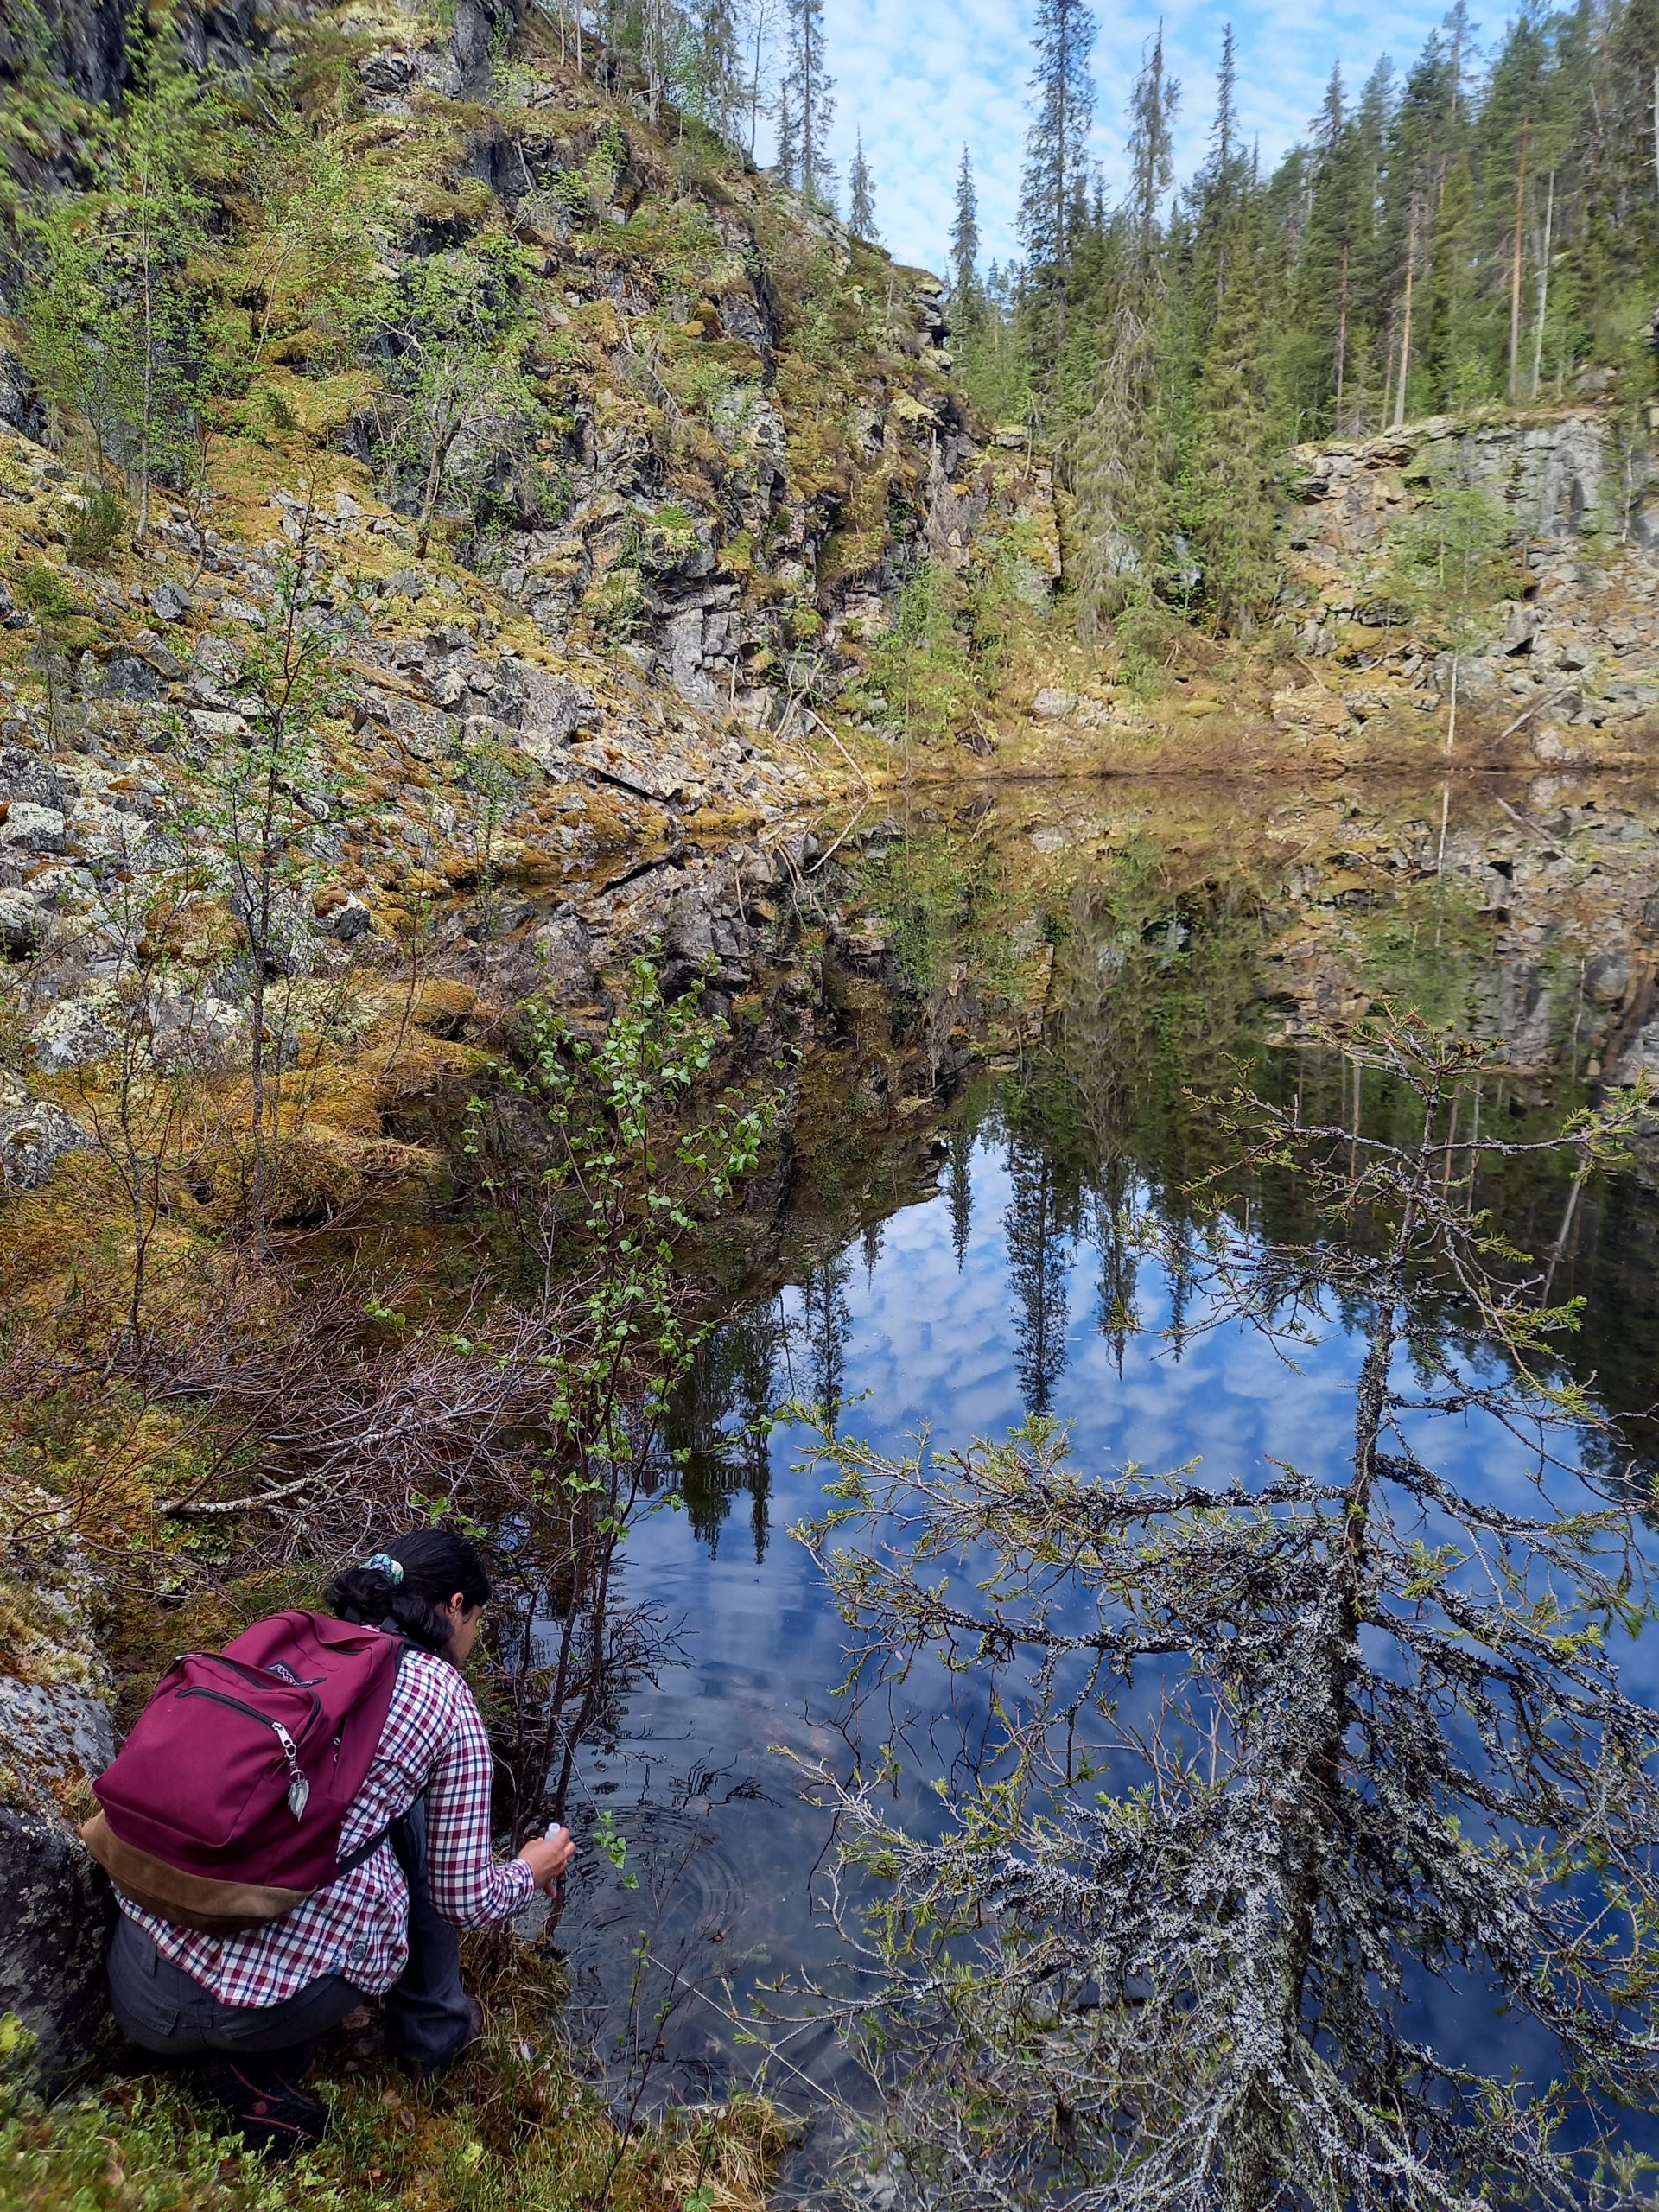
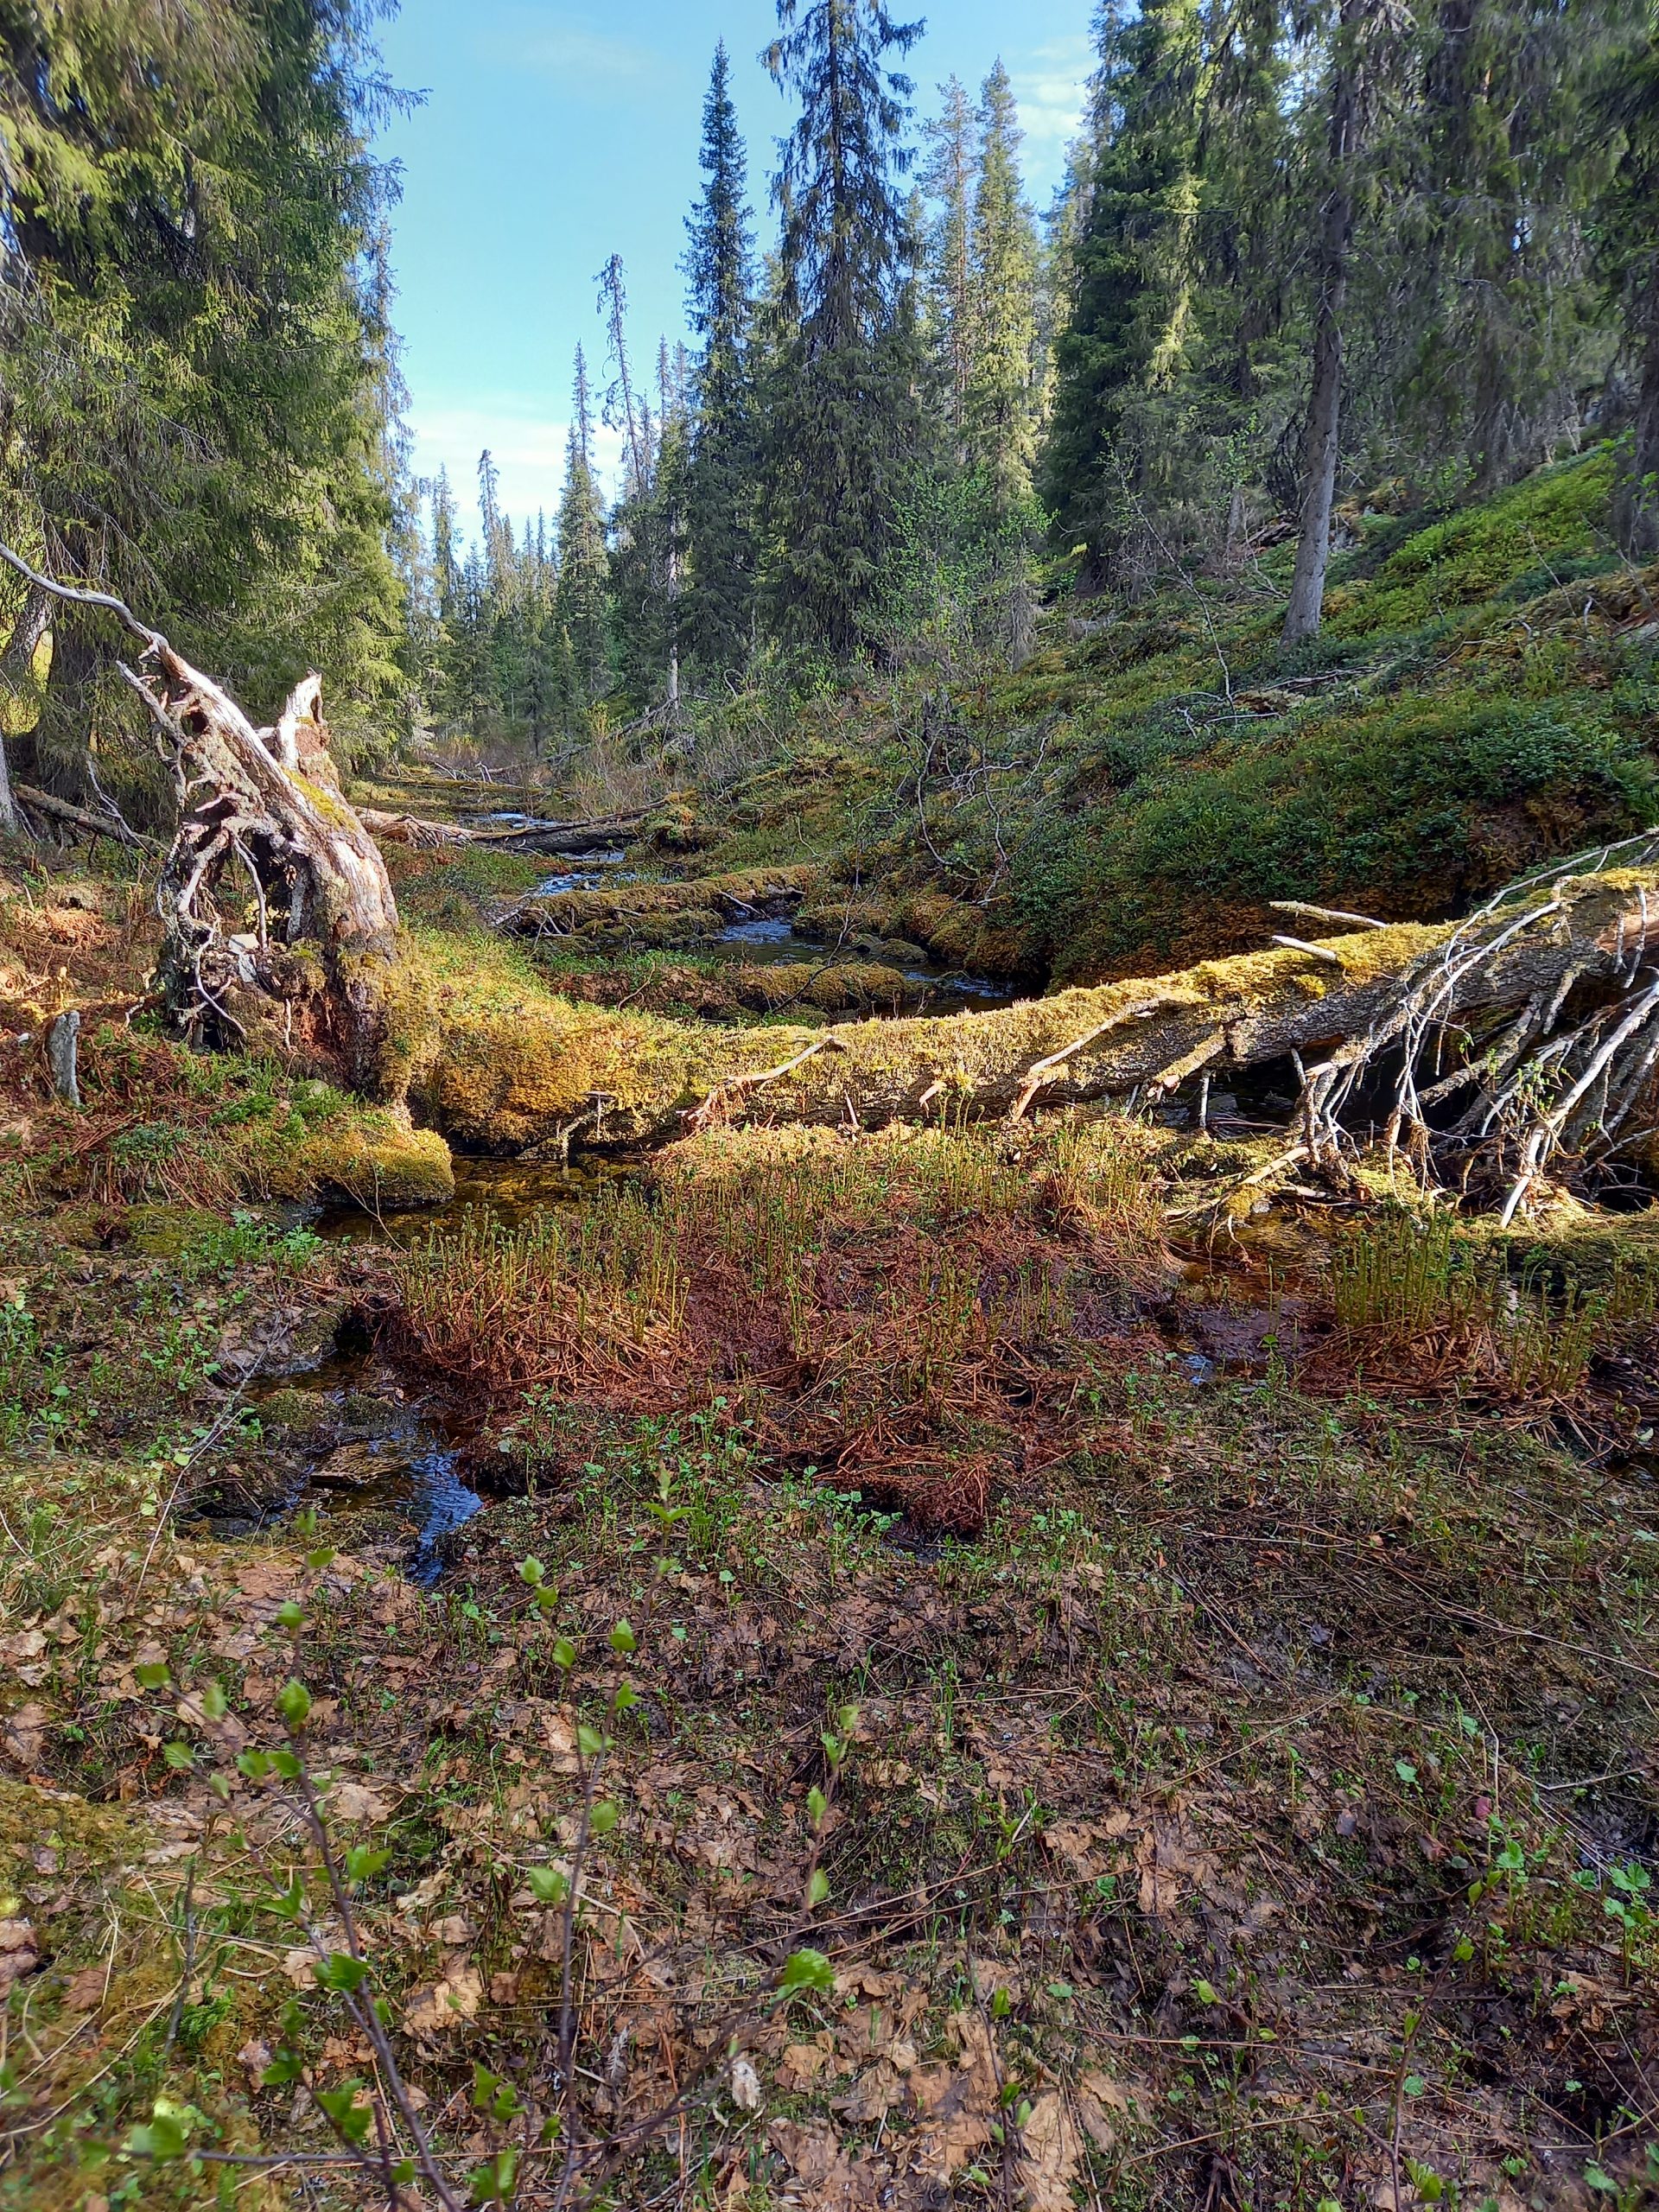
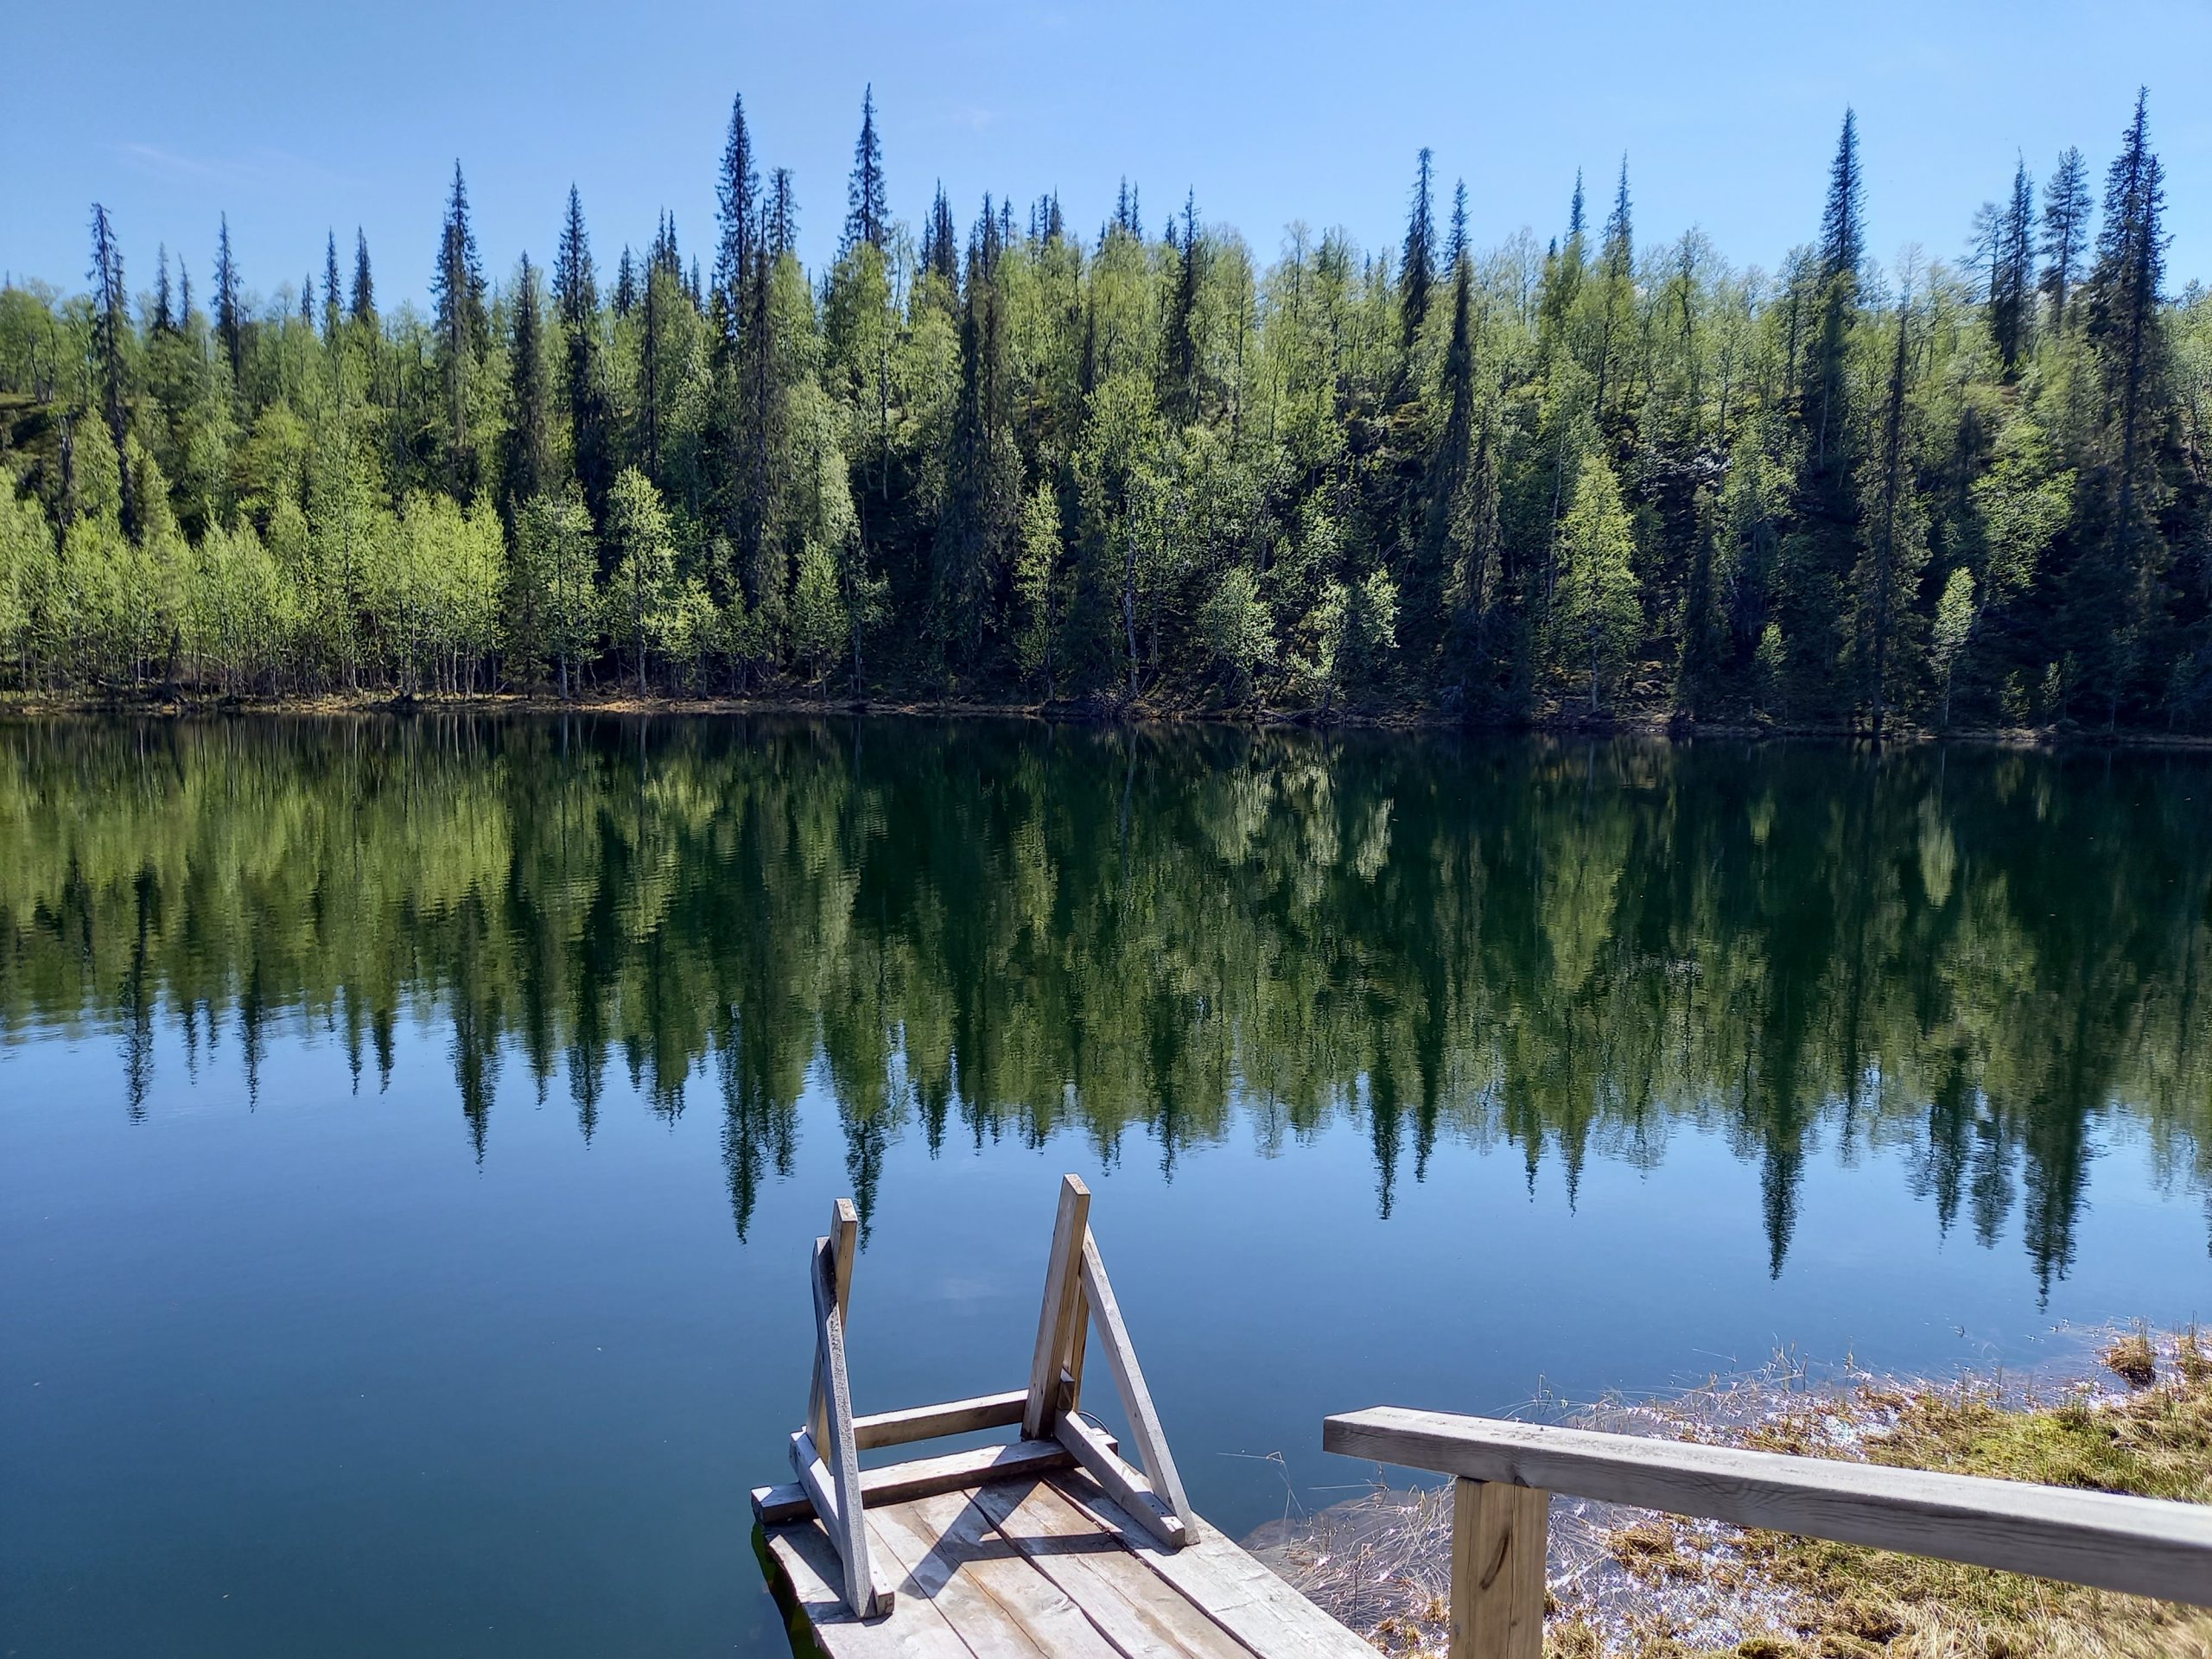
Before I planned to move to Finland for my doctoral research, “arctic lakes” were just two simple words for me. I only knew that these lakes were within the Arctic Circle. (Now I also know that anything northwards the Arctic Circle is only one definition of “arctic”.) Although I had some research experience on eutrophic Chinese lakes from my Master’s program, I felt unfamiliar with arctic lakes, which are significantly different from urban lakes I investigated previously. First, in terms of physical and chemical characteristics, urban lakes usually keep relatively stable states over the year, occasionally fluctuating with extreme weather events. In contrast, due to the pronounced climate, changing snow and ice cover, and differences in size, elevation, morphometry and ways of formation, arctic lakes experience a range of seasonal fluctuations in temperature, light availability and water quality [3]. Second, considering biological communities and production, urban lakes have higher species diversity involving all kinds of bacteria, phytoplankton, zooplankton, benthic species, fish and macrophytes, together with overall high primary productivity (dense algal blooms), compared to arctic lakes which are generally characterized by few species and low productivity [5]. The above-mentioned general characteristics of arctic lakes usually refer to lakes with clear water. However, arctic lake scenery is highly variable (Fig. 1). There are thermokarst lakes formed due to local permafrost degradation, and meltwater lakes, receiving glacial runoff with large amounts of suspended silt, and their water properties are very different from the clear-water lakes. Majority of the dozens of different ways for lake formation are presented in the Arctic, giving rise to the unique and diverse properties of arctic lakes, many of which remain unstudied. Arctic freshwater ecosystems provide services for arctic people and fauna. They are also important for global biodiversity, energy balance and carbon budget, all of which are rapidly changing due to climate warming.

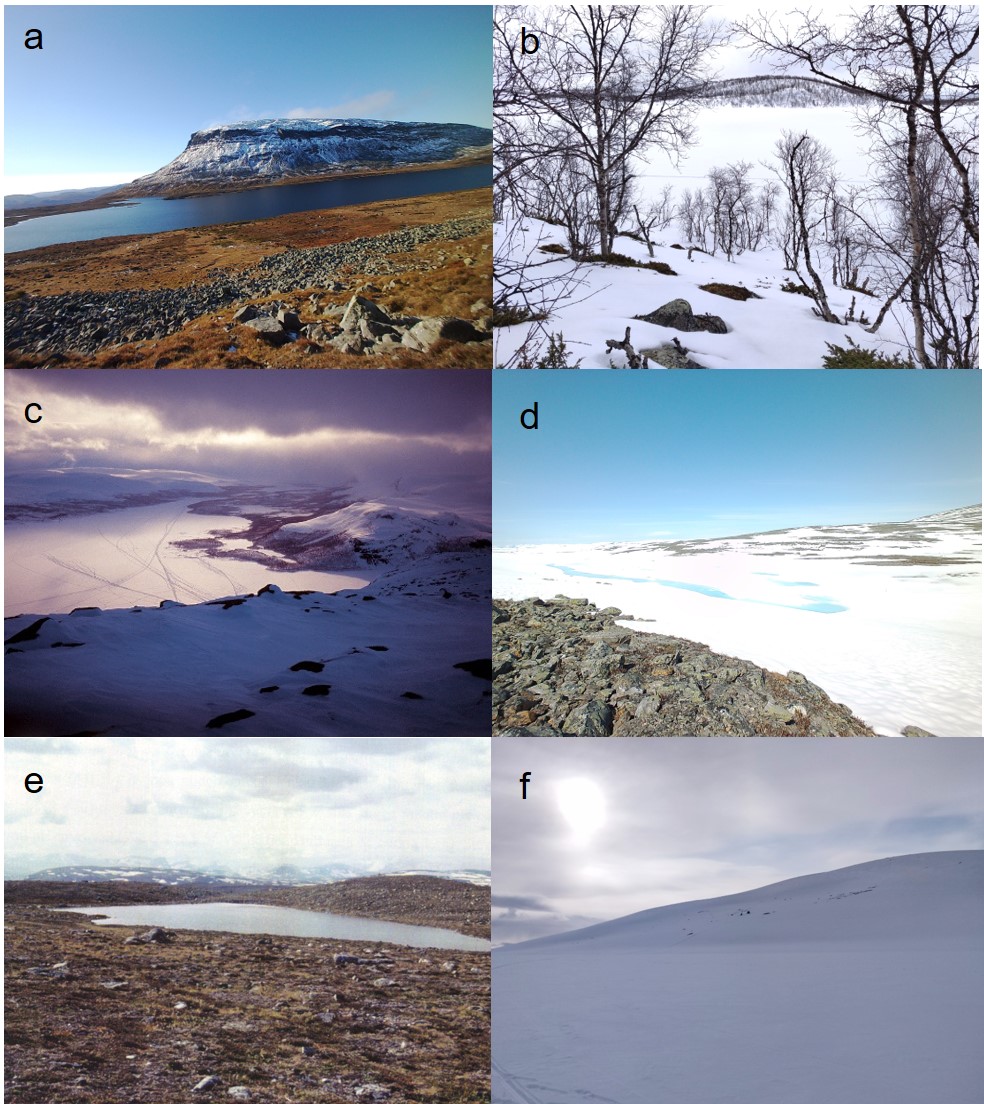
Figure 1. A variety of lakes in northernmost Finland. (a) Lake Saanajärvi at the altitude of 679 meters. (b) A lake surrounded by mountain birch forest at the altitude of 553 m. (c) Lake Kilpisjärvi at the altitude of 473 m. (d) An arctic lake without the official name at the altitude of 1009 m. (e) Lake Jeahkatslampi at the altitude of 930 m. (f) Lake Bahtasgohpejavri at the altitude of 776 m. Photos courtesy of Jan Weckström (a, c, d, e) and  Maija Heikkilä (b, f), Environmental Change Research Unit.

2. The impact of climate change on arctic lakes

Climate change has a multitude of direct and indirect effects on arctic lake ecosystems. Changes in air temperatures, wind and precipitation patterns affect the structure, function and biodiversity of lakes, but so do changes in freshwater, nutrient and sediment inputs from lake catchment areas. First, continuously increasing air temperatures induce increasing lake water temperatures, which can change the thermal regimes of lakes, such as variation in mixing and stratification patterns. Consequently, many biogeochemical and biological processes and species composition of the lakes are affected [6]. Second, glacier retreat and permafrost thaw lead to more nutrients, organic matter and silt flowing into lakes, potentially modifying nutrient and light conditions in the oligotrophic, clear arctic lakes and resulting in higher primary production in summer and emerging new species [3]. In addition, climate change directly affects lake ice cover. One of the earliest observed impacts of climate warming was based on the loss of freshwater ice [7]. Research evidence demonstrates later lake ice-on and earlier ice-off dates, leading to shorter annual durations of ice cover and thus changes in lake ecology [8, 9]. Although there are many factors (e.g., air temperature, wind speed, snow thickness, solar radiation) that can affect ice formation and melt in shallow and deep lakes, air temperature is the key driver [10]. Thus, lake ice phenology can serve as a useful indicator of late autumn and early spring climate change in a regional scale [11]. Additionally, lake ice plays a vital role in socio-economy such as ice roads, transportation, cultural recreation and tourism [12]. Understanding the freeze-thaw cycles of lake ice and their effects on arctic ecosystems including the human, can promote the safety of the region on many levels.

Research evidence demonstrates later ice-on and earlier ice-off dates of arctic lakes

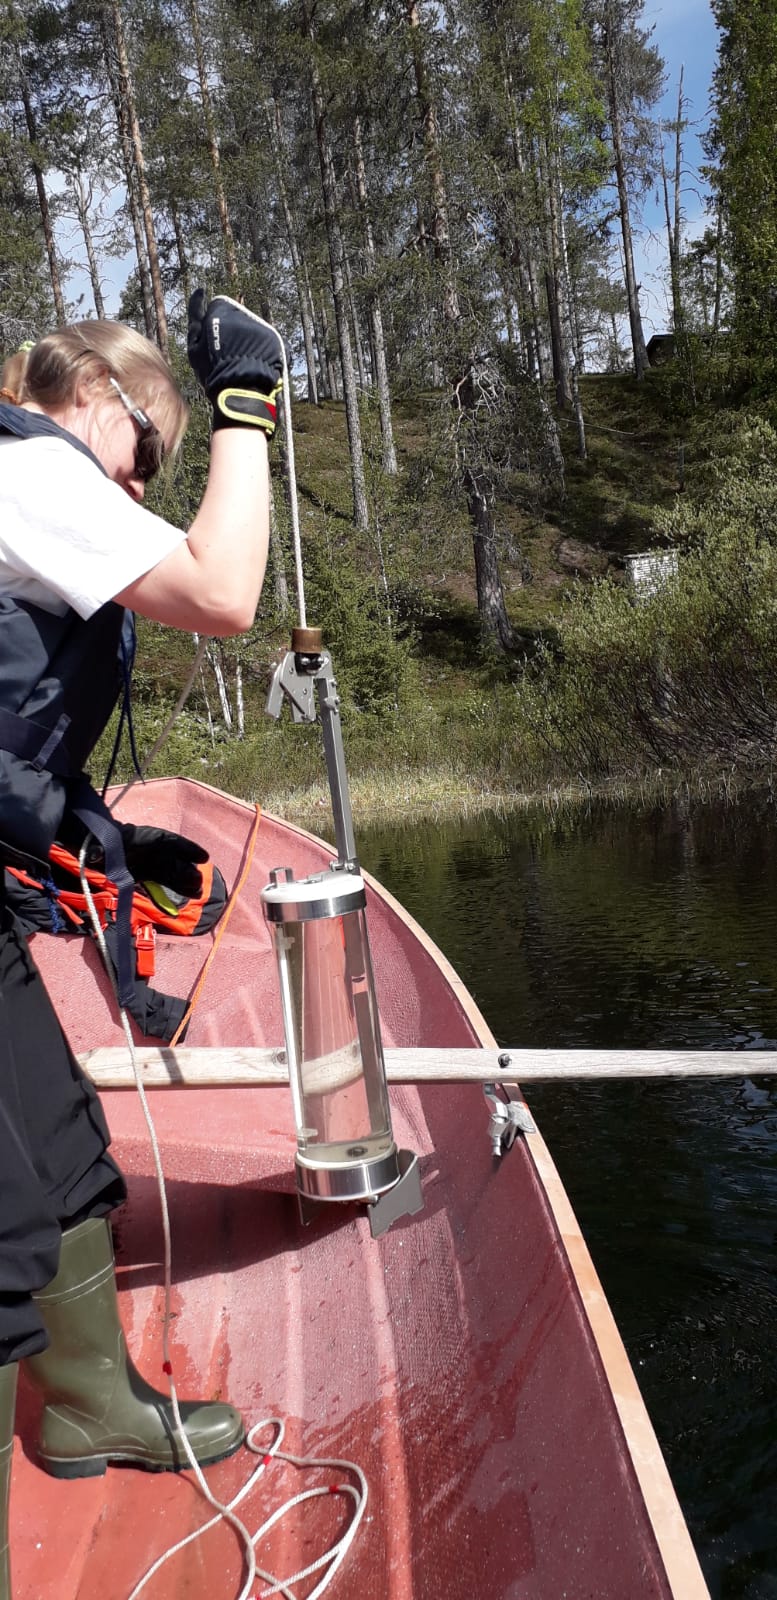
3. Arctic lakes and past climate reconstruction

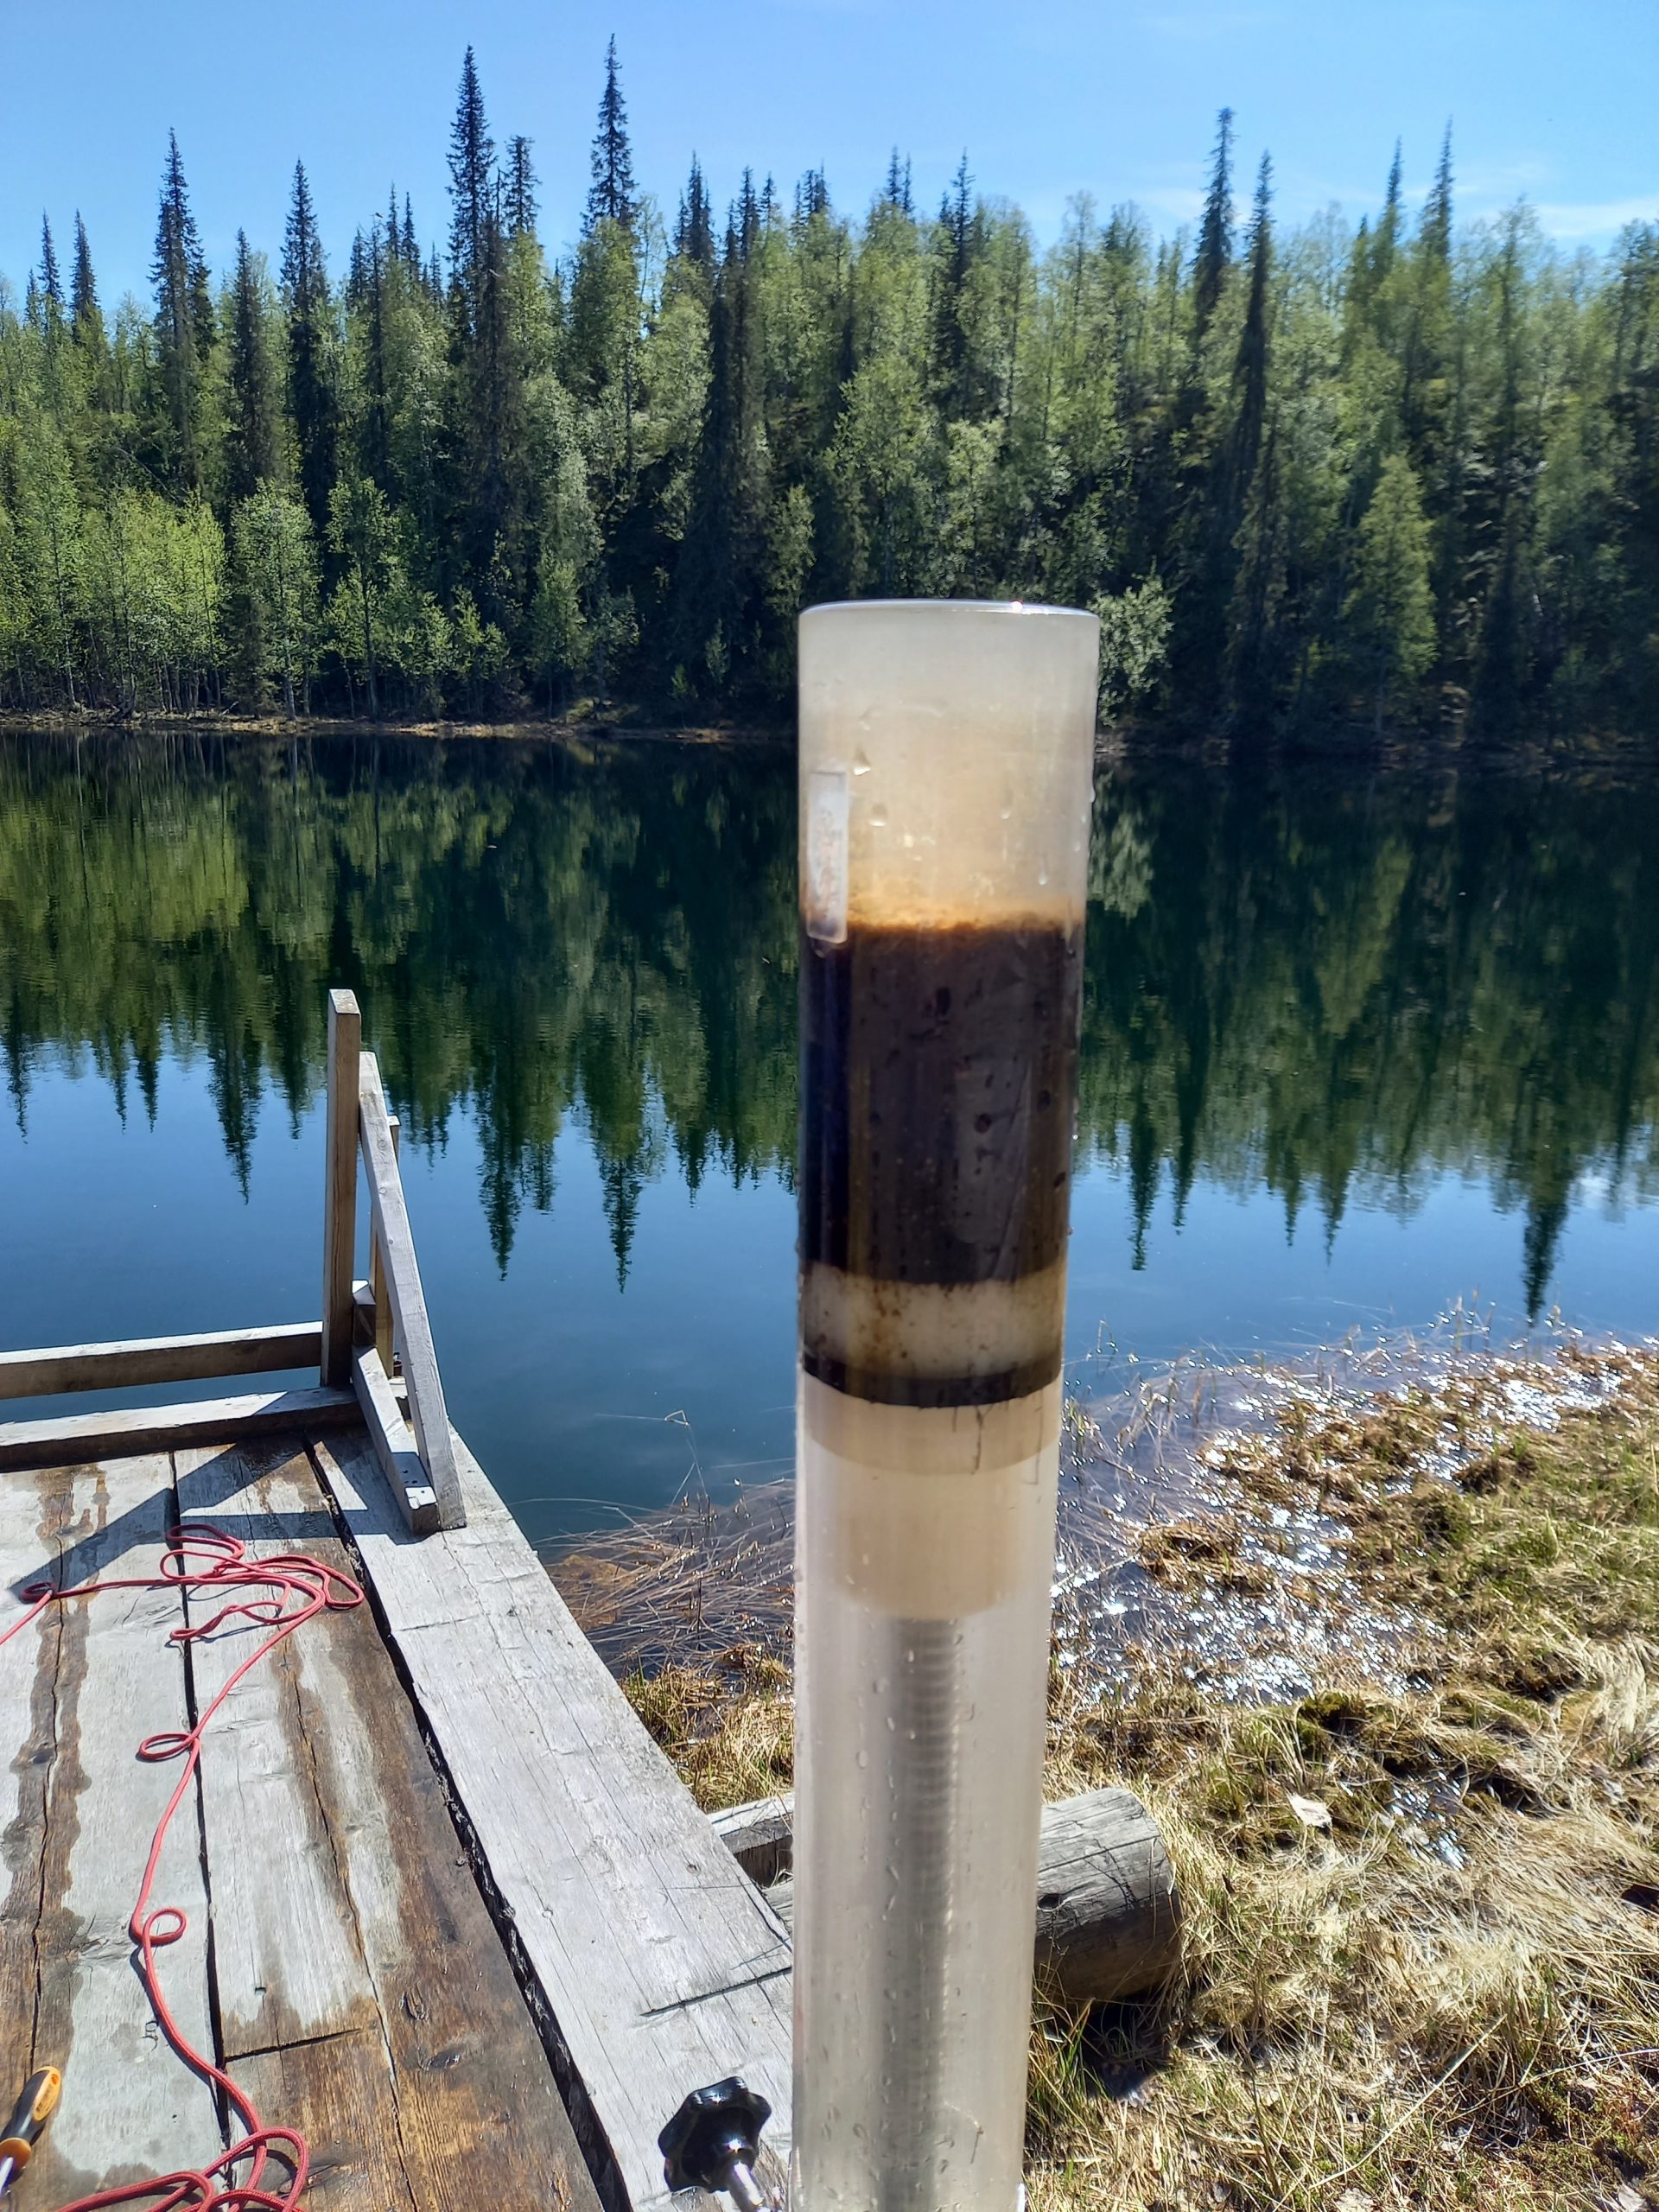
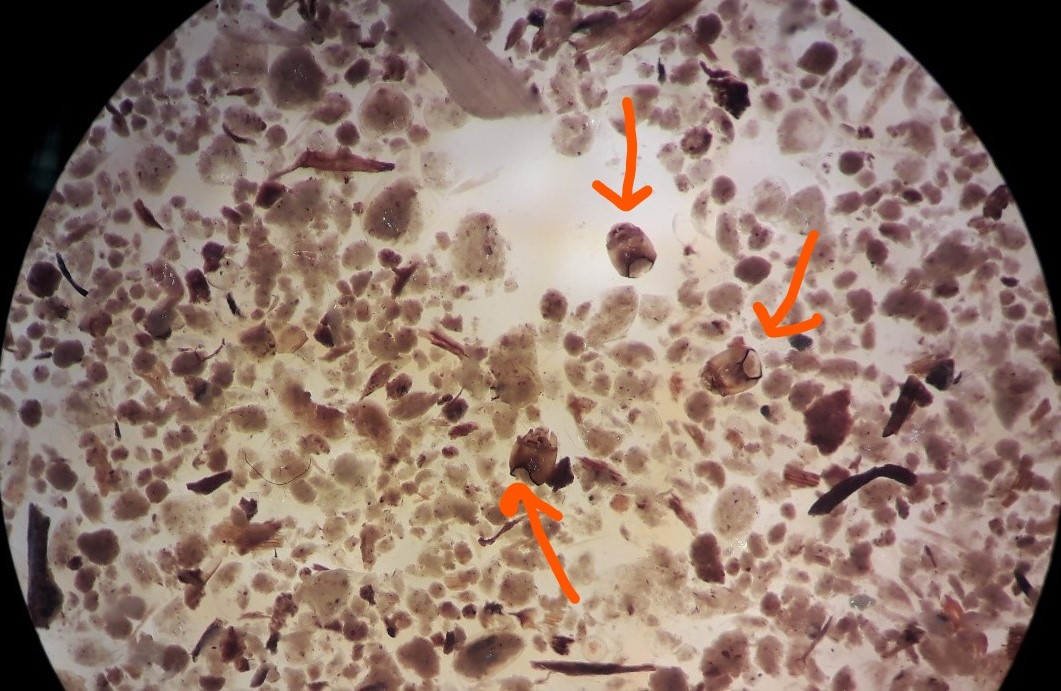
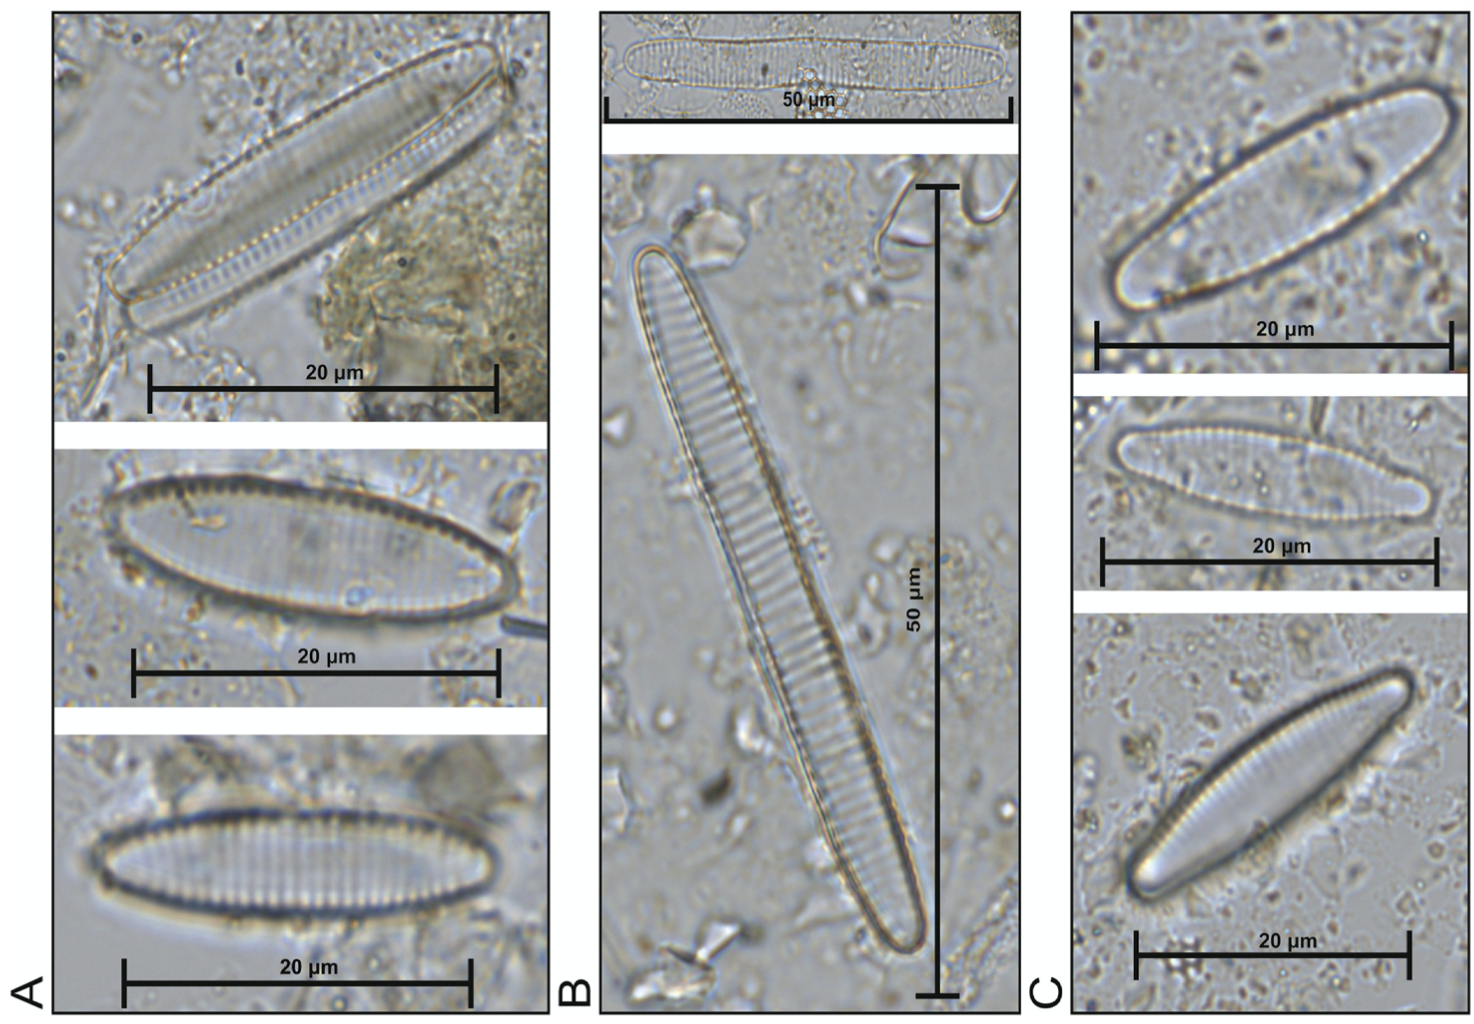
Human societies have had an increasing influence on global climate over the past centuries. Understanding natural climate changes and ecosystem responses is quintessential in preparing for future. As I mentioned above, arctic lakes are sensible to climate variability. What is more, their bottom mud or sediments, serve as a chronicle of changes over the past millennia. Lake sediments archive variations in biological and physical conditions and provide a unique temporal record of climatic change [13]. Many indicators, such as microfossils (diatoms, chrysophycean cysts, chironomids, cladocerans), biogeochemical markers (elemental and isotopic geochemistry, plant pigments, plant lipids), mineral magnetic analyses, and various sediment indices (the accumulation rates of organic carbon, nutrients, contaminants, etc.) have been developed to analyze the shifts in lake physical, chemical and ecosystem qualities [13, 14]. Therefore, a comprehensive arctic paleoclimate data network, covering various lake types in various settings, is necessary for reliable assessments of past, present and future climate patterns.

Circumpolar regions might seem isolated from the rest of the planet, but in reality, they play an integral role in the global climate system. Furthermore, these regions have been inhabited by arctic peoples for thousands of years [15], and experienced significant environmental transitions due to climate changes and human impacts. Improved understanding of northern nature and lakes and their responses to environmental changes will contribute to the sustainable development of the Arctic. It is a great honor for me to have an opportunity to participate in this research, and I hope to contribute to elevated knowledge of fascinating arctic lakes.

Mingzhen is a doctoral researcher whose research focuses on arctic lakes in northernmost Finland.

Reference

  1. Meredith M, et al. 2019. In: IPCC Special Report on the Ocean and Cryosphere in a Changing Climate. Cambridge University Press, Cambridge, UK and New York, NY, USA, 2019. 203-320. https://doi.org/10.1017/9781009157964.005.
  2. Moon TA, et al. (2021). Arctic Report Card 2021.  https://www.arctic.noaa.gov/Report-Card/Report-Card-2021
  3. Jeppesen E, et al., 2020. Ecology of Arctic Lakes and Ponds. In Thomas, DN (ed): Arctic Ecology, pp. 159-180.  https://doi.org/10.1002/9781118846582.ch7
  4. Muster S, et al., 2017. PeRL: a circum-Arctic permafrost region pond and lake database. Earth System Science Data 9: 317–348. https://doi.org/10.5194/essd-9-317-2017
  5. Christoffersen KS, et al., 2008. Food-web relationships and community structures in high-latitude lakes. In Vincent WF & Laybourn-Parry J (eds): Polar Lakes and Rivers: Limnology of Arctic and Antarctic Aquatic Ecosystems. DOI:10.1093/acprof:oso/9780199213887.003.0015
  6. Arvola L, et al., 2009. The Impact of the Changing Climate on the Thermal Characteristics of Lakes. In George, G (ed.): The Impact of Climate Change on European Lakes, 85-101. DOI: 10.1007/978-90-481-2945-4
  7. Walsh SE, et al., 1998. Global patterns of lake ice phenology and climate: Model simulations and observations. Journal of Geophysical Research: Atmospheres 103(D22): 28825-28837. DOI: 10.1029/98jd02275
  8. Magnuson JJ, et al., 2000. Historical Trends in Lake and River Ice Cover in the Northern Hemisphere. Science 289: 1743-1746. DOI: 10.1126/science.289.5485.1743
  9. Benson BJ, et al., 2012. Extreme events, trends, and variability in Northern Hemisphere lake-ice phenology (1855–2005). Climatic Change 112: 299–323. DOI: 10.1007/s10584-011-0212-8
  10. Kirillin G & Leppäranta M, 2021. Lake Ice Formation and Melt. Under-Ice Dynamics. Reference Module in Earth Systems and Environmental Sciences,
    Elsevier. https://doi.org/10.1016/B978-0-12-819166-8.00003-7
  11. Hodgkins GA., et al., 2002. Historical changes in lake ice-out dates as indicators of climate change in New England, 1850-2000. International Journal of Climatology 22: 1819-1827. DOI: 10.1002/joc.857
  12. Arp CD, 2019. Ice roads through lake-rich Arctic watersheds: Integrating climate uncertainty and freshwater habitat responses into adaptive management Arctic, Antarctic, and Alpine Research 51, 9-23. https://doi.org/10.1080/15230430.2018.1560839
  13. Korhola A, et al., 2002. A multi-proxy analysis of climate impacts on the recent development of subarctic Lake Saanajärvi in Finnish Lapland. Journal of Paleolimnology 28: 59-77. https://doi.org/10.1023/A:1020371902214
  14. Lehnherr I, et al., 2018. The world’s largest High Arctic lake responds rapidly to climate warming. Nature Communications 9: 1290. https://doi.org/10.1038/s41467-018-03685-z
  15. Kotlyakov VM, et al., (eds.) 2017.  Human Colonization of the Arctic: The Interaction Between Early Migration and the Paleoenvironment. 530 pp. https://doi.org/10.1016/B978-0-12-813532-7.01001-9

In the field under the midnight sun

by Lilia Orozco and Ana Dauner

(Lilia explains) Paleoecologists collect a sediment core and may start working on the material right away. However, in order to look into the past, it is often useful to look at the present as well. That is the case for our project, where we use data collected from the current lake and catchment as a reference when inferring past conditions. Past summer, our project took us to the research station in Värriö strict nature reserve, eastern Finnish Lapland, where we have an ongoing monitoring program for isotopic composition of precipitation and lake water. In this blogpost, we will tell you about our field experience.

Arrival to the research station was an adventure of its own! Neither of us had a European driver’s license, so we had to carry our equipment in public transportation. This meant 12 hours in the train, an hour and a half in a bus, two hours in a taxi, and 20 minutes on a quad bike, to reach our destination.

(Ana continues) When we first arrived, the immensity and homogeneity of the landscape formed my first impression. At first sight, all I could see was this huge Scots pine (Pinus sylvestris) forest. And I thought: “Um, okay, beautiful, but nothing special”. When we later started to collect samples, I realized how wrong I was! Every lake was located inside a very steep valley – around 40 meters downhill in a 100-meter distance. In addition to the impressive view provided by the steep cliffs, every turn gave a different color explosion.

(Lilia) During the week we stayed in Värriö, we collected water samples from nearby lakes and surface sediment samples from our study site, Lake Kuutsjärvi. Because our visit was in the beginning of the summer, we were joined by the midnight sun. Both Ana and I were born and raised in tropical countries, Mexico and Brazil, respectively, and we got to experience endless summer days for the first time. The nature reserve houses beautiful forests with gigantic old pine trees.

(Ana) Speaking about the sampling campaign itself, it could not have been better! The weather was nice for the whole week, so we did not have to struggle maneuvering with equipment in the rain. The water samples were very easy to collect with the Limnos sampler. The sediment samples took a bit more effort. The HTH sediment sampler did not perforate the lake bottom every time. And perhaps, I can complain a bit about the weather anyway: although the sun was always shining, it was a bit windy, especially in the afternoons. Our boat drifted between sampling attempts, and we had to row to the correct position before each new attempt. A little more work, but the effort paid off and we were able to collect all the samples!

(Lilia) One of the great perks of field work is the possibility to enjoy nature while sampling. We were lucky to have some the extra time to explore the forest around the research station. It was fascinating to see the transition from boreal forest to mountain birch (Betula pubescens subsp. czerepanovii) forest, and finally to subarctic tundra at the top of the fells nearby. The landscape was very beautiful!

(Ana) I also paid attention to the clear change in vegetation towards the felltops. Instead of a dense pack of pine trees, we could only see some sparsely distributed trees, most of them twisted and adapted to the harsh climate. Dwarf-shurbs, such as crowberry (Empetrum nigrum) and blueberry (Vaccinium myrtillus) blanketed the land surface. Unfortunately, it was the beginning of the summer so, no berries for us! But the view was, again, worth the walk. Another interesting and peculiar novelty for me was the “sea of rocks”, more appropriately termed a blockfield or “rakka” in Finnish! On the two hills we climbed, we could see large patches of broken rocks. Almost if a truck had simply deposited them there. Later I learned that the blockfields were produced locally, due to below-surface frost weathering.

(Lilia) Värriö research station is part of our University’s Institute for Atmospheric and Earth System Research (INAR). Professor Mikko Sipilä and researchers Kimmo Neitola and Jukka Kärki along with the staff at the research station hosted us, were very helpful, and kept us out of trouble. The nature reserve hosts wildlife such as bears and wolverines, and has some scarp cliffs, but thanks to their advice, our sampling was a success and we were never in any danger.

(Ana) We also had a chance to visit the SMEAR I (Station for Measuring Ecosystem-Atmosphere relations) atmospheric measurement base in Värriö. It was wonderful to know how the station tracks and measures not only weather, but also aerosols and trace gases.

Altogether, it was a great experience and we hope we get to visit again.

Lilia is a PhD student who took a dip into the cold waters of Lake Kuutsjärvi. Ana is a postdoctoral researcher who loves taking pictures of the landscape.

To see more photos from Värriö Subarctic research station, visit their nature diary.

Three facts about chironomids and my first experiences with them

By Lilia Orozco

  1. Chironomids are not mosquitoes

When I started my doctoral research, I did not really know what chironomids were. I think I might have seen them in nature (my very first experience!) and confused them with something else. Chironomids are part of the same insect order as mosquitoes and flies, Diptera (1). Chironomids look like mosquitoes, but do not be mistaken: they lack the tube-like sucking mouth and do not bite, hence the name of non-biting midges. Chironomids are ubiquitous as long as there is enough moisture. Adults live only from a few days to a few weeks. As larvae, they live on the bottom of water bodies from rivers and lakes to puddles and sewage systems where they serve as food source for other animals, forming an important part of the food web.

Chironomid or non-biting midge by MarioQA licensed under CC BY-NC 2.0
  1. Paleoecologists study remains of chironomid larvae

Forget the study of fossil fake mosquitoes: paleoecologists are not in the search of wings and legs. Instead, chironomid larval stage has a hard head capsule that preserves well in lake sediments. Paleoecologists find them in ample amounts in sediment cores in comparison to other insect remains, which has generated many applications for chironomid head capsules in reconstruction of past environments since the late 1920s (2). The concept is simple, as larvae they live in the water, and consequently the aquatic environment has a strong influence on the species present and their abundance (1). Chironomids are sensitive to physical and chemical properties of the water; some species are indicators of water quality, while others are only found at certain depths or oxygen levels. However, it is summer climate what mostly determines the species distribution (3).

Photo of chirnomid larvae by Frank Fox, licensed under CC BY-SA 3.0

The particular ecologies and niches of the different chironomid species make them robust environmental indicators. In the early applications, chironomids were used as indicators of changes in trophic level and salinity. It took 40 years for the method to develop and establish. It was between 1980s and 1990s that scientists started to use chironomid assemblages as a proxy for climate, in particular summer temperatures (1). A notable disadvantage of the method, however, is the time it takes to prepare the microscope slides and identify fossil head capsules. One has to hand pick each individual tiny skull from the sediments before mounting them on the microscope slides.

  1. Oxygen isotopic composition of chironomid remains tracks that of past lake water

A more recent paleoecological application utilizes the chemical composition of head capsules (my current learning process!). They are made of chitin (C8H13O5N), an organic compound with a similar function as the keratin in our hair and nails. The isotopic composition of carbon, oxygen or nitrogen in the chitinous head capsules can be used to reconstruct changing environmental conditions as well. The δ13C and δ15N reflect their diet (4), and can be used to study sources of organic matter, and past food webs (5). Some genera (Chironomus, Stictochironomus and Propsilocerus) absorb C from methane, and have been used to infer past methane abundance and cycling (5, 6).  We are interested in the δ18O, as 70% of it comes from the water the larvae grow in (7). Water stable isotope ratios (δ2H and δ18O) can give us an insight into past hydrological dynamics affecting the lake, more specifically precipitation amount and source, as well as summertime evaporation, both of which also control lake levels and catchment dynamics. Thus, we can study hydroclimatology through changes in the isotopic composition of past lake water recorded in the head capsules.

In our present study, the lake area is considerably smaller than the catchment, which usually results in a short water residence time. Because of it, we can assume that the isotopic composition of lake water is sensitive to changes in regional hydroclimate resulting in e.g. higher or lower lake levels and changes in seasonality. In our project more broadly (Beyond the shore: sea-ice change and lake ecosystems in the Arctic or SLEET, funded by the Academy of Finland), we are studying how changes in past sea-ice cover influences lake ecosystems through the hydrological cycle.

Three chironomid head capsules floating on the sediments, ready to be picked up and cleaned.

The road to retrieve the isotopic composition of the past lake water from chironomid head capsules requires fine motor coordination and perseverance. Before measuring the δ18O from the fossils, I first have to separate them from the rest of the sediments and clean them. This is how I spend my days at the moment: I sit in front of the microscope, and with a pair of sharp tweezers and patience, I inspect the rinsed sediment in search of as many head capsules as I possibly can find. For producing a summer temperature reconstruction based on species assemblages, typical studies count and identify between 50 and 200 head capsules per sample. For measuring the oxygen isotopic composition, however,  we need a minimum of 80 µg of head capsule mass, which sounds like a very small amount but requires from 100 to up to 800 head capsules and fragments depending on the size. In addition, the abundance of remains in the sediments can vary greatly. It is a long journey, and I anticipate that the results we will get will feel equally rewarding.

Lilia is a PhD student who listens to podcasts while working on the microscope.

NOTE: Isotopes are atom variations of the same element. They have the same number of protons and electrons, but a different number of neutrons, which results in mass differences among the isotopes. Usually some isotopes are more abundant than others, for example 99.76% of the oxygen in nature is 16O, while only 0.20% is 18O. The delta-value notation is the ratio between the less common isotope, and the most abundant, and to a standard value. Because these values are still too small, they are reported as per mil. We can use stable isotopes because of their mass differences. During physical and biological processes the light and heavy isotopes fractionate, they separate. Take boiling water as an example, it takes less energy to evaporate water molecules with light  isotope 16O, than with heavier isotope 18O.

References:

  1. Brooks SJ, 2006. Fossil midges (Diptera: Chironomidae) as palaeoclimatic indicators for the Eurasian region. Quaternary Science Reviews 25: 1894–1910. https://doi.org/10.1016/j.quascirev.2005.03.021
  2. Gams H, 1928. Die Geschichte der Lunzer Seen, Moore und Wälder. Vorläufige Mitteilung. Internationale revue der gesamten Hydrobiologie und Hydrographie 18:349–387.
  3. Goedkoop W, ÅKerblom N, Demandt MH, 2006. Trophic fractionation of carbon and nitrogen stable isotopes in Chironomus riparius reared on food of aquatic and terrestrial origin. Freshwater Biology 51:878–886. https://doi.org/10.1111/j.1365-2427.2006.01539.x
  4. Heiri O, Schilder J, van Hardenbroek M, 2012. Stable isotopic analysis of fossil chironomids as an approach to environmental reconstruction: state of development and future challenges. Fauna norvegica 31:7–18. http://dx.doi.org/10.5324/fn.v31i0.1436
  5. van Hardenbroek M, Heiri O, Grey J, Bodelier PL, Verbruggen F, Lotter AF, 2010. Fossil chironomid δ13C as a proxy for past methanogenic contribution to benthic food webs in lakes? Journal of Paleolimnology 43:235–245.
  6. Walker IR, 2006. Chironomid Overview. Elsevier, Cambridge, UK.
  7. Wang YV, O’brien D, Jenson J, Francis D, Wooller M, 2009. The influence of diet and water on the stable oxygen and hydrogen isotope composition of Chironomidae (Diptera) with paleoecological implications. Oecologia 160:225–233.

The large-scale approach – my experience with open databanks

by Ana Lúcia Lindroth Dauner

When someone tells me that the climate is changing, I always think “Okay, but how? Where is it changing? Is it changing in the same way everywhere? How do the changes affect ecosystems and human societies?” In order to answer these types of questions, an comprehensive set of adequate, good quality data is essential. The challenge with these large-scale questions is that you cannot collect all this data within your research project – or even within your lifetime of research. For example, I am currently investigating how past changes in Arctic sea-ice cover affected lake ecosystems in the northern polar region. I cannot simply go out and collect samples from every lake in and around the Arctic.

The sampling of sedimentary records usually requires complex and expensive expeditions, with a team of scientists, especially if the sampling site is remote. For example, some lakes are located far away from roadways and electricity; so proper vehicles and carrying generators to the field are needed. After sediment cores are recovered, the sediment dating and analytical laboratory work is expensive, laborious and time-consuming. In order to analyse only one sediment record sliced into approximately 100 samples, it took me around 4 months of direct laboratory work during my PhD. So, imagine how long it would take for an army of PhD students to analyse, for example, one record from one hundred different lakes! And, even if I could sample one lake in each continent, it would not be representative of the whole region. Several factors affect the organic matter production within a lake, such as lake elevation, hydrology, the type of catchment vegetation and the distance from the coast (termed “oceanity” or “continentality”) that affects the temperature and precipitation patterns. These regional and local factors vary greatly within a large region. That being said, what is the solution? Well, one option is to use data collected by other researchers!

In order to analyse only one sediment record sliced into approximately 100 samples, it took me around four months of direct laboratory work during my PhD. So, imagine how long it would take for an army of PhD students to analyse, for example, one record from one hundred different lakes!

Even though the northern polar region is remote, high-quality scientific research has been performed in these regions for decades, and several of the published datasets are available in online databases such as Pangaea1, NOAA/WDS for Paleoclimatology2 and Neotoma Paleoecology Database3. They make available proxy information from lake sediment cores, some of which could be suitable for inferring past changes in lake production, such as the percentage of organic matter or the number of microalgal fossils. All I need to do is to download these datasets, combine the information and answer my question, right? Well, it would be fantastic if it were that fast and easy! However, that is rarely the case.

First of all, there are more than just one central database. It was almost like looking for a specific author within several libraries. Then, there was the challenge of carefully choosing the search words. If I simply looked for “lakes” in a northern hemisphere database, I received thousands of results, most of them lacking the information I was looking for. If I used too specific search words, such as “biogenic opal flux”, on the other hand, I got just a few data sets and might have missed out on valuable information. There is no magic formula here, and as generally in research, for big data science too, perseverance and patience are the keywords. One last bump on the road in the searching process was that many published datasets were not made available online. Although nowadays several journals and universities require authors to make their data openly available in one of the online databases, sometimes even before publishing the manuscript, significant amount of good datasets remain behind the authors. So, in many cases, even big data searching involves basic human connection: writing the authors asking for their data for a specific purpose, and hopefully waiting for them to respond positively.

After searching for proper databases through adequate search words, I (luckily!) found myself with lots of datasets. Yet after all that, I needed to tackle the main challenge: keeping things in order! As someone who struggles with orderliness, it was especially important to find a way to keep my research organized! Every sediment record received a unique ID and I created a spreadsheet where all the information was combined according to this unique ID. This way, I can easily check the information related to a specific record, such as the lake size or if this record has microalgae data. Another important step was to standardize the format of the datasets, so I can work with them in a more efficient way. Only after that, it was possible to start cleaning the data. After looking into various databases (or libraries), it is common to have replicas, i.e., the same data set was found in more than one library. So, they needed to be removed and the remaining data problems, such as missing data or inadequate temporal resolution and different units (e.g. temperatures in Celsius or Fahrenheit), fixed. All these filtering, cleaning and tidying steps are extremely important but can take a long time, so planning accordingly is vital!

Enough of the challenges: you want to know what happened to my data digging experiment, right? At this point, I am still dealing with the above-mentioned steps! Patiently and gradually, I will be able to proceed to the next steps: appropriate analyses and graphs to combine and compare all the information in a way that robust answers to my questions, so my compilation is not, well, “just a lot of data”. As someone who is still in the searching, cleaning and tidying step, I increasingly value the studies and the researchers that were able to extract information from several previous studies to answer a new and exciting research question.

Also, from what I have for now, I think we need more field work and lake records! Most of the studies in the online databases were performed in coastal regions and mainly in Alaska, Fennoscandia and coastal Greenland, but data from the Arctic Russia, some parts of Canada and more continental regions are still lacking. Moreover, analytical and chronological techniques and thus data resolution and proxy variety have progressed in time. In any case, I believe that the collection of published data I have compiled will be enough to start answering some the intriguing large-scale questions. Stay tuned!

_______

Ana Lúcia is a postdoctoral researcher who strangely finds joy in the crashing R.

Explore the amazing paleo data sets:

1 https://www.pangaea.de/

2 https://www.ncdc.noaa.gov/paleo-search/

3 https://www.neotomadb.org/

Diatoms (and their fossils) in ice-covered ocean – from microscope slides to a peer-reviewed publication

by Ben Redmond Roche

I was lucky enough to be a member of the Heikkilä Research Group during the latter half of my MSc (2018-19) and worked very closely with the sagacious diatom specialist Kaarina Weckström. My MSc project appears of interest to the wider scientific community: since our findings were accepted for publication in Marine Micropaleontology (1) in March 2020 there has been ongoing interest in the work, with 4 citations already (2-5). A year after acceptance, as of March 2021, it is still the most downloaded (within past 90 days) article from the journal! How did my project advance in practice? Why does it matter?

The research comprised re-examining 46 selected microscope slides from the North Atlantic training set (6, 7, 8), the largest and most geographically extensive diatom set in the Northern Hemisphere, in order to explore the spatial distributions of the sea-ice affiliated diatoms Fragliaropsis oceanica, Fragilariopsis reginae-jahniae and Fossula arctica (A, B & C in Fig. 1, respectively) with respect to sea-surface temperatures and sea-ice concentrations. Due to the subtle morphological differences, the previous training set and literature had grouped the three species collectively under one species name, F. oceanica.

Figure 1. 1000x magnification (A) F. oceanica (B) F. reginae-jahniae (3) F. arctica.

In paleoceanography, training sets such as the one I began exploring, are used to assess the modern relationships of microfossil species (in this case diatoms) to environmental conditions, such as sea-surface temperatures or sea-ice concentration. These species-environment relationships can then be used for reconstructing past environmental conditions from the microfossils in sediment sequences covering past millennia.

I began my research project asking: Are the distributions and thus ecologies of the three diatom species different? Does grouping the three species in the training set potentially mask the true signal of past ocean conditions in reconstructions?

Since the three species are morphologically very similar, and I spent several days training on the microscope with Kaarina learning to distinguish them from one another. The differences can be seen in Figure 1 and summarised by the following descriptions:

It took a while to gain competence on the microscope, but eventually I got my eye in and noted the fundamental differences: F. reginae-jahniae is elongated and the valves are more parallel; F. oceanica has more rounded valves; and F. arctica has the idiosyncratic circular ends. I then counted the relative abundance of the species in the 46 slides over several weeks (a good podcast is crucial when counting diatoms!). We then analysed the species-environment relationships, particularly to April sea-ice concentration (aSIC) and August sea surface temperature (aSST). The multivariate statistical analyses encompassed two aspects: a redundancy analysis (RDA), expressed as a biplot where species are plotted against the variables, and environmental response curves of the species created using R. The latter was done by Professor in Quantitative Palaeoecology Steve Juggins from Newcastle University (p.s. If you start working on quantitative reconstructions, I highly recommend the Chapter Steve wrote with John Birks in vol 5 of Tracking Environmental Change Using Lake Sediments.).

Figure 2. Geographical distributions of the species, grouped and un-grouped. Note the pan-Arctic concentration of F. oceanica compared to F. reginae-jahniae and particularly F. arctica, which is strongly related to the Northwater Polynya region.

It was apparent from the heterogeneous distributions of the species (Fig. 2) that the individual maximum abundances occurred at different aSST/aSIC. The different respective maxima are described in detail in Table 2, but the general results were: F. oceanica is not a true sea-ice species, being present in a wide range of conditions; F. reginae-jahniae has a strong relationship to high aSIC and cold conditions; F. arctica has a particularly strong relationship to high aSIC and is possibly a specialised species in polynya conditions (year-round open ocean surrounded by sea ice). The differences between the species are significant, particularly of F. reginae-jahniae and F. arctica to F. oceanica.  Therefore, separating these species during reconstructions will result in much more nuanced interpretations of palaeo-conditions, particularly of sea ice.

With sea ice declining in the Arctic (9)  and the Atlantic Meridional Overturning Circulation weakening (10) , it is imperative that high-resolution reconstructions of past rapid climate change are made from across the Arctic region to better understand what the potential implications may be. Furthermore, sea-ice affiliated algae are a crucial component of the early spring bloom, contributing for 50-60% of total primary production during the transitional phase (11, 12), with pennate diatoms often accounting for >90% of the total biomass (13); it is imperative that we learn more about these keystone species.

____

Ben is a PhD student at RHUL interested in the climatic and ecological implications of polluted sea ice.

List of references:

  1. Weckström K, Roche BR, Miettinen A, Krawczyk D, Limoges A, Juggins S, Ribeiro S, Heikkilä M., 2020. Improving the paleoceanographic proxy tool kit – On the biogeography and ecology of the sea ice-associated species Fragilariopsis oceanica, Fragilariopsis reginae-jahniae and Fossula arctica in the northern North Atlantic. Marine Micropaleontology 157:101860. https://doi.org/10.1016/j.marmicro.2020.101860.
  2. Limoges A, Weckström K, Ribeiro S, Georgiadis E, Hansen KE, Martinez P, Seidenkrantz M-S, Giraudeau J, Crosta X, Massé G, 2020. Learning from the past: Impact of the Arctic Oscillation on sea ice and marine productivity off northwest Greenland over the last 9,000 years. Global Change Biology 26:6767–6786. https://doi.org/10.1111/gcb.15334.
  3. Hernández-Almeida IKR, Bjørklund P, Diz S, Kruglikova T, Ikenoue A, Matul M, Saavedra-Pellitero N, Swanberg, 2020. Life on the ice-edge: Paleoenvironmental significance of the radiolarian species Amphimelissa setosa in the northern hemisphere, Quaternary Science Reviews 248:106565. https://doi.org/10.1016/j.quascirev.2020.106565.
  4. Armbrecht LH, 2020. The potential of sedimentary ancient DNA to reconstruct past ocean ecosystems. Oceanography 33:116-123. https://doi.org/10.5670/oceanog.2020.211.
  5. Luostarinen T, Ribeiro, S, Weckström, K, Sejr, M, Meire, L, Tallberg, P, Heikkilä, M, 2020. An annual cycle of diatom succession in two contrasting Greenlandic fjords: from simple sea-ice indicators to varied seasonal strategists, Marine Micropaleontology 158:101873. https://doi.org/10.1016/j.marmicro.2020.101873.
  6. Koç N, Jansen E, Haflidason H, 1993. Paleoceanographic reconstructions of surface ocean conditions in the Greenland, Iceland and Norwegian seas through the last 14 ka based on diatoms. Quaternary Science Reviews 12:115–140.
  7. Andersen C, Koç N, Moros M., 2004. A highly unstable Holocene climate in the sub- polar North Atlantic: evidence from diatoms. Quaternary Science Reviews 23:2155–2166. https://doi.org/10.1016/j.quascirev.2004.08.004.
  8. Miettinen A, Divine D, Husum K, Koç N, Jennings A, 2015. Exceptional ocean surface conditions on the SE Greenland shelf during the Medieval Climate Anomaly. Paleoceanography 30:1657–1674. https://doi.org/10.1002/2015PA002849.
  9. Polyakov IV, Pnyushkov AV, Alkire, MB, Ashik IM, Baumann TM, Carmack EC, Goszczko I, Guthrie J, Ivanov VV, Kanzow T, Krishfield R, Kwok R, Sundfjord A, Morison J, Rember R, Yulin A, 2017. Greater role for Atlantic inflows on sea-ice loss in the Eurasian Basin of the Arctic Ocean. Science 356:285–291. https://doi.org/10.1126/science.aai8204.
  10. Caesar L, McCarthy, GD, Thornalley DJR, Cahill N, Rahmstorf S, 2021. Current Atlantic Meridional Overturning Circulation weakest in last millennium. Nature Geoscience 14, 118–120. https://doi.org/10.1038/s41561-021-00699-z.
  11. Gosselin M, Legendre L, Therriault J-C, Demers S, Rochet M, 1986. Physical control of the horizontal patchiness of sea-ice microalgae. Marine Ecology Progress Series 29:289–298. https://doi.org/10.3354/meps029289.
  12. Fernandez-Mendez, M, Katlein, C, Rabe, B, Nicolaus, M, Peeken, I, Bakker, K, Flores, H, Boetius, A, 2015. Photosynthetic production in the Central Arctic Ocean during the record sea-ice minimum in 2012. Biogeosciences 12:3525–3549. https://doi.org/10.5194/bg-12-3525-2015.
  13. Rozańska, M, Poulin, M, & Gosselin, M., 2008. Protist entrapment in newly formed sea ice in the coastal Arctic Ocean. Journal of Marine Systems 74: 887–901. https://doi.org/10.1016/j.jmarsys.2007.11.009.

How to tend to your research (and motivation) during a pandemic: our view of the past year

by Lilia Orozco

It is almost a year since the COVID-19 pandemic spread globally, but the final repercussions for science will be realized in the years to come. Travel restrictions canceled most planned fieldwork, conferences and research visits, while social distancing changed the way we communicate, plan our activities and interact. How we, as a scientific community, confront the new circumstances has been a subject of conversation from the beginning (1-3).

On March 16, 2020, the Universities in Finland were shut down. Since then, our research group has been managing projects and thesis work from a new angle. I started my PhD research on past northern lake ecosystems in November 2020, amid the exceptional situation. I was prepared for the home office and the uncertainty in field and lab work plans. It helped me to focus on what I can do rather than what I cannot. A pandemic-suited mindset might be easy to set at the beginning of a project, but how has it been for those who made their plans prior to COVID-19? I asked our group.

Most of us had to make arrangements. Maxime Courroux, a Master’s student studying sub-arctic lakes, explains:

“A Master’s thesis is a relatively short project. But within a year, I had to change my topic, re-plan my field schedule, and manage to finish everything on time. While this wasn’t a walk in the park, the shared struggle with peers has led to a lot of support. Nothing went as expected, but it was still fun.”

For Tiia Luostarinen, PhD candidate studying microscopic sea-ice organisms, the closure of universities, and even countries, meant leaving laboratory analyses at a short notice.

“When the pandemic started to spread in Europe, I was in Denmark for some lab work but was supposed to travel back home in a couple of days anyway. When the Danish government announced that they are closing their borders, I changed my flights and returned to Finland. It was hard to miss saying proper goodbyes to everyone in Copenhagen.”

Despite the boost in discoveries and publications about and COVID-19 (4, 5) in the past year, natural sciences looking into equally topical global challenges, e.g. climate change and environmental degradation, have not had that luck (6). Restrictions have forced scientists to re-think their projects and plans. The University of Helsinki closed its facilities, but we have been able to carry out essential lab work under strict regulations.

Maija Heikkilä, the principal investigator of both currently active Academy of Finland funded projects, faces these circumstances head-on:

“Getting a research project funded is always a thrill, and in all honesty, having another research project launched during the global pandemic was equally exciting. There are new questions to be answered, new people to be hired, and due to the pandemic, new implementation plans to be made. This is much easier at the very beginning of the project than in the middle of it, but we have managed all our work rather brilliantly. Our University has been strict but prioritized science where possible.”

The University of Helsinki allowed a field trip on our Master’s level course Past environmental change in January 2021, because it was held outdoors with safe distances. Senior researcher Jan Weckström giving a demonstration on sampling methods. Maxime and Lilia were teaching assistants.

Collaboration and exchange of ideas are focal to any research. The social restrictions have forced us to use different technologies (who could have imagined the now-so-routine ZOOM coffees a year ago!). The new ways of communicating are not always ideal, in particular if you have just arrived in a new country. This is the experience of Ana Lúcia Lindroth Dauner, the new postdoc researcher in the team working on integrating and combining paleoecological data. Ana has not even met everybody in the group in person.

“Besides conciliating the time between academic and domestic work, the main issue I have had in starting to work on a project in the midst of the pandemic is the lack of personal contact. The pandemic makes it difficult to get to know new people and, therefore, to share thoughts and ideas.”

Ana shared a view to her home office.

We have all coped with the situation that started one year ago in different ways. We have had to find a balance between life and work, transform our homes into offices, and accept new realities that we did not expect. For Master’s student Meri Mäkelä, whose thesis unravels past ecosystem changes in an arctic fjord, staying motivated has helped her finish her project.

“In February 2020 I definitely couldn’t predict that after a year I would still be finishing my Master’s thesis surrounded by the pandemic. No doubt that the pandemic has slowed down my thesis project, but to be honest, my enthusiasm to left no stone unturned should be blamed more. At least I have learned to make less overly optimistic timetables for my projects to come – I hope.”

Confinement is not ideal for everyone, but after a year of this reality, we have modified our practices. Tiia has learned to appreciate the time at home.

“If you would have asked me if I liked working from home a year ago, the answer would’ve been a definite no. But this situation has at least taught me to appreciate the quietness and flexibility of working from home. And obviously, the better coffee.”

Like Tiia, Maija profits from the advantages of telecommuting and stays optimistic.

“The lack of commuting and traveling has brought a new sense of tranquility to daily work tasks and challenged me to develop new ways for team building. I am positive and face challenges that are much smaller than the responsibility of an individual to take part in fighting the global pandemic.”

Indeed, while we look forward to resuming fieldwork and in-person interaction as soon as it is safe, it is good to keep things in perspective. Despite our differing experiences and perspectives from the past year, everyone has surely mastered one thing – to adapt.

—-

Lilia Orozco is a PhD student who celebrates picking the first fossil remains in her lake sediment samples.

List of references:

  1. Clay RA (2020, March 19). Conducting research during the COVID-19 pandemic. http://www.apa.org/news/apa/2020/03/conducting-research-covid-19
  2. Pain E (2020, April 17) How early-career scientists are coping with COVID-19 challenges and fears. Science Careers.
  3. Kupferschmidt K (2020, February 26). A completely new culture of doing research. Coronavirus outbreak changes how scientists communicate. Science News
  4. Science in the Wake of the Pandemic: How Will COVID-19 Change the Way We Do Research? (2020). Molecular cell 79:9–10. https://doi.org/10.1016/j.molcel.2020.06.024
  5. Palayew A, Norgaard O, Safreed-Harmon K, Andersen TH, Rasmussen LN, Lazarus JV (2020). Pandemic publishing poses a new COVID-19 challenge. Nature Human Behaviour 4:666-9. https://doi.org/10.1038/s41562-020-0911-0
  6. Bian SX, Lin E (2020). Competing with a pandemic: Trends in research design in a time of Covid-19. Plos One 15:e0238831. https://doi.org/10.1371/journal.pone.0238831