Over the last 100 years, the sensitivity of seismic instruments has improved by many orders of magnitude.
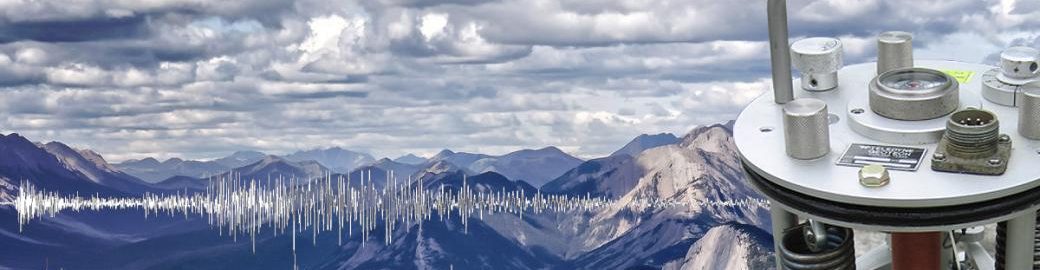
A modern seismometer, like the ones installed in the permanent monitoring network in Finland, is capable of measuring movements in the earth as small as nanometers per second (0.000000001 meters/s). Such incredible sensitivity allows seismologists at the Institute of Seismology to detect signals from earthquakes all over the world or see small explosions from mining operations in Sweden. In between earthquakes, though, there exists an entire world of signals recorded on seismometers, hidden in what we used to call “background noise.”
When Noise is not Noise
As more and more sensitive instruments were installed around the world, seismologists noticed that, instead of being quiet, the earth was constantly humming with energy. This energy was usually quieter than signals generated by earthquakes, but easily detected with high-quality instruments.
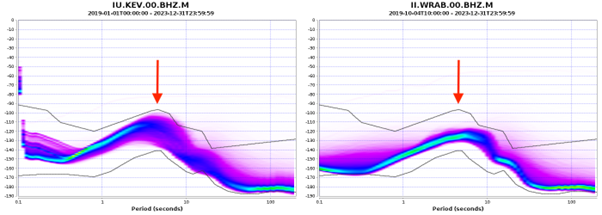
Figure 1: Energy recorded at different seismic periods over 5 years of data from station KEV in Finland and station WRAB in Australia. Peak values at periods of 3-5 seconds (red arrows) are related to energy generated by ocean waves. Plots were generated using EarthScope MUSTANG web services [1].
Air, Ice, and Rock
Other earth processes also generate signals that either older seismic equipment could not measure, or we lacked the necessary number of stations nearby, or we did not have the necessary computational power to decode the signals until recently. For example, scientists have been able to track thunderstorms moving across the southern United States [4], and calculate the strength of cyclones in the Pacific Ocean [5], using only seismic data.
As glaciers have been rapidly retreating due to climate change, seismology can also be used to detect glacial surges [6] or small caving events, even being able to determine the direction that the ice fell [7].
Seismic data is even being used to monitor for landslides in near real-time, watching for a landslide that could generate a potentially dangerous tsunami (figure 2) [8]. Monitoring for signals like these are similar in theory to how regular earthquakes are detected and located but using completely new methods to interpret the seismic data and doing it rapidly enough to potentially alert people in danger before the threat arrives.
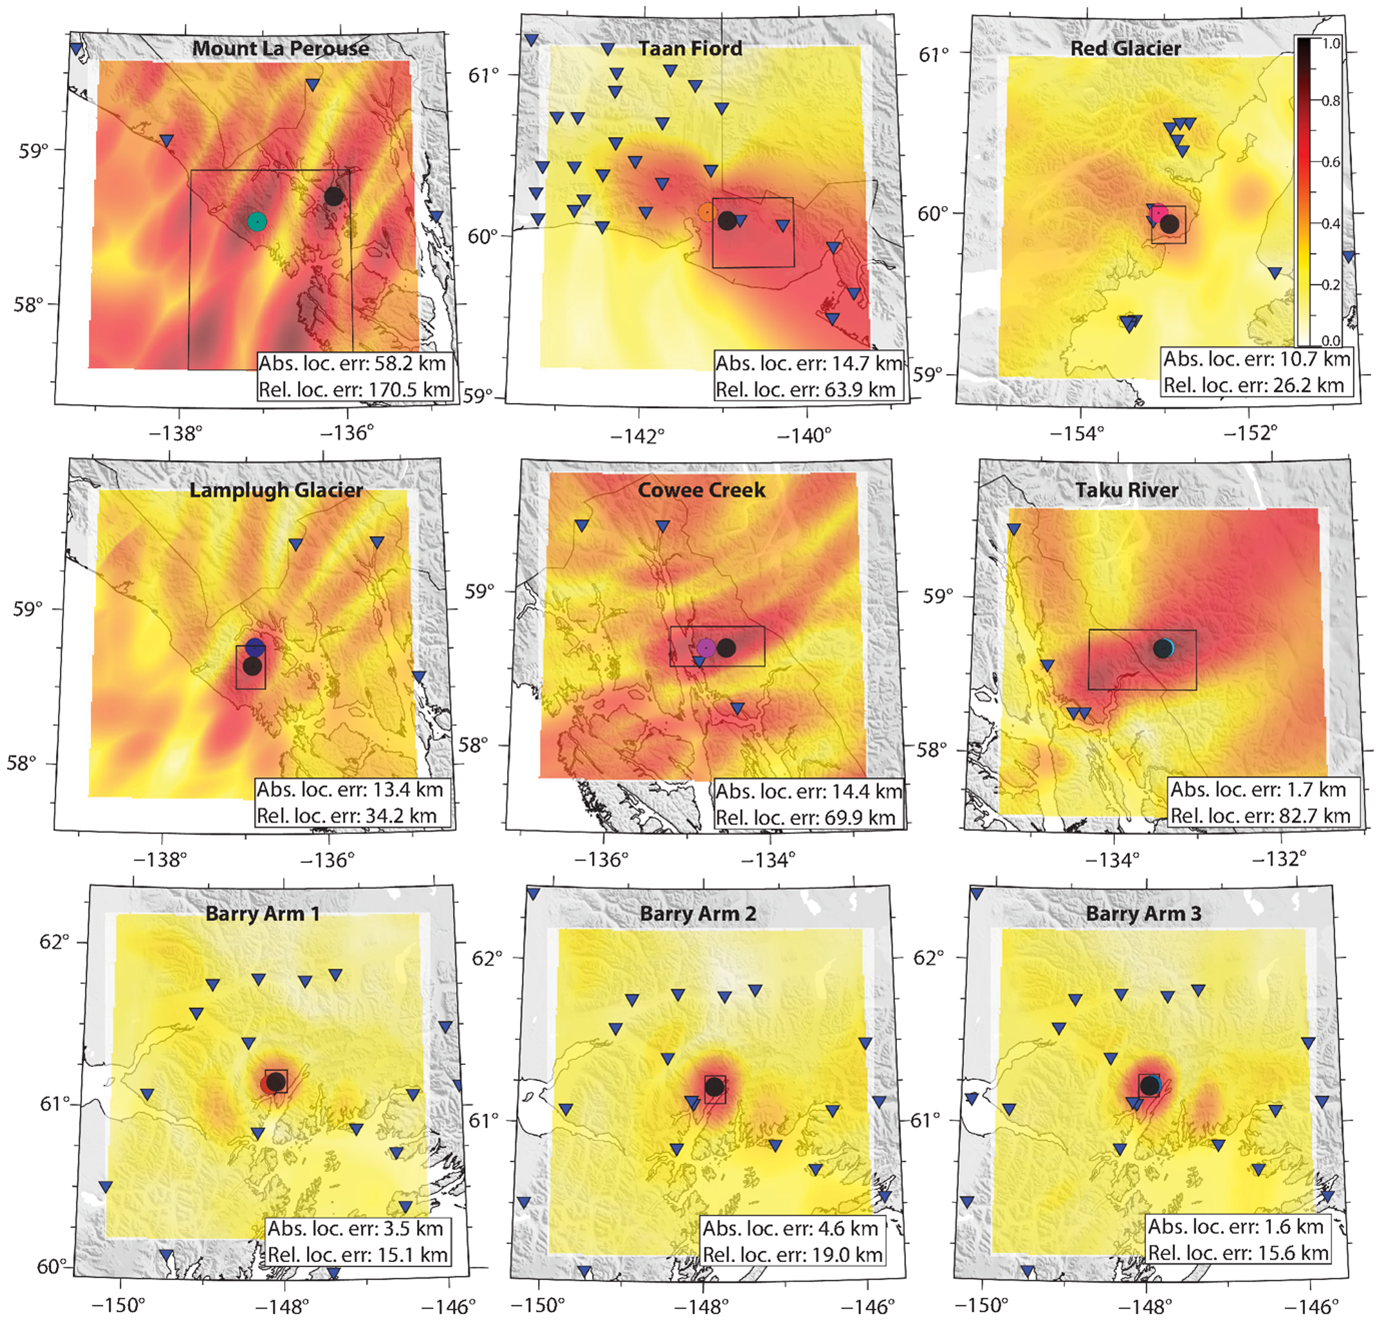
Figure 2: From Karasözen and West (2024), nine automatically detected landslides at fjords in Alaska using seismic data.
We are in an exciting era of seismology, where many of the technological limitations of previous generations have been lifted. We can use seismology to move past only monitoring for earthquakes and use the tools and our creativity to learn more about the earth system as a whole – the atmosphere, the oceans, and the rock beneath our feet.
Matt Gardine, seismologist
References
[1] Casey, Robert, Mary E. Templeton, Gillian Sharer, Laura Keyson, Bruce R. Weertman, and Tim Ahern. “Assuring the Quality of EarthScope Data with MUSTANG”. Seismological Research Letters 89 (2A) (2018): 630-639. https://doi.org/10.1785/0220170191
[2] Longuet-Higgins, Michael. S. “A theory of the origin of microseisms”. Proc. R. Soc. London Ser. A 243 (1950): 1–35.
[3] Kedar, Sharon, Michael Longuet-Higgins, Frank Webb, Nicholas Graham, Robert Clayton, and Cathleen Jones. “The origin of deep ocean microseisms in the North Atlantic Ocean”. Proc. R. Soc. London Ser. A 464 (2008): 1–35. https://doi.org/10.1098/rspa.2007.0277
[4] Tytell, Jonathan, Frank Vernon, Michael Hedlin, Catherine de Groot Hedlin, Juan Reyes, Bob Busby, Katrin Hafner, and Jennifer Eakins. “The USArray Transportable Array as a Platform for Weather Observation and Research”. Bulletin of the American Meteorological Society 97.4 (2016): 603-619. https://doi.org/10.1175/BAMS-D-14-00204.1
[5] Gualtieri, Lucia, Suzana J. Camargo, Salvatore Pascale, Flavio M.E. Pons, and Göran Ekström. “The persistent signature of tropical cyclones in ambient seismic noise”. Earth and Planetary Science Letters 484 (2018): 287-294. https://doi.org/10.1016/j.epsl.2017.12.026
[6] Nettles, Meredith, and Göran Ekström. “Glacial earthquakes in Greenland and Antarctica”. Annual Review of Earth and Planetary Sciences 38:1 (2010): 467-491. https://doi.org/10.1146/annurev-earth-040809-152414
[7] Olsen, Kira G., and Meredith Nettles. “Constraints on terminus dynamics at Greenland glaciers from small glacial earthquakes”. Journal of Geophysical Research: Earth Surface 124 (2019): 1899–1918 https://doi.org/10.1029/2019JF005054
[8] Karasözen, Ezgi, and Michael E. West. “Toward the Rapid Seismic Assessment of Landslides in Coastal Alaska”. The Seismic Record 4 (1) (2024): 43–51 https://doi.org/10.1785/0320230044