When the Earth Spins: Unraveling the Importance of Ground Rotational Motion in Seismology and Engineering

When we think of earthquakes, the first thing that comes to mind is the shaking of the ground. However, there’s more to this movement than just the back-and-forth or up-and-down motion. Ground rotational motion, the twisting and tilting of the Earth’s surface locally, plays a crucial role in understanding and preparing for seismic events.

Daily Life Examples of Rotational Motion

To make the concept of rotational motion more relatable, let’s look at some everyday examples:

  1. Spinning Top: Just like a spinning top that wobbles as it slows down, the ground can twist and turn during an earthquake.
  2. Dizzy Dance Moves: Ever tried spinning around in circles for fun? The dizzy feeling you get is a small-scale version of what happens during rotational ground motion, minus the risk of knocking over a building.

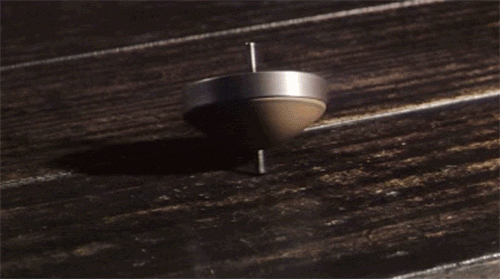
Everyday examples of the rotational motion.

These everyday activities help us visualize how the ground might move during an earthquake. Now, let’s delve deeper into what ground rotational motion is and why it’s important.

Breaking Down Ground Motion: Translation, Rotation, and the Dance of the Earth

Ground rotational motion refers to the local rotation of the ground around about the vertical and horizontal axes (we nerds call them torsion and tilt or rocking motions!). Dream about standing on a giant turntable that starts to spin; you would experience rotational motion. Similarly, during an earthquake, different parts of the ground can move in circular or twisting patterns.

Assume that you’re standing in an open field during an earthquake. Now, let’s break down what happens to the ground beneath you:

  • Translation Motion:

Imagine someone gives you a gentle push from the north. You’ll feel yourself moving southward. This movement, where the ground shifts back and forth in one direction, is translation motion. It’s like someone gently nudging you in a straight line. Similarly, another person can give you a gentle push from the east that makes you feel yourself moving westward.

  • Rotation Motion:

Now, let’s say another person starts spinning you around in a circle while you’re still being pushed from the north and east. You’re not just moving south and west anymore; you’re also spinning around. This spinning motion, where the ground twists and turns, is rotation motion. It’s like being on a spinning merry-go-round while still feeling the push from the north and east.

How do you like it so far? Doesn’t it feel like that you are in an amusement park? You already have a couple of friends pushing and spinning you in different directions. So, it doesn’t hurt to have another pushing friend! Now, let’s add another dimension:

  • Up-and-Down Motion:

While all this is happening, imagine someone else starts lifting you up and down. So not only are you being pushed south, spun around, but you’re also bobbing up and down. This up-and-down motion completes the trio of translational motions, adding depth to the movement.

So, in summary, during an earthquake, the ground can move in six different ways simultaneously: it can shift back and forth, left and right, and rise and fall (up-and-down). These three motions are called translational motion. The other three components of ground motion are rotations about the three perpendicular axes. These six motions together make up the complex movement of the ground, and understanding each component is crucial preparing for seismic events.

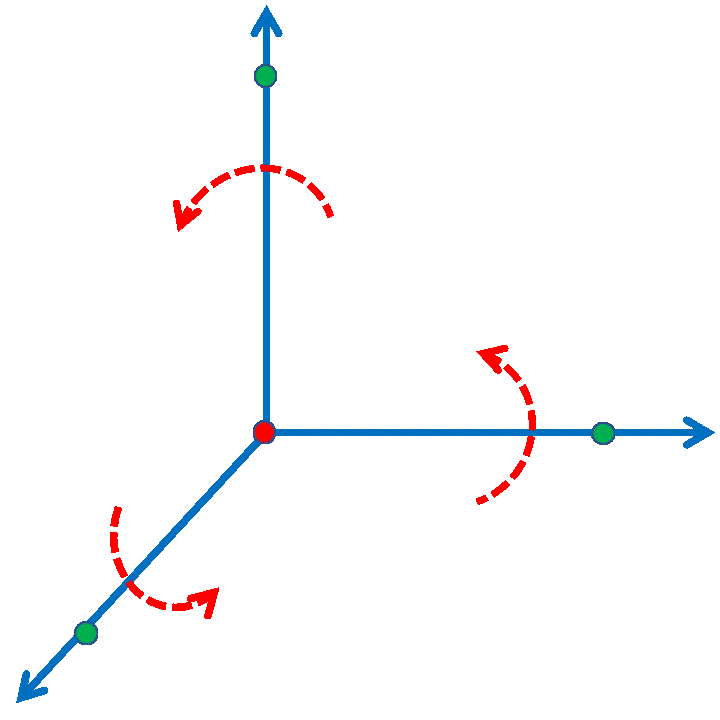
Decomposition of the ground motion to three translational and three rotational components

Why Is It Even Important?

  • Seismology

In seismology, understanding rotational motion helps in improving models of earthquake behavior. These models are used to predict how different types of ground movement, including both translational (back-and-forth) and rotational (twisting) motions, affect the Earth’s surface. By incorporating rotational motion into these models, scientists can gain a more complete understanding of ground shaking, leading to better predictions and preparedness for future earthquakes.

  • Engineering

For engineers, especially those designing buildings, bridges, and other infrastructure, knowing how structures respond to rotational motion can lead to better designs that are more resistant to earthquakes. Additionally, assessing the impact of rotational forces helps in evaluating the safety and stability of existing structures (watch this https://www.usgs.gov/media/videos/shaking-atwood-building-anchorage-alaska).

Measuring Ground Rotational Motion

Measuring rotational motion is challenging, but several techniques have been developed. These techniques can be divided into two main categories: rotational sensors and array-derived rotational motion.

  • Rotational Sensors

Rotational sensors directly measure the twisting and turning of the ground. These include gyroscopes, ring laser gyroscopes, and fiber optic gyroscopes, which detect and measure rotational movements during seismic events. These sensors provide critical data that helps in understanding the complexities of ground motion. Think of them as the seismologist’s version of a ballerina’s sense of balance—except way more precise and without the tutu.

  • Array-Derived Rotational Motion

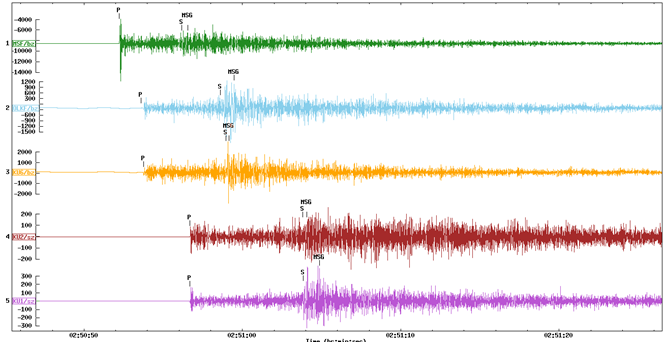
The array technique for estimation of rotational motion involves using an array of seismometers (instruments that measure ground translational motion) to infer rotational motion. By strategically placing multiple seismometers in a pattern, scientists can analyze the data from these instruments to calculate the rotational components of ground motion.

How Array Technique Works

Imagine placing several seismometers in a grid. Each seismometer records the motion of the ground at its specific location. By comparing the differences in the signals recorded by each seismometer, researchers can derive how the ground beneath the array rotates. This method is highly effective because it uses widely accessible existing technology.

Rotational Motion in Helsinki

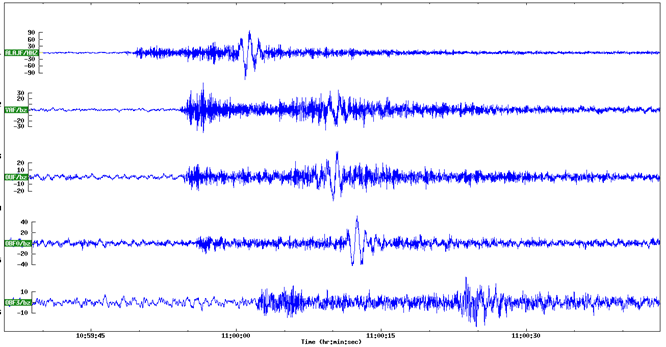
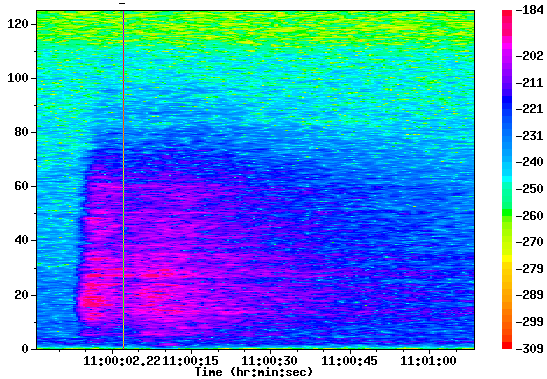
Here at the Institute of Seismology, University of Helsinki, we estimate the array-derived rotational motions about the vertical and horizontal axes for almost 500 small-magnitude seismic events that were induced by the 2018 stimulation of the Espoo/Helsinki geothermal reservoir. We process data from the six geophone arrays that were installed in the Helsinki metropolitan area. Despite the small magnitude of the earthquakes, we obtained clean rotational motion records showing the applicability of the array technique for estimating rotational motions caused by such small-magnitude earthquakes.

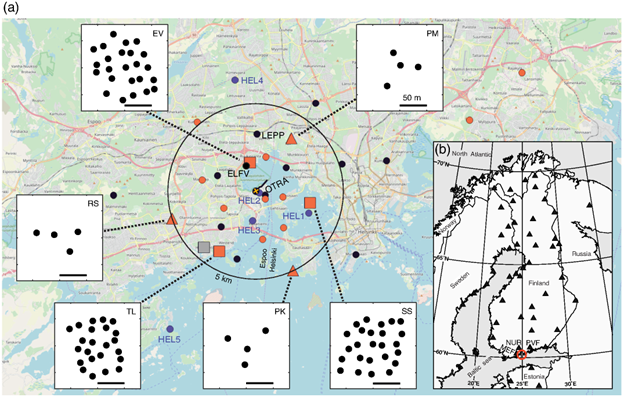
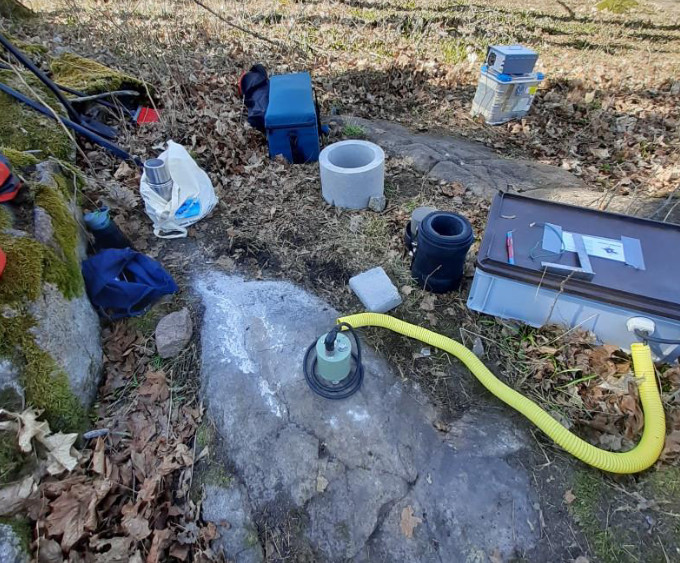
The arrays of geophones used for recording translational motions from the seismicity induced by the 2018 stimulation of the Espoo/Helsinki geothermal reservoir (read more https://doi.org/10.1785/0220190253)

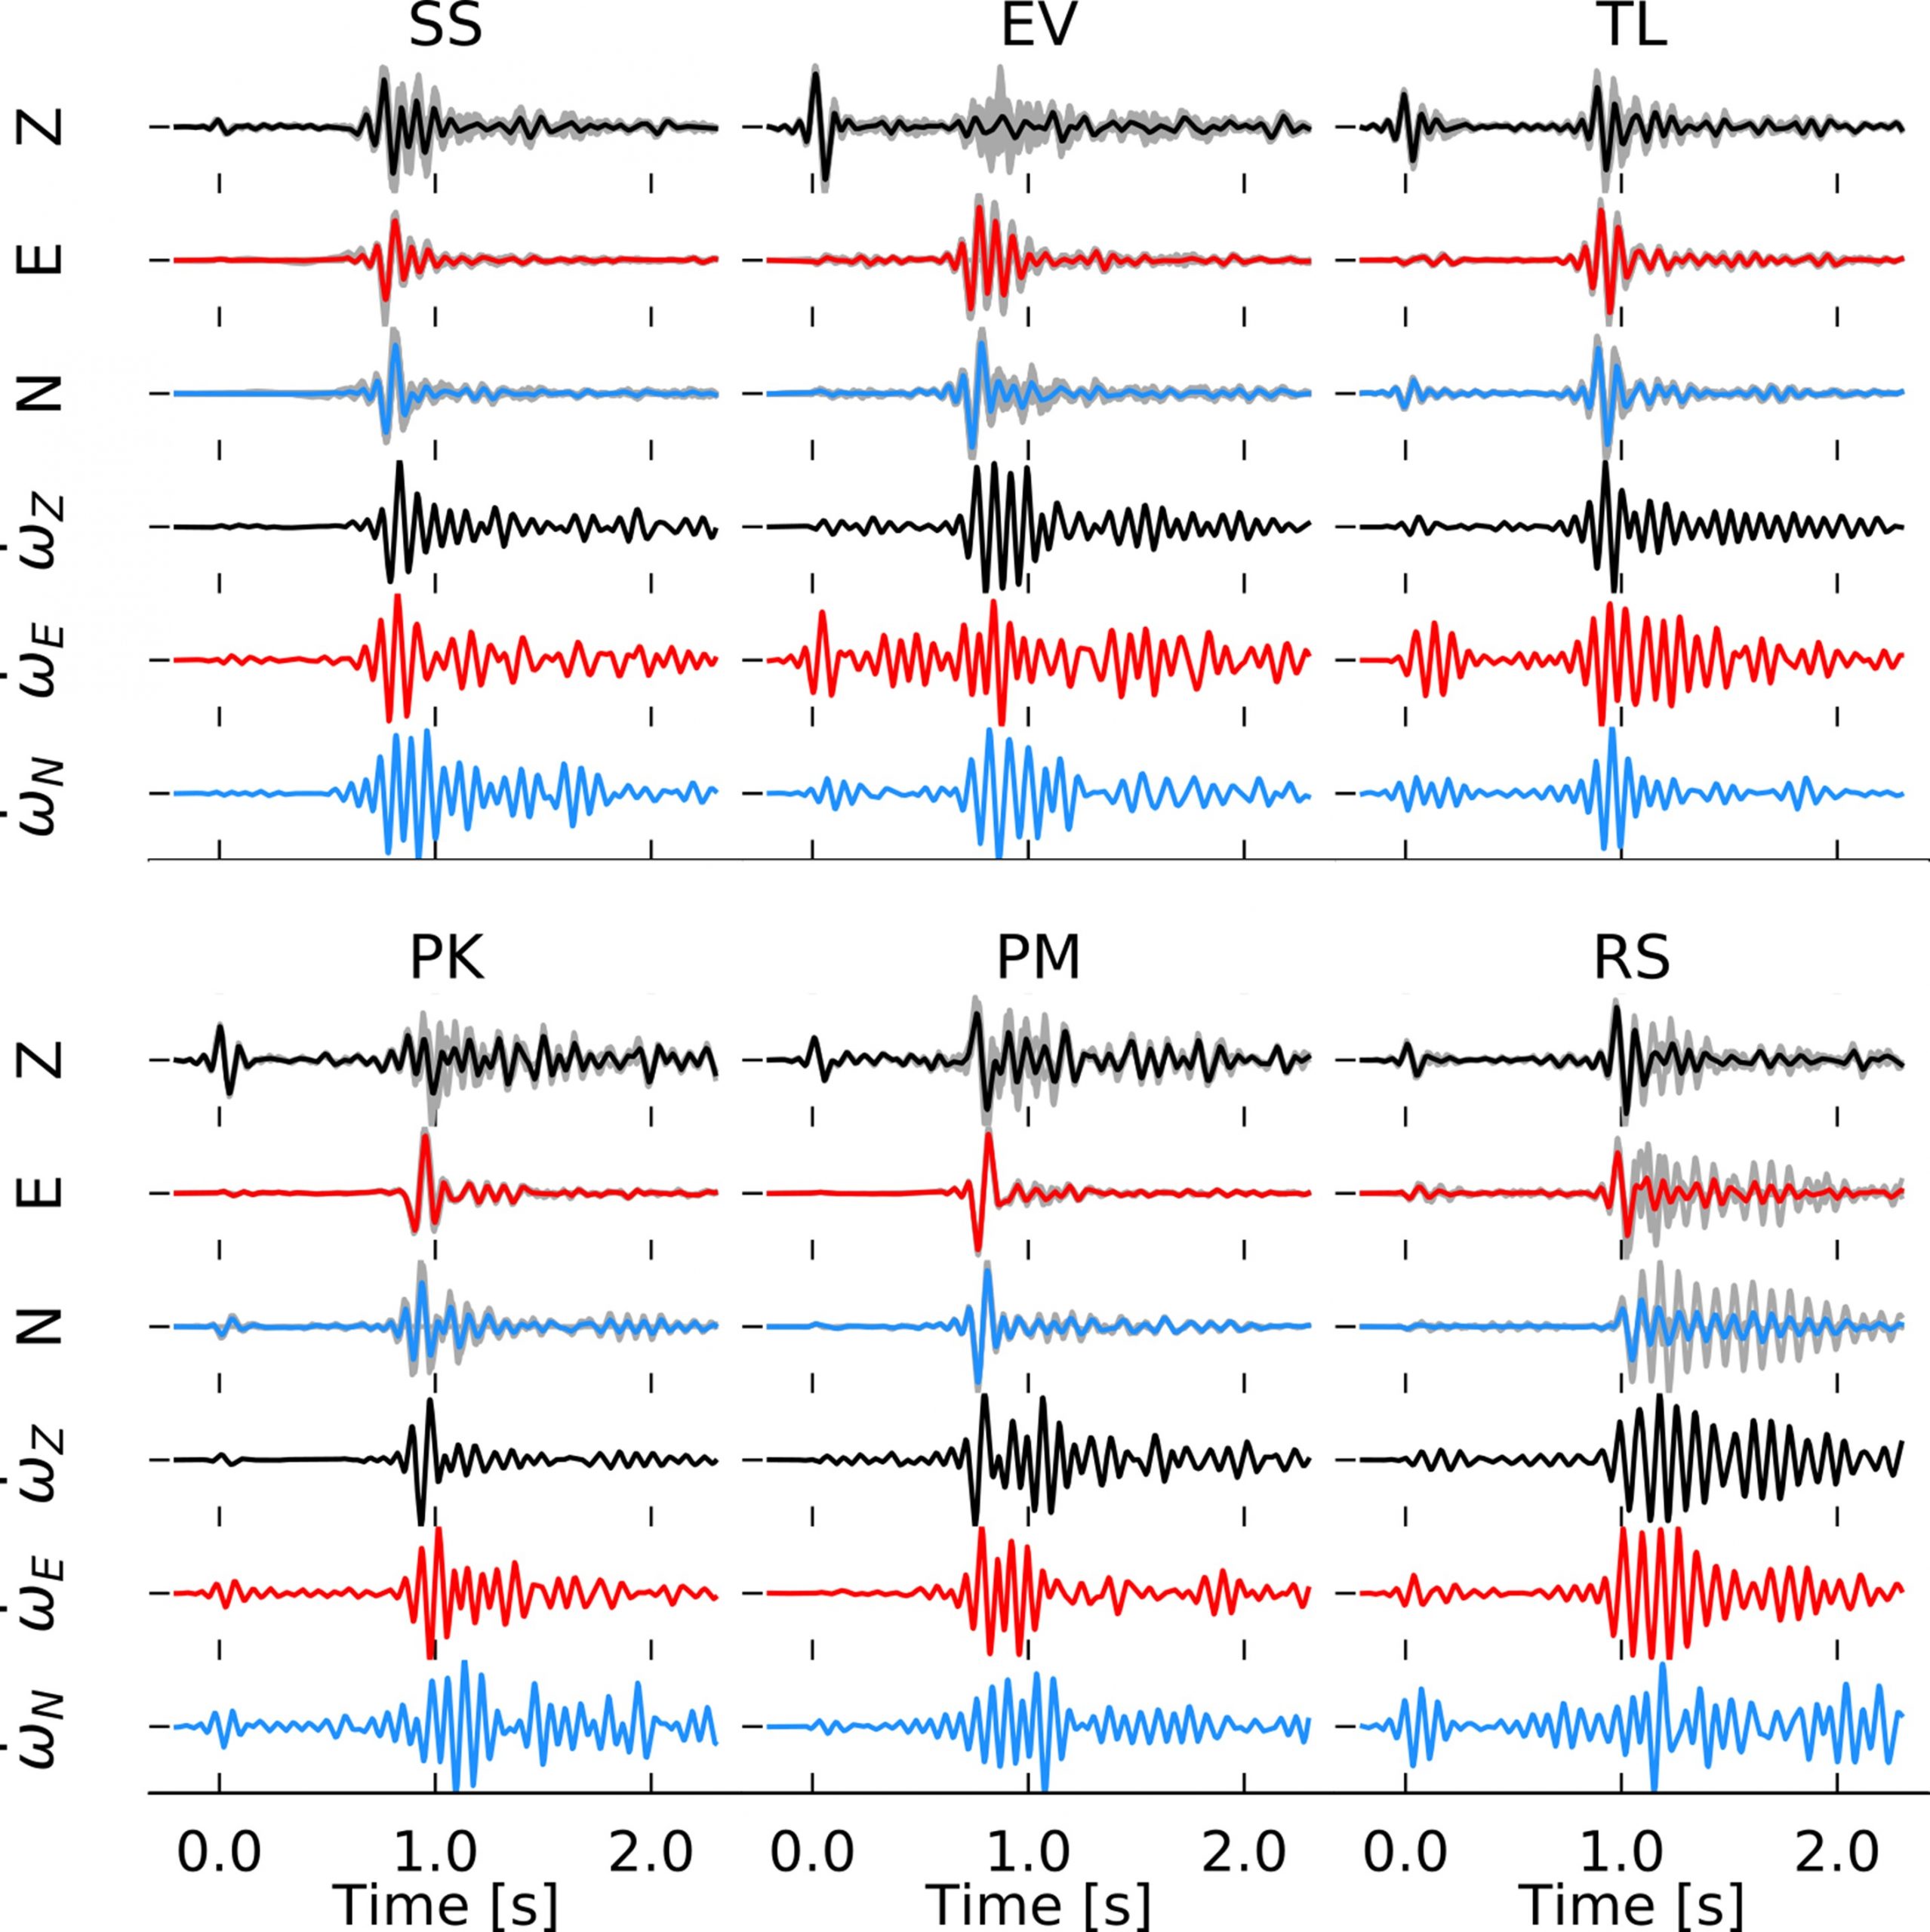
Some sample array-derived rotational motion timeseries obtained from the translational motion records (read more https://doi.org/10.1029/2020GL090403)

Amir Sadeghi-Bagherabadi, university researcher

Return of Seismic Stations to Helsinki

Helsinki Day is celebrated again on 12 June 2024 to celebrate the City of Helsinki’s birthday. Seismological observation in the City of Helsinki started a century earlier when Mainka seismographs ordered from Göttingen in Germany and received from the Finnish Science Society started their operations at the premises of the University of Helsinki Department of Physics at Siltavuorenpenger.

In seismological observations, the trend was for a long time from cities towards more trouble-free environments. It is usually easier to detect natural seismicity in Röykkä, Nurmijärvi, where seismic observation started in 1958 and continues. In Helsinki, observation ended. However, the seismic sources originating from human activities are growing in the urban environment, which interests both the city and the Institute of Seismology. Thus, in early 2019, the city approached the Institute in an effort to re-establish seismic observation stations in its area. The agreement to establish three seismic stations and a special HelsinkiNet observation network was signed in August of the same year.

After the purchase of seismic devices, the Institute of Seismology began the search for suitable station locations as soon as autumn 2019. Based on favorable observation geometry and low seismic noise, the locations were selected as the western coast of Lauttasaari, Kuninkaantammi and Kallahdenniemi. The stations are equipped with Canadian Nanometrics Centaur digitizers and Trillium Compact sensors. It is not only the direct connection of the sensor to the bedrock, but also the continuous data communication link to the Institute of Seismology with the router that is important for the most uninterrupted operation. Stations also had to be able to be placed in places protected from weather fluctuations and vandalism, either in existing buildings or in equipment shelters built for the purpose.

HelsinkiNet’s three stations KUNI, LAUT and VUOS started operating in the first half of 2020. At the same time, in western Helsinki and Espoo, a temporary seismic research network was continued, which had been established specifically for the supervision of the Espoo deep geothermal drillhole project of St1 Inc. From the stations of that network, the Seurasaari station HEL1 became part of HelsinkiNet at the beginning of 2024. In addition, in May 2021, HelsinkiNet grew with the RSUO station, intended for the supervision of the Ruskeasuo geothermal heat plant project of Helen Inc. The network now includes five seismic stations, the data of which is utilized in the Institute’s daily analysis. All the HelsinkiNet stations are part of the Institute’s national seismic station network.

Test measurements in the city's winter garden did not eventually lead to the establishment of a station in the area.

Test measurements in the city’s winter garden did not eventually lead to the establishment of a station in the area.

Most of the observations of HelsinkiNet stations have been explosions of quarries and construction sites. Every year of the network’s operations there have also been natural or human-induced earthquakes. The increasing use of geothermal heat production with the help of shallow and medium-deep heat wells is linked to the carbon neutrality target set by the City of Helsinki in 2035 and emphasizes the importance of the station network due to the seismic risk associated with the heat production. At times, even distant events have been discovered in data, such as the Taiwan earthquake on 3 April 2024.

Under the agreement between the Institute of Seismology and the City of Helsinki, the Institute publishes a public report on the activities and observations of HelsinkiNet annually. The report is mainly in Finnish. All reports can be read in the Helda publication archive and the latest of them can be found here.

Toni Veikkolainen, seismologist

Natural disaster warning system (LUOVA)

The LUOVA system is a service intended for authorities. It warns about natural disasters that take place in Finland and abroad. LUOVA was established after the earthquake and tsunami disaster that occurred on Boxing Day 2004 in Asia. The system’s aim was to improve and clarify communication related to natural disasters. Institute of Seismology provides information and assessments of hazardous impacts of earthquakes to the LUOVA system.

Structure and functioning of LUOVA

The LUOVA system gathers forecasts, assessments, and warnings from various sources, and creates a real-time situational picture to support the decisions of the authorities. The basis of LUOVA is an information system that enables research institutes to monitor different natural phenomena worldwide and analyze threats, risks, and actual natural disasters. LUOVA offers a uniform reporting method for all types of warnings – one, fast channel in which authorities find the necessary information about natural disasters.

The LUOVA operation center is located at the Finnish Meteorological Institute (FMI) together with the on-call weather services. Experts deliver real-time reviews on natural disasters to the LUOVA web portal. Information providers of LUOVA are Finnish Meteorological Institute (dangerous weather phenomena, sea floods, tsunamis), SYKE (water floods) and the Institute of Seismology (earthquakes, tsunamis).

Earthquake observations in LUOVA

Institute of Seismology provides information and assessments of hazardous impacts of earthquakes to the LUOVA system. The focus is on hazardously big earthquakes abroad mainly at the tourist but also at high-risk destinations, but authorities are also informed about notable earthquakes in Finland. The earthquake alerts and estimates of the LUOVA are based on the Institute’s automatic observation system and on the on-call duty related to it. The on-call seismologist gets information on earthquakes primarily from the SeisComP-based automated system. More information on the events can be found on the websites of international organizations and centers, and on their warning messages.

The on-call seismologist checks, evaluates, and corrects automatic alerts. The risk of the event is assessed, and the event is classified into risk categories 1-4 (1 = extremely dangerous, 2 = dangerous, 3 = potentially dangerous, 4 = not dangerous). The on-call seismologist provides an impact assessment with a more detailed description of the possible consequences for the risk categories 1 to 3 events via the LUOVA system to the authorities. In addition, on-call seismologists will provide an expert opinion and assistance in issuing warnings and assessing the effects of damage, if necessary.

In 2023, 296 events came to the LUOVA system. Of these, 237 were evaluated as risk category 4 events, 51 risk category 3 events, 6 risk category 2 events and 2 risk category 1 events.

Assessment of effects caused by earthquakes

The magnitude of an earthquake and the earthquake effects and consequences are not directly interdependent. When assessing the destructive effects, without direct observations from the event area, priority is given to the magnitude of the earthquake (released energy, destructive power) as well as to the depth of the earthquake (surface waves, tsunami) and the location of the earthquake (centers of population, age and condition of buildings, critical infrastructure). That is, even a small earthquake (magnitude 4-5) occurring at shallow depth below a large population center can cause great damage. On the other hand, a large earthquake (magnitude 6 – 7) in the middle of the wilderness or ocean may not attract any attention (other than that it is detected by the global seismic station network).

Tsunamis relate to large earthquakes (typically above magnitude 7) that occur on the seabed due to vertical movement. Therefore, tsunamis are most commonly generated in subduction zones. Tsunami is different from wind-generated waves in such a way that it puts in motion the sea water in motion at its entire depth, while the effect of wind-generated waves is limited to the surface layer. Tsunami wavelengths and speeds are also significantly higher. The LUOVA on-call seismologist will also issue a warning in connection with the impact assessment if a tsunami can arise from an earthquake.

Recent earthquakes globally can be found on the Institute’s website (https://www.helsinki.fi/en/institute-seismology/earthquakes/earthquakes-globally).

Niina Junno, seismologist

Daily analysis of seismic events investigates the sources of seismic signals

The Institute of Seismology frequently receives inquiries from the media and citizens about various shaking observations.

The Institute has several channels to report or send inquiries on these observations. In addition to calling the info-phone of the Institute of Seismology, you can send an email or fill out an observation form on our website. Links and other contact information can be found on the Institute’s website. Every observation will be examined, and if necessary, we will carry out an analysis of the event. An explanation cannot always be found simply by looking seismograms, as some of the event sources are very weak and local. In these cases, only a very close seismic station can detect the signal. On the other hand, the source may be elsewhere than in bedrock, for example, an air-borne pressure wave can also cause windows to vibrate.

Based on the observation sent to us, we check the data from the nearest seismic stations for the time indicated. If the seismic event is strong enough, it may already be visible on our website “Seismic bulletins” where you can find “Local explosions and earthquakes today“. This page contains a map and a list of seismic events automatically detected and located by our software system. Because it is an automated list, i.e. a person has not checked it, the locations can be inaccurate at times, and there may even be incorrect events when the software combines signal peaks caused by frost, for example.

An analyst, i.e. a seismic data analyzer, searches for data from seismic stations at the requested observation time. Data is searched for a possible seismic event, the source of which is usually an explosion or an earthquake, but sometimes cave-in, landslide or frost quake can cause a signal. The first signal is marked as the longitudinal wave or P wave, and a slightly slower wave is marked as transverse wave or S wave. When these waves have been determined for several seismic stations, the difference in the velocity between P and S waves can be used to calculate the distance between the source and the station, and the source of the signal is likely to be found at or near the intersection of these distances. The more seismic stations are available around the source, the more precise location can be determined for the event. For example, seismic events in Finland tend to be located closer to the real source than seismic events outside Finland.

The analyst will also try to determine the seismic event mechanism as best as possible. Most seismic events observed in Finland (about 18,000 per year) are explosions at mines, quarries or construction sites. Explosions in mines and quarries are typically made as a series of multiple blasts, where bets are placed at certain distances from each other and are detonated with a slight delay. For explosions such as these, the signal is characterized by a steady distribution of energy in all directions and the typical waveforms generated by different blasting techniques (Figure 1). The explosions aim to dampen some energy frequencies and typically form a striped pattern in energy spectra (Figure 2).

Figure 1. Typical signal from an explosion observed in seismograms.

Figure 2. Typical striped energy distribution caused by an explosion. The left vertical axis denotes frequency, and the color scale describes the signal strength (i.e. the amount of energy). The image shows the OUF station’s observation of the explosion at Kaustinen.

However, with earthquakes, energy is distributed in different directions depending on the type of movement in the bedrock that caused the signal (Figure 3). In the energy spectra of the earthquake, energy has been distributed evenly across all frequencies, especially at closer seismic stations (Figure 4). A small seismic event, overlying locations, or duplication of another seismic event can make it more difficult to determine the source.

Figure 3. Earthquake happened in Kuusamo on 2 May 2024. Figure shows registrations from different seismic stations in Finland.

Figure 4. The energy distribution produced by the Kuusamo quake (from MSF station) is characteristic of the earthquake. The left vertical axis denotes frequency, and the color scale describes the signal strength (i.e. the amount of energy).

Finally, the analyst determines the magnitude of the event by measuring the amplitude of the strongest signal at different stations, from which the local magnitude is calculated to the seismic event. Once all parameters have been obtained, the result will be published on our website. Earthquakes are immediately visible through an earthquake search. In addition, earthquakes will appear within a few working days after the remaining seismic events of that day have been analysed, “Seismic bulletins” from the tab “Analyst-reviewed bulletins” of the page “daily bulletins of seismic events in Northern Europe” with explosions and other seismic events.

Kati Oinonen, seismologist

Environmental Seismology – Monitoring More than Earthquakes

Over the last 100 years, the sensitivity of seismic instruments has improved by many orders of magnitude.

A modern seismometer, like the ones installed in the permanent monitoring network in Finland, is capable of measuring movements in the earth as small as nanometers per second (0.000000001 meters/s). Such incredible sensitivity allows seismologists at the Institute of Seismology to detect signals from earthquakes all over the world or see small explosions from mining operations in Sweden. In between earthquakes, though, there exists an entire world of signals recorded on seismometers, hidden in what we used to call background noise.”

When Noise is not Noise

As more and more sensitive instruments were installed around the world, seismologists noticed that, instead of being quiet, the earth was constantly humming with energy. This energy was usually quieter than signals generated by earthquakes, but easily detected with high-quality instruments.

Figure 1: Energy recorded at different seismic periods over 5 years of data from station KEV in Finland and station WRAB in Australia. Peak values at periods of 3-5 seconds (red arrows) are related to energy generated by ocean waves. Plots were generated using EarthScope MUSTANG web services [1].

Figure 1 [1] shows the energy recorded at two different seismometers over 5 years. Station KEV is located near the village of Kevo in Lapland, and station WRAB is in central Australia. Even though they are in two very different places geologically, the energy pattern looks quite similar, with a peak of energy around 3-5 seconds period (0.2-0.33 Hz in frequency). This energy pattern is seen every day, on nearly every seismic station on earth, and while scientists long suspected that this noise is coming from waves interacting in the oceans [2], it was only recently that this was able to be accurately verified [3].

Air, Ice, and Rock

Other earth processes also generate signals that either older seismic equipment could not measure, or we lacked the necessary number of stations nearby, or we did not have the necessary computational power to decode the signals until recently. For example, scientists have been able to track thunderstorms moving across the southern United States [4], and calculate the strength of cyclones in the Pacific Ocean [5], using only seismic data.

As glaciers have been rapidly retreating due to climate change, seismology can also be used to detect glacial surges [6] or small caving events, even being able to determine the direction that the ice fell [7].

Seismic data is even being used to monitor for landslides in near real-time, watching for a landslide that could generate a potentially dangerous tsunami (figure 2) [8]. Monitoring for signals like these are similar in theory to how regular earthquakes are detected and located but using completely new methods to interpret the seismic data and doing it rapidly enough to potentially alert people in danger before the threat arrives.

Figure 2: From Karasözen and West (2024), nine automatically detected landslides at fjords in Alaska using seismic data.

We are in an exciting era of seismology, where many of the technological limitations of previous generations have been lifted. We can use seismology to move past only monitoring for earthquakes and use the tools and our creativity to learn more about the earth system as a whole – the atmosphere, the oceans, and the rock beneath our feet.

Matt Gardine, seismologist

References

[1] Casey, Robert, Mary E. Templeton, Gillian Sharer, Laura Keyson, Bruce R. Weertman, and Tim Ahern. “Assuring the Quality of EarthScope Data with MUSTANG”. Seismological Research Letters 89 (2A) (2018): 630-639. https://doi.org/10.1785/0220170191

[2] Longuet-Higgins, Michael. S. “A theory of the origin of microseisms”. Proc. R. Soc. London Ser. A 243 (1950): 1–35.

[3] Kedar, Sharon, Michael Longuet-Higgins, Frank Webb, Nicholas Graham, Robert Clayton, and Cathleen Jones. “The origin of deep ocean microseisms in the North Atlantic Ocean”. Proc. R. Soc. London Ser. A 464 (2008): 1–35. https://doi.org/10.1098/rspa.2007.0277

[4] Tytell, Jonathan, Frank Vernon, Michael Hedlin, Catherine de Groot Hedlin, Juan Reyes, Bob Busby, Katrin Hafner, and Jennifer Eakins. “The USArray Transportable Array as a Platform for Weather Observation and Research”. Bulletin of the American Meteorological Society 97.4 (2016): 603-619. https://doi.org/10.1175/BAMS-D-14-00204.1

[5] Gualtieri, Lucia, Suzana J. Camargo, Salvatore Pascale, Flavio M.E. Pons, and Göran Ekström. “The persistent signature of tropical cyclones in ambient seismic noise”. Earth and Planetary Science Letters 484 (2018): 287-294. https://doi.org/10.1016/j.epsl.2017.12.026

[6] Nettles, Meredith, and Göran Ekström. “Glacial earthquakes in Greenland and Antarctica”. Annual Review of Earth and Planetary Sciences 38:1 (2010): 467-491. https://doi.org/10.1146/annurev-earth-040809-152414

[7] Olsen, Kira G., and Meredith Nettles. “Constraints on terminus dynamics at Greenland glaciers from small glacial earthquakes”. Journal of Geophysical Research: Earth Surface 124 (2019): 1899–1918 https://doi.org/10.1029/2019JF005054

[8] Karasözen, Ezgi, and Michael E. West. “Toward the Rapid Seismic Assessment of Landslides in Coastal Alaska”. The Seismic Record 4 (1) (2024): 43–51 https://doi.org/10.1785/0320230044

About timescales in seismology

Finland’s first seismograph began operating in Helsinki a hundred years ago. It is a milestone worth noticing and a long time for humans.

However, one hundred years is a brief time to collect evidence of earthquakes. In many regions, no strong earthquake has occurred in over a century, and even in regions with recent large earthquakes, a century is too brief to properly assess the long-term seismic hazard of the region. Although seismologists generally do not work on geological timescales spanning up to millions to billions of years, their work does include extending the series of earthquake observations as far back in the past as possible and forward into the future.

Earthquakes in the distant past can be investigated by using non-instrumental seismological methods. The likelihood of a strong earthquake occurring goes up the longer the time of observation is. The price of looking very far back, however, is an increase in uncertainty about the earthquake size – but there are ways of using available evidence to model sizes of earthquakes in the past.

Before measuring devices became common, the impacts of earthquakes could be observed directly by the naked eye. Especially after earthquakes caused damage, people have written documents about the event for authorities and other contemporaries, and sometimes also for scientific purposes. The most reliable of these reports are from eyewitness accounts. In the best cases, detailed written records have survived to modern times and been found by researchers. Through modern research methods, the seismic history of a target location showing how often strong earthquakes have occurred and how those earthquakes have impacted society over the centuries, or a couple of millennia in some parts of the world, can be extracted.

The geological traces left by strong earthquakes in the natural environment can go back to at least ten thousand years ago. The suddenness and violence of the earthquake remains as displacement movements, subsidence or rise of the ground compared to the environment, old landslides, and ancient water paths in the soil. The location and timing of these traces adds information about the frequency of strong earthquakes. Searching the landscape for evidence of large earthquakes is called paleoseismology.

The Fennoscandian Shield in Northern Europe has ancient bedrock and is seismically relatively quiet. There are written records of earthquake effects as far north as Lapland for almost three centuries and in the south for a slightly longer time. At the end of the last Ice Age, the retreat of the ice mass changed the stress conditions of the earth’s crust, causing strong earthquakes associated with several southwest-northeast trending fault escarpments in northern Fennoscandia. They have been dated to about 9–11 thousand years ago.

In the 2000s, high-resolution LiDAR (Light Detection and Ranging)-images, trenching, and seismic reflection campaigns have advanced paleoseismology in Fennoscandia. Traces of paleoearthquakes have been identified in lake sediments in the south. It has been proposed that paleoseismicity had three maxima in the Finnish territory around 10-12 thousand years ago, 5-7 thousand years ago, and 1.5-3 thousand years ago. The highest magnitude earthquakes, likely around Mw7 and above, were associated with the oldest earthquakes, and lower magnitudes (around Mw6) with the younger events (https://doi.org/10.1016/j.tecto.2019.228227). Traces of strong earthquakes 700–4000 years ago have been reported from the Stuoragurra postglacial fault in northern Norway(https://doi.org/10.1017/9781108779906.015). What is special is their size range – up to magnitude 7 – which challenges the old notion that the strongest earthquakes occurred relatively shortly after the Ice Age.

Knowing the seismicity of the past is critical in assessing the seismic risk in the near future. Because we cannot predict exactly when and where an earthquake will occur, probabilites must be used. The usual way of talking about seismic risk is that an earthquake of a given size or a given ground motion occurs in a target area with a given probability in 30 or 50 years. This 30-to-50-year period is related to construction and engineering building codes, and the hazard maps are aimed at ensuring that appropriate seismic building codes are used so that strong ground movements do not damage buildings and society’s infrastructure.

Seismologists therefore have at their disposal a catalog of instrumental measurements from the last 100 years or so, and usually a longer period of non-instrumental observations. Combined, these give seismologists the best data available for working with engineers to plan for the strong earthquakes that will inevitably occur in the future.

Päivi Mäntyniemi, University Researcher

The Finnish mobile seismic instrument pool

Seismologists are scientists who study the earth, from the surface to the core, using physics theories combined with observations from seismic waves travelling through the planet. These observations are required to better understand earthquakes, faults, volcanoes, seismic hazards, landslides, and earth structures, as well as for economic applications such as identifying subsurface mineral or petroleum deposits.

Seismometers are the primary instrument needed to make these observations and so seismologists rely on the availability of these extremely sensitive instruments. In recent years, the production of more cost-effective sensors and access to large-scale data storage and computational facilities has led to an evolution in the number of seismometers used in seismic studies. However, individual sensors are generally too expensive for individual researchers to purchase and operate and thus have been restricted to large private companies or through well-funded but restricted government research consortiums.

To help the access to such equipment to the scientific community, the Finnish mobile seismic instrument pool was created in 2021. It is owned and operated by seven Finnish academic and research institutions: the University of Helsinki, the University of Oulu, the Geological Survey of Finland, the National Land Survey, Aalto University, the Technical Research Center of Finland and the University of Turku. The pool is funded through the Research Council of Finland call for research infrastructures (FIRI),. through the FLEX-EPOS project, under the FIN-EPOS* umbrella.

The initial funding for the project was started in 2021, with the instrument pool build-up phase ending in 2024. After that, the pool will continue to operate indefinitely. By the end of 2024, the pool is expected to include 46 Güralp broadband seismometers and 5 Güralp strong-motion accelerometers, as well as 1229 Geospace and 71 SmartSolo self-contained geophone units. When complete, this pool represents one of the largest mobile seismic instrument pools in Europe available in the public sector.

The pool is made available to researchers and supports domestic and international collaborative projects that enhance data-driven subsurface and environmental applications. Projects can last a few days up to a few years.

Between October 2021 and December 2023, 30 projects have been completed using the pool , generating around 28TB of data – equivalent to 280 Helsinki central libraries Oodi. These projects have helped seismologists further study diverse topics such as ground water, faults, frost quakes, ore bodies, crustal structure and local sedimentary overburden, with many more to come.

If you want to know more, you can check the FLEX-EPOS and seismic instruments wikipage: https://wiki.helsinki.fi/xwiki/bin/view/FLEX/Flex-epos%20Home/#. The pool will also be presented through a poster at the EGU24 meeting (14-19.4.2024), hall X1 at board number X1.120.

Roméo Courbis, University Researcher


FLEX-EPOS is funded through the Research Council of FInland FIRI2019 call (funding decisions no. 328984, 328776, 328778-328782, 328784 and 328786).

*FIN-EPOS is a Finnish national node of EPOS (European Plate Observing System).

100 years of seismological measurements in Finland

This year marks the 100th anniversary of seismological measurements in Finland.

In honor of the anniversary, the researchers of the Institute of Seismology publish a biweekly blog on a current or otherwise interesting topic related to seismology and research conducted in the institute. I have the honor to start the blog series by introducing the activities of the institute in general.

Seismological observation began in Finland in 1924, when the Finnish Society of Sciences and Letters donated the first seismograph to the University of Helsinki.. A seismograph is a device used to measure the vibrations of the earth’s crust. In 1961, almost 40 years after donation of first seismograph, the Institute of Seismology was founded. The foundation of the Institute was driven by an increasing need for seismic monitoring because of the Soviet Union’s nuclear tests on Novaya Zemlya. Nuclear tests, like other explosions, cause seismic waves that propagate through the earth’s crust like earthquakes. Explosions and earthquakes are typically easy to distinguish from each other based on the waveform, as the generation mechanisms of these events are physically different. In an explosion, the energy travels uniformly in all directions from a point source, while the wave front caused by an earthquake is asymmetrical. In the explosion recordings, the first ground motion is always upward, regardless of the seismograph’s location. In an earthquake, on the other hand, the different sides of the fault zone move relative to each other, as a result of which the ground movement can be either up or down, depending on the position of the seismograph in relation to the origin of the earthquake, the epicenter. The current global network of seismographs enables the detection of seismic events with a magnitude greater than 3.5 all around the world, so monitoring underground nuclear tests using seismological methods is also effective. Due to its location, Finland is an important part of seismic monitoring.

Finland’s seismic network currently includes more than 40 permanent stations around the country. In addition, the Institute of Seismology uses data from the stations maintained by the Sodankylä Geophysical Observatory in Northern Finland. With the help of the seismic network, we can detect and locate significant earthquakes around the world. The Institute of Seismology delivers earthquake warnings to the Natural Disasters Warning System (LUOVA). In particular, we inform the authorities about large earthquakes that may have caused severe damage to populated areas. Earthquakes that occur under the sea are analyzed quickly and accurately because of the tsunami danger. In addition to global cases, the national network also monitors the seismicity of our nearby areas. In Finland, earthquakes are small, but especially in the Rapakivi areas in Kymenlaakso and Åland, as well as in the Kuusamo area, earthquakes are relatively common. The Institute of Seismology receives observations of earthquakes from citizens every year, which are often confirmed to be correct by analysis of the recorded seismic data.

In addition to maintaining and developing the national seismic network, the Institute of Seismology conducts research on earth structures using seismic methods. The velocity of seismic waves depends on the properties of the medium, and seismic waves are reflected, refracted and scattered from different interfaces of the subsurface, such as when the rock type changes or from fracture zones. An interpretation of the structures of the subsurface can be formed by registering the ground movement caused by seismic waves with tens, hundreds or even thousands of measuring devices. In seismic reflection soundings, the object of interest is typically the interface between bedrock layers, while in refraction sounding and tomography studies, information is obtained about the composition of the bedrock.

In the following blogs, different researchers will take a closer look at interesting seismological themes and talk about, for example, earthquakes related to postglacial faults, the history and operating principle of seismographs, environmental seismology, the International Nuclear Test Ban Treaty, seismicity in Finland and historically significant earthquakes. So, stay tuned!

Suvi Heinonen, director