Category Archives: seismic observatory

Return of Seismic Stations to Helsinki

Helsinki Day is celebrated again on 12 June 2024 to celebrate the City of Helsinki’s birthday. Seismological observation in the City of Helsinki started a century earlier when Mainka seismographs ordered from Göttingen in Germany and received from the Finnish Science Society started their operations at the premises of the University of Helsinki Department of Physics at Siltavuorenpenger.

In seismological observations, the trend was for a long time from cities towards more trouble-free environments. It is usually easier to detect natural seismicity in Röykkä, Nurmijärvi, where seismic observation started in 1958 and continues. In Helsinki, observation ended. However, the seismic sources originating from human activities are growing in the urban environment, which interests both the city and the Institute of Seismology. Thus, in early 2019, the city approached the Institute in an effort to re-establish seismic observation stations in its area. The agreement to establish three seismic stations and a special HelsinkiNet observation network was signed in August of the same year.

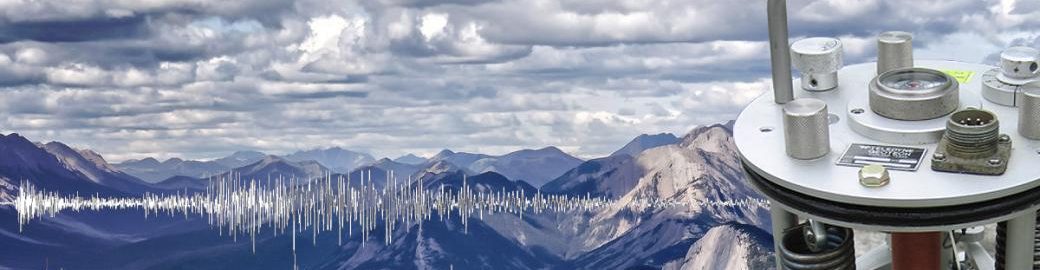
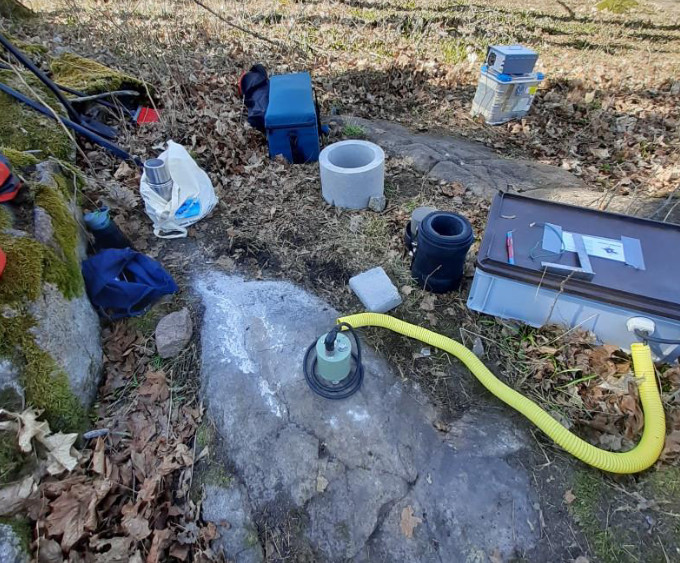
After the purchase of seismic devices, the Institute of Seismology began the search for suitable station locations as soon as autumn 2019. Based on favorable observation geometry and low seismic noise, the locations were selected as the western coast of Lauttasaari, Kuninkaantammi and Kallahdenniemi. The stations are equipped with Canadian Nanometrics Centaur digitizers and Trillium Compact sensors. It is not only the direct connection of the sensor to the bedrock, but also the continuous data communication link to the Institute of Seismology with the router that is important for the most uninterrupted operation. Stations also had to be able to be placed in places protected from weather fluctuations and vandalism, either in existing buildings or in equipment shelters built for the purpose.

HelsinkiNet’s three stations KUNI, LAUT and VUOS started operating in the first half of 2020. At the same time, in western Helsinki and Espoo, a temporary seismic research network was continued, which had been established specifically for the supervision of the Espoo deep geothermal drillhole project of St1 Inc. From the stations of that network, the Seurasaari station HEL1 became part of HelsinkiNet at the beginning of 2024. In addition, in May 2021, HelsinkiNet grew with the RSUO station, intended for the supervision of the Ruskeasuo geothermal heat plant project of Helen Inc. The network now includes five seismic stations, the data of which is utilized in the Institute’s daily analysis. All the HelsinkiNet stations are part of the Institute’s national seismic station network.

Test measurements in the city's winter garden did not eventually lead to the establishment of a station in the area.

Test measurements in the city’s winter garden did not eventually lead to the establishment of a station in the area.

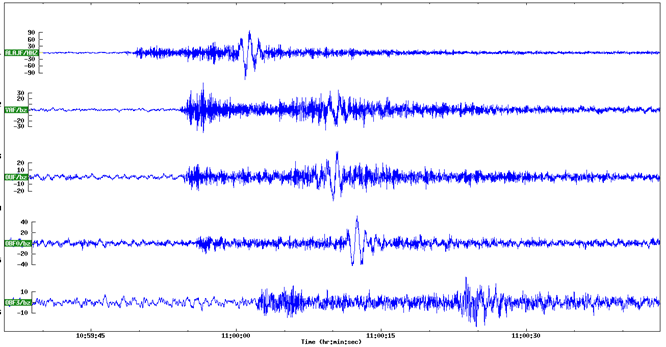
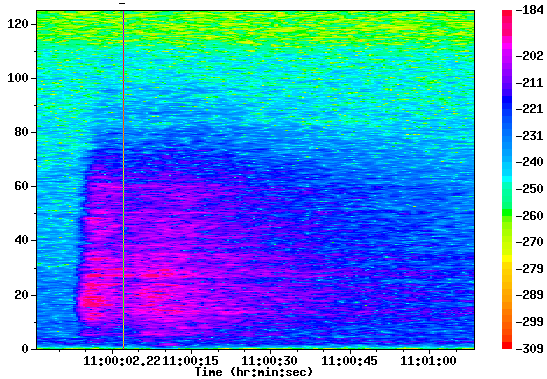
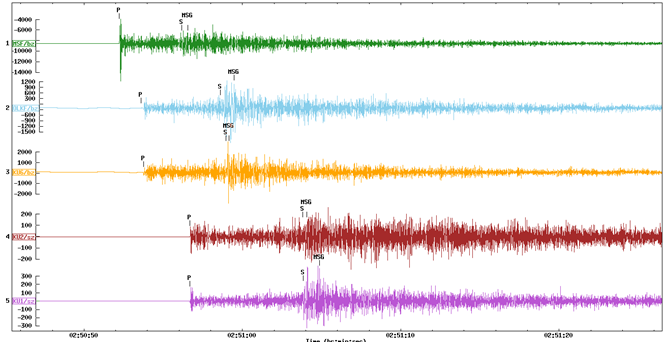
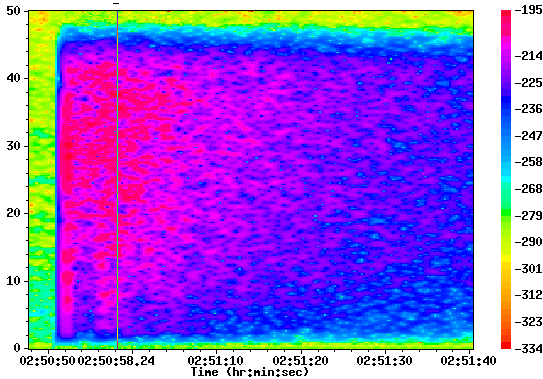
Most of the observations of HelsinkiNet stations have been explosions of quarries and construction sites. Every year of the network’s operations there have also been natural or human-induced earthquakes. The increasing use of geothermal heat production with the help of shallow and medium-deep heat wells is linked to the carbon neutrality target set by the City of Helsinki in 2035 and emphasizes the importance of the station network due to the seismic risk associated with the heat production. At times, even distant events have been discovered in data, such as the Taiwan earthquake on 3 April 2024.

Under the agreement between the Institute of Seismology and the City of Helsinki, the Institute publishes a public report on the activities and observations of HelsinkiNet annually. The report is mainly in Finnish. All reports can be read in the Helda publication archive and the latest of them can be found here.

Toni Veikkolainen, seismologist

Daily analysis of seismic events investigates the sources of seismic signals

The Institute of Seismology frequently receives inquiries from the media and citizens about various shaking observations.

The Institute has several channels to report or send inquiries on these observations. In addition to calling the info-phone of the Institute of Seismology, you can send an email or fill out an observation form on our website. Links and other contact information can be found on the Institute’s website. Every observation will be examined, and if necessary, we will carry out an analysis of the event. An explanation cannot always be found simply by looking seismograms, as some of the event sources are very weak and local. In these cases, only a very close seismic station can detect the signal. On the other hand, the source may be elsewhere than in bedrock, for example, an air-borne pressure wave can also cause windows to vibrate.

Based on the observation sent to us, we check the data from the nearest seismic stations for the time indicated. If the seismic event is strong enough, it may already be visible on our website “Seismic bulletins” where you can find “Local explosions and earthquakes today“. This page contains a map and a list of seismic events automatically detected and located by our software system. Because it is an automated list, i.e. a person has not checked it, the locations can be inaccurate at times, and there may even be incorrect events when the software combines signal peaks caused by frost, for example.

An analyst, i.e. a seismic data analyzer, searches for data from seismic stations at the requested observation time. Data is searched for a possible seismic event, the source of which is usually an explosion or an earthquake, but sometimes cave-in, landslide or frost quake can cause a signal. The first signal is marked as the longitudinal wave or P wave, and a slightly slower wave is marked as transverse wave or S wave. When these waves have been determined for several seismic stations, the difference in the velocity between P and S waves can be used to calculate the distance between the source and the station, and the source of the signal is likely to be found at or near the intersection of these distances. The more seismic stations are available around the source, the more precise location can be determined for the event. For example, seismic events in Finland tend to be located closer to the real source than seismic events outside Finland.

The analyst will also try to determine the seismic event mechanism as best as possible. Most seismic events observed in Finland (about 18,000 per year) are explosions at mines, quarries or construction sites. Explosions in mines and quarries are typically made as a series of multiple blasts, where bets are placed at certain distances from each other and are detonated with a slight delay. For explosions such as these, the signal is characterized by a steady distribution of energy in all directions and the typical waveforms generated by different blasting techniques (Figure 1). The explosions aim to dampen some energy frequencies and typically form a striped pattern in energy spectra (Figure 2).

Figure 1. Typical signal from an explosion observed in seismograms.

Figure 2. Typical striped energy distribution caused by an explosion. The left vertical axis denotes frequency, and the color scale describes the signal strength (i.e. the amount of energy). The image shows the OUF station’s observation of the explosion at Kaustinen.

However, with earthquakes, energy is distributed in different directions depending on the type of movement in the bedrock that caused the signal (Figure 3). In the energy spectra of the earthquake, energy has been distributed evenly across all frequencies, especially at closer seismic stations (Figure 4). A small seismic event, overlying locations, or duplication of another seismic event can make it more difficult to determine the source.

Figure 3. Earthquake happened in Kuusamo on 2 May 2024. Figure shows registrations from different seismic stations in Finland.

Figure 4. The energy distribution produced by the Kuusamo quake (from MSF station) is characteristic of the earthquake. The left vertical axis denotes frequency, and the color scale describes the signal strength (i.e. the amount of energy).

Finally, the analyst determines the magnitude of the event by measuring the amplitude of the strongest signal at different stations, from which the local magnitude is calculated to the seismic event. Once all parameters have been obtained, the result will be published on our website. Earthquakes are immediately visible through an earthquake search. In addition, earthquakes will appear within a few working days after the remaining seismic events of that day have been analysed, “Seismic bulletins” from the tab “Analyst-reviewed bulletins” of the page “daily bulletins of seismic events in Northern Europe” with explosions and other seismic events.

Kati Oinonen, seismologist

About timescales in seismology

Finland’s first seismograph began operating in Helsinki a hundred years ago. It is a milestone worth noticing and a long time for humans.

However, one hundred years is a brief time to collect evidence of earthquakes. In many regions, no strong earthquake has occurred in over a century, and even in regions with recent large earthquakes, a century is too brief to properly assess the long-term seismic hazard of the region. Although seismologists generally do not work on geological timescales spanning up to millions to billions of years, their work does include extending the series of earthquake observations as far back in the past as possible and forward into the future.

Earthquakes in the distant past can be investigated by using non-instrumental seismological methods. The likelihood of a strong earthquake occurring goes up the longer the time of observation is. The price of looking very far back, however, is an increase in uncertainty about the earthquake size – but there are ways of using available evidence to model sizes of earthquakes in the past.

Before measuring devices became common, the impacts of earthquakes could be observed directly by the naked eye. Especially after earthquakes caused damage, people have written documents about the event for authorities and other contemporaries, and sometimes also for scientific purposes. The most reliable of these reports are from eyewitness accounts. In the best cases, detailed written records have survived to modern times and been found by researchers. Through modern research methods, the seismic history of a target location showing how often strong earthquakes have occurred and how those earthquakes have impacted society over the centuries, or a couple of millennia in some parts of the world, can be extracted.

The geological traces left by strong earthquakes in the natural environment can go back to at least ten thousand years ago. The suddenness and violence of the earthquake remains as displacement movements, subsidence or rise of the ground compared to the environment, old landslides, and ancient water paths in the soil. The location and timing of these traces adds information about the frequency of strong earthquakes. Searching the landscape for evidence of large earthquakes is called paleoseismology.

The Fennoscandian Shield in Northern Europe has ancient bedrock and is seismically relatively quiet. There are written records of earthquake effects as far north as Lapland for almost three centuries and in the south for a slightly longer time. At the end of the last Ice Age, the retreat of the ice mass changed the stress conditions of the earth’s crust, causing strong earthquakes associated with several southwest-northeast trending fault escarpments in northern Fennoscandia. They have been dated to about 9–11 thousand years ago.

In the 2000s, high-resolution LiDAR (Light Detection and Ranging)-images, trenching, and seismic reflection campaigns have advanced paleoseismology in Fennoscandia. Traces of paleoearthquakes have been identified in lake sediments in the south. It has been proposed that paleoseismicity had three maxima in the Finnish territory around 10-12 thousand years ago, 5-7 thousand years ago, and 1.5-3 thousand years ago. The highest magnitude earthquakes, likely around Mw7 and above, were associated with the oldest earthquakes, and lower magnitudes (around Mw6) with the younger events (https://doi.org/10.1016/j.tecto.2019.228227). Traces of strong earthquakes 700–4000 years ago have been reported from the Stuoragurra postglacial fault in northern Norway(https://doi.org/10.1017/9781108779906.015). What is special is their size range – up to magnitude 7 – which challenges the old notion that the strongest earthquakes occurred relatively shortly after the Ice Age.

Knowing the seismicity of the past is critical in assessing the seismic risk in the near future. Because we cannot predict exactly when and where an earthquake will occur, probabilites must be used. The usual way of talking about seismic risk is that an earthquake of a given size or a given ground motion occurs in a target area with a given probability in 30 or 50 years. This 30-to-50-year period is related to construction and engineering building codes, and the hazard maps are aimed at ensuring that appropriate seismic building codes are used so that strong ground movements do not damage buildings and society’s infrastructure.

Seismologists therefore have at their disposal a catalog of instrumental measurements from the last 100 years or so, and usually a longer period of non-instrumental observations. Combined, these give seismologists the best data available for working with engineers to plan for the strong earthquakes that will inevitably occur in the future.

Päivi Mäntyniemi, University Researcher