Tracking the movements of IoT devices is not creepy—its just science

Understanding the science behind the mobility of IoT devices to improve them to a level Ms.Potts would be ashamed

©Walt Disney Co./Courtesy Everett Collection

Remember Ms. Potts from Beauty and the Beast? Ms.Potts could speak and probably could whip up a delicious cup of tea just how we like it. One cup of Earl Gray tea with two teaspoons of brown sugar at 80°C? Coming right up!

The Internet of Things (IoT) is simply, where we humans attempt to incorporate such abilities in dumb objects like a refrigerator, toaster, watch, etc by embedding electronic gadgets like sensors in them. These IoT devices gather and share data with other IoT devices within a giant network, where the collected data is analyzed and valuable information is extracted.

Some examples?

Your smartwatch which displays your step count and your smart car which calculates the shortest route to your favorite ramen shop avoiding traffic, are just some everyday examples of IoT devices. Whereas Amazon’s Alexa is an AI that uses the concept of IoT extensively to perform its magic, from streaming music to heating up your leftovers.

It is not surprising that the IoT industry is experiencing rapid growth. Soon enough, our smart refrigerator will nag us to buy milk and our smart scale will not be too far away from blackmailing us.

Illustration: Larry Kim/Pinterest
Illustration: Scott Bedford/Shutterstock


In fact, according to Cisco, there will be 500 billion IoT devices connected to the Internet globally by 2030.

But this expansion in the IoT industry comes with its fair share of problems. In April 2022, a group of scientists from the University of Helsinki decided to conduct research on the mobility patterns of IoT devices in an attempt to provide some solutions to these questions. 

What was this study?

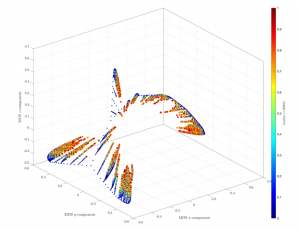
This study was the first large-scale measurement study of IoT mobility. A dataset from more than 1.5 million IoT devices in China was used for this study during a period of 36 days. In addition, a signal dataset of 425,000 smartphones from the same cellular network was collected. Then they manually classified these 1.5 million IoT devices into 7 categories based on their function, namely locating devices (such as the GPS devices used to track your Amazon delivery), metering devices (mainly used in intelligent healthcare and smart farming), monitoring devices (such as CCTV cameras which upload real-time video streaming from all around the shopping mall to the security room), portable devices (like your smartwatch), POS or rather Point-of-Service devices (such as ATM machines), industrial terminal devices (mainly manufacturing machines in factories) and vehicles. 

They focused on three major problems in their research. Number one, what are the mobility patterns of an IoT device? Number two, what are the differences between IoT and smartphone mobility patterns? Number three, how do mobility patterns defer among different types of IoT devices? 

What did they find?

Our brilliant scientists discovered three key points from their research. One, IoT devices move more frequently and use the network more actively in the daytime. Two, the mobility of IoT devices can be predicted. The limits of predictability for smartphones and IoT devices are similar. Three, IoT devices have more ‘important locations’ than smartphones. ( For example, a typical day for me would be going to university for lectures, going to the library, and getting back home. In my case, I have three ‘important locations’ where I take my smartphone: the university, the library, and my apartment. IoT devices have more of these important locations compared to smartphones.)

These results may seem boring or even obvious to us. But the statistics calculated in this study will prove extremely useful.

The question is, how?

For example, currently, IoT devices have access to limited networking resources mainly because they are in direct competition with smartphones for these resources. With the rising popularity of IoT devices, if the means to combat resource scarcity are not met, the quality of user experience will be downgraded.

Illustration: Dithara Petikiri Arachchige

Through statistics calculated by analyzing the mobility patterns of IoT devices, network operators can provide better management of shared network resources and guarantee the best service quality for both types of devices. Therefore, you can gossip with your friends while listening to Taylor Swift’s songs and simultaneously command your future smart coffee maker to make you a latte, without experiencing any delay. 

In a nutshell, this research, while not groundbreaking, is an important milestone in improving the IoT industry. Afterall, it is the small things that lead to big changes. When you finally get that nagging refrigerator, you know who to thank. 

Author: Dithara Petikiri Arachchige

References:

Xu, D., Wang, H., Li, Y., Tarkoma, S., Jin, D., & Hui, P. (2022). IoT vs. Human: A Comparison of Mobility. https://doi.org/10.1109/TMC.2020.3019988


Transparent Wood stars as the race for sustainable materials carries on!

Scientists at the University of Maryland have finally cracked the code to turn ordinary sheets of wood into a material that is nearly as transparent as glass, but stronger and with better insulating properties. With some tweaking, it could very well be the next big sustainable material!

Wood in its most fundamental form is just two things. The first is lignin, a glue-like substance that holds the individual wood fibers together. It also contains the substance that gives wood its earthy brown colour. The other material is cellulose (which provides strength and rigidity to the plant cell wall).

For millennia, wood has aided humankind for multiple purposes, and for good reason. It is relatively cheap, tough, and strong. Moreover, it not only has low density, but we also don’t need to do much to produce it! Just plant a seed in the ground, wait and lo and behold, nature has produced one of its finest materials for free!

Now, you must be thinking, that is good and all, but why go through the trouble to make wood transparent?

“Optically transparent wood is an excellent candidate for lightweight and low-cost structures in light-transmitting buildings and for transparent solar cell windows.”

Scientists had this to conclude after putting the material through vigorous tests. So, now that I’ve got you interested, let’s find out how wood can become glass!

Firstly, scientists experimented by trying to remove the lignin (which also contains the brown pigment). The results were, however, less than satisfactory as the product was fragile, and the process involved high temperatures and hazardous chemicals, ultimately pushing the price point up of such a material.

Frustrated but not giving up, scientists turned to this new method. They not only found it extremely inexpensive but so easy to do that you or I could pick up a paintbrush and begin making transparent wood!

Long and thin planks of wood were taken, and then a hydrogen peroxide solution was brushed on using a paintbrush. This was then left out in the sun.

What happened then was, that our friend, the wood got a skin treatment by the UV rays of the sun and in fact was reverse sunburnt! The hydrogen peroxide acted on the brown pigment and bleached it out, leaving behind a white piece of wood. This white wood was then coated with a layer of special marine epoxy, which was the final step in this plastic surgery.

The wood had turned transparent! They had succeeded at last!

The transparent wood would then go through multiple tests, to check its properties. They found out that

“High optical transmittance of 85% and haze of 71% was achieved at a transparent wood thickness of 1.2 mm.”

or in simpler words, transparency of 85% and distortion of 71%, compared to glass, which has a transparency of 92.5% and distortion of 10%.

These results are quite remarkable, and to a certain extent, unbelievable. As the future draws near, we could see transparent wood replace glass in energy-efficient buildings and be used as solar panel protection.

Scientists state that as the research is scaled up to industrial levels, it could be used to make walls of a house, and we could one day, even have an entirely transparent house! Although, when you think about it, we would much rather prefer our houses built with regular wood…

by Muhammad Faiqh

Li, Yuanyuan, et al. “Optically Transparent Wood From a Nanoporous Cellulosic Template: Combining Functional and Structural Performance.” Biomacromolecules, vol. 17, no. 4, American Chemical Society (ACS), Mar. 2016, pp. 1358–64. Crossref, https://doi.org/10.1021/acs.biomac.6b00145.

Getting ahead of Earth-bound asteroids with Gaia.

Now that we’ve got the horrible title out of the way, let’s get to the actual point. Since 2014, ESA (The European Space Agency) has had a space observatory (very cool) called ”Gaia”  scouring the night sky for potentially new asteroids. Wait, no. The goofballs at ESA miscalculated a bunch of stuff and the actual observing was delayed until 2016, meaning that the observatory just sat in space for like 2 years doing nothing. Anyways.

The Gaia project is actually quite vast. ESA’s plan was to use the space observatory for creating the most accurate map of our galaxy to date. The article i read however only focuses on it’s uses for asteroid discovery. Let’s discuss that.

Since 2016, after all the mishaps, Gaia was finally fully operational. Since 2016, Gaia has been running automated processes and released over 1700 alerts of potentially new asteroid discoveries. It has filtered out most of the other objects in space, detecting only asteroids. Imagine how much work this takes off of the hands of astronomers. Whenever they see an asteroid in the night sky, they won’t have to spend tons of time checking whether it’s a new one, an old one or the Tesla Roadster that Elon Muskrat chucked into our orbit for no reason. Gaia will look for these asteroids all by itself and inform you of them, filtering out the Roadster.

Although Gaia is quite a magnificent piece of work, it is not perfect. We humans still have to run checks via observatories located on earth (boring) to verify that the alerts are indeed of new asteroids. This isn’t actually that much work though, because Gaia does include approximated locations of the asteroids along with the alerts. From the launch of Gaia to the date my source was published, astronomers had looked for 250 of these potential asteroid discoveries, leading to the detection of 227 of them. There’s also some boring information about the ”AlErT rElEaSe InTeRfAcE” and whatnot  but let’s not focus on that (very boring). That’s not what you’re here for.

Now, why did you need this information? In fact, why would anyone need this information? It may bring you comfort that the sky is being watched for massive asteroids about to obliterate our planet (bad for the environment). I’m sure that at some point in the future we will start mining these asteroids for precious resources and having a map of them would certainly help out with that.  Also, it would be quite anticlimactic and not fun at all for NASA to spend a bunch of time and money on a mission to send the first human to Mars only for the cool spaceship to be gadooshed by an undiscovered asteroid.

Although Gaia’s results were hampered by its slightly anticlimactic launch, it has still been a great success so far. Unfortunately, it’s trip is coming to an end quite soon. It is expected to run out of fuel by 2025. However, the data it has provided will keep astronomers busy for years to come. They still have over 1450 alerts to double check, not to mention the work that has to be done to achieve the main purpose of this observatory, which is to map out our galaxy. I look forward to seeing it on Google Street View.

Blog post written by Emil Sjöblom

Source: https://www.aanda.org/articles/aa/full_html/2021/04/aa39579-20/aa39579-20.html#S7

Are you blaming electronics for your teens’ mental health problems? A new study suggests you should think again

We are only now finding out the actual effects caused by the lockdowns and the COVID-19 pandemic.

In times of everything from school to birthday parties being held on Zoom, access to the internet has become vital. On top of all other problems caused by the COVID-19 pandemic, since the beginning of March 2020, there has been a significant increase in mental health issues among youth. While it may be easy to blame the rapidly increased screen time for the growing issues, a new study suggests that limited digital access might have the opposite effect.

The study, conducted by the University of Cambridge sought to understand whether or not having no access to a computer with a reliable internet connection has a relationship to the mental health of 10–15-year-olds. Over a thousand participants from the United Kingdom filled out questionnaires throughout the pandemic. What the scientists found out might feel counter-intuitive at first.

The scientists used a metric called “Total Difficulties Score” to measure the well-being of the participants. Total Difficulties Score is a way to measure the participants’ mental health from a questionnaire that takes into account emotional problems, conduct problems, hyperactivity, peer problems and social well-being. During social isolation, the mean Total Difficulties Score went up among all participants. However, for the digitally excluded the increase was over five times as large as for their counterparts. What is interesting is that those with access to a computer with a slow internet connection had on average no higher Total Difficulties Scores compared to those with good internet connections.

The theory is quite simple. As we all know, going to school and after-school activities are a crucial part of both making and meeting friends and learning new valuable skills. Taking away access to the internet means excluding young people from being able to socialize and keeping up with their peers. Those with slower connections were still able to connect with their friends as they had access to the needed platforms and tools.

The possibility of similar lockdowns in the future is still on the table. The scientists suggest that in similar scenarios, access to computers and online environments must be secured for all youth. Young people are vulnerable to developing mental health issues. These issues can have long-lasting effects throughout their life. According to the study, mental health issues were on the rise even before the pandemic, but the situation became noticeably worse after the lockdowns and remote learning periods.

While the study focused on education, the scientists acknowledge that the effects of digital exclusion for the youth are not limited to the digital or concrete walls of the schools. As a result of the pandemic, increasing amounts of hobbies, social contacts and even healthcare services happen online. When meeting peers cannot happen face-to-face, teens socialize online by playing video games or by being on social media. The effects of the internet and social media on teens’ mental health can be devastating under some conditions, but completely logging out in this digital day and age can not be the answer either. Elementary access to the digital world for young people must be emphasized as a factor in the thousand-piece puzzle that mental health can be. Instead of the negatives, sometimes the positive effects of the digital world should be celebrated.


Metherell, T.E., Ghai, S., McCormick, E.M. et al. Digital access constraints predict worse mental health among adolescents during COVID-19. Sci Rep 12, 19088 (2022).

Did the COVID pandemic show that we behave like prey?

After the sudden COVID-19 outbreak in early 2020, it’s been made quite clear that we weren’t prepared for a pandemic at all. Many governments had no plans in case something like this happened and there was a lot of confusion and damage created due to the lack of preparedness for the situation. Because of this, many researchers all over the world have started looking into disease spreads and virus outbursts within animal populations and using mathematical models to see how to best control disease spreads. It may be good to focus on some of these findings to see if we could’ve prepared better or if we could compare our behavior to the ones postulated here.
 

A group of researchers in the Università di Torino, Italy wanted to study how diseases spread among animal populations consisting of a predator species and a prey species. While this isn’t nearly the same as looking at the human population with more than 8 billion people, it helps us understand the process better and there could always be some method that could be extrapolated to our situation.

By looking into two different models of these populations, the researchers were able to find surprisingly different results for certain populations and in some cases some quirky characteristics of these disease spreads. For example, by looking at how some predators herd prey, like wolves and sheep, the researchers were able to find that only the sheep in the outside of the herd were attacked by wolves and thus, the disease transmits directly to wolves only by those sheep. Surprisingly, instead of wiping out either of the populations, the disease reaches a sort of equilibrium, affecting both populations but never taking over either of them.
Another example shows that when the prey live naturally longer lives, the disease spreads more within the population while not affecting much of the predators. Looking at the results of the research we can see that whenever a disease is present in an ecosystem such as the one studied here, while some characteristic populations will react differently than others, they will most often approach an equilibrium between the natural lifespan and the disease.


This research helps us notice that we should study this relationship further, as the difference in time it takes for an ecosystem to reach this equilibrium is important to us to better control diseases spread amongst for example farm animals. By changing how these animals live we could be better fit to react whenever a new disease shows up, which will decrease the amount of people affected by it and could even show us how to completely isolate the disease before it begins to exponentially spread.

Sources:
Venturino E. Disease Spread among Hunted and Retaliating Herding Prey. Mathematics. 2022; 10(23):4397. https://doi.org/10.3390/math1023439

How to see the invisible (not clickbait)

Dark matter. One of our universe’s great mysteries and theorized to make up 85% of all the matter in it. But what is dark matter?

Unlike the matter we are made of, dark matter does not interact with light—that is, dark matter is invisible. We assume that dark matter interacts with gravity, therefore, it must interact with other matter too. It’s also quite hard to detect, wherein our main problem lies.

Currently scientists think dark matter is made of very heavy particles that interact weakly with its environment. Therefore, they are called WIMPS (Weakly Interacting Massive Particles.) With current research methods, it’s difficult to tell the difference between visible particles (background noise) and actual signals from WIMPS. Here comes the problem: dark matter, or WIMP, signals are incredibly similar to those of visible matter, or solar neutrinos—incredibly small particles forged in the heart of stars.

Researchers, however, thought of a new method, which for now is a computer simulation. Looking at the direction of the signals may help differentiate neutrinos and WIMPS, since they have different origins: solar neutrinos from stars, while dark matter is everywhere. Germanium (Ge) and silicon (Si) single-crystalline semiconductors are the key, due to their atomic structure. This probably sounds like gibberish, so let me break it down for you. Crystalline simply refers to the way atoms are arranged in a material, in this case forming a crystal. A semiconductor is a material that can conduct electricity, but not as well as copper, a strong conductor. With the detectors using these materials, researchers can obtain different signals depending on the orientation of the crystals, even if the signals are scarce, therefore differentiating between neutrinos and WIMPS.

Now, to explain precisely how these detectors would work, let me start with this: Scientists want to use a method that involves nudging around the electrons in the crystals, creating defects—otherwise known as defect formation. They need a certain range of energy to place in the defects. With this, they are hoping to observe dark matter interacting with particles. But for successful results, we also need to take energy loss into account. These energy levels are important because if it’s below the minimum, or it’s too much, the detection won’t work. Using some fancy equations and calculations, scientists use the energy lost in defect formation to tell the difference between the signals they need and the ones they don’t. Meaning, when dark matter interacts with the particles in the detectors, within a certain energy level, scientists will be able to receive a certain signal that tells them it’s dark matter.

It’s important to develop these types of germanium and silicon detectors, which can probe lower energy thresholds, because it could allow for the detection of more dark matter. Moreover, this theoretical method could have a large impact in the scientific community because it could be used to differentiate dark matter from the indistinguishable solar neutrino signal, and greatly improve the direct detection of dark matter.

You might not think of these as very important when we have climate change and energy source issues on our hands, but with every new discovery we realize how little we know about our world and how it works. Finally being able to see what the invisible 85% of our universe is doing in its free time, whether it be partying or holding galaxies together, isn’t a trivial matter. Being able to detect dark matter is crucial to understanding our universe and its future; whether it will stop after expanding a certain amount, or collapse, destroying reality as we understand it.


Kadribasic , F , Mirabolfathi , N , Nordlund , K , Holmström , E & Djurabekova , F 2018 , ‘Defect Creation in Crystals : A Portal to Directional Dark Matter Searches ‘ , Journal of Low Temperature Physics , vol. 193 , no. 5-6 , pp. 1146-1150 . https://doi.org/10.1007/s10909-018-2062-5

Strange behavior of particles on near-Earth asteroid Bennu

Bennu is a near-Earth (its orbit around the Sun is within Jupiter’s orbit) asteroid approximately twice as far from Earth as the distance from Earth to the Sun. The size of the asteroid is around 500 meters in diameter and it has a porous structure with a composition of carbon-rich materials. Furthermore, scientists believe that analyzing these materials might shed some light on the origins of the Solar system.

Data about the asteroid has been collected by NASA’s spacecraft OSIRIS-Rex from December 2018 to March 2021 and the spacecraft is currently on its way back to Earth. Bennu was chosen as a target for the OSIRIS-REX’s mission because it’s believed to be an active asteroid, meaning that there is evidence that it loses mass. During this observation, there was spotted a strange behaviour of particles (small rocks), each of size less than 10 cm, on its surface particles were suddenly ejected from Bennu’s surface. The mechanism behind these particle ejections is still controversial among scientists. And in this article I am going to tell you about the possible reasons behind this particle phenomenon on Bennu:

During the observation, there were multiple large ejections of particles, the largest happening on 6th January 2019, when 200 observed particles launched off Bennu’s surface, with a maximum velocity of around 10 km/h. These large particle ejections happened roughly in 2-week intervals, usually on the side facing the Sun. There were three common scenarios that happened to the particles after the ejection – some fell straight back to the surface, due to lack of speed; others began to orbit Bennu, the longest orbit was 16 revolutions and lasted a few days; lastly, some particles completely left Bennu.

The first possible reason behind these mysterious ejections might be the collisions of other space rubble with Bennu. This would mean that the objects colliding with Bennu would transfer their kinetic energies to particles on the surface causing them to launch off the surface. To clarify this mechanism, you may imagine throwing a ball into a swimming pool, once the ball hits the surface of the water it creates a splash – the ball transferring its kinetic energy to the water causes some water to launch off the water’s surface.

Another possible cause of this particle phenomenon might be water vapour, as the face of Bennu facing the Sun might reach almost 130 ˚C, this might cause some water-bearing minerals to release the water as a vapour that might build pressure in the cracks of Bennu’s porous structure. If the gas is then released it may cause the particles to eject as the gas escapes through the cracks. You can compare this to inflating a balloon, if the pressure in the balloon is too high, the material breaks and the air escapes.

And lastly, the ejection of particles might be caused by thermal stress fracturing. Bennu makes one revolution around its axis in around 4 hours, leading to frequent temperature changes on its surface as the temperatures may change every 4 hours from -70 ˚C to 130 ˚C. These sudden changes might cause rocks on Bennu’s surface to crack which may result in breakage and energy release which may eject the particles.

To sum up, scientists are still unsure about the actual cause of these ejections, but it’s probable that it might be a combination of some reasons mentioned earlier. Nevertheless, the samples from Bennu might help scientists understand the behaviour of asteroids and also the origin of our Solar system.

Jakub Greguš

Paper:

Lauretta, D. S., Hergenrother, C. W., Chesley, S. R., Leonard, J. M., Pelgrift, J. Y., Adam, C. D., … Becker, K. J. (2019). Episodes of particle ejection from the surface of the active asteroid (101955) Bennu. Science, 366(6470). doi:10.1126/science.aay3544

Stuck in a traffic jam? This is how your Internet data avoids gridlocks

Can your internet data get stuck in a virtual traffic jam?

So much of modern life depends on fast transportation. In ancient Rome, traveling between cities used to take days or weeks, while nowadays people commute regularly for hundreds of kilometres every day to go to study or work. An even more extreme jump occurred in the speed of communication. While delivering a letter used to take at least as long as human travel, requiring physical transport and delivery, we can now connect instantly with people on the other side of the world and exchange a huge amount of data, including photos, music, videos and blog posts like this one.

Everybody that has ever commuted in the modern world knows that, as more and more people travel, traffic jams become a common and frustrating experience. What you may not know is that, in the early days of the Internet, it used to be common for data to get stuck in a virtual equivalent of a road gridlock. In the late ‘80s, the situation became so bad that some universities saw their Internet connection speed reduced by a factor of a thousand times, to the point that it would take one second to send or receive five English characters. Receiving a full-size tweet would have required you a full minute of waiting, while a website with a single medium sized picture would have taken around one hour to be loaded.

The increasing occurrence of these data jam events inspired researchers Mike Karels and Van Jacobson from the University of California to search for solutions to the problem. They noticed that, as each Internet client was trying to push as much data as possible into the network, data packets would start to get lost. When data is lost, it needs to be sent again, leading to waste of network bandwidth and a significant drop in network speed. To avoid this situation, they came up with a strategy that did not require to modify the expensive physical network infrastructure, but only a small change of behaviour on the client side. Instead of sending as much data as possible, a client should carefully probe the network capacity, gradually increasing its sending speed until some data begins to be lost. At this point, instead of immediately trying again, the client should cut their speed in half, allowing for the network to not be overused. The client will then increase their speed again, until the next data loss, repeating the cycle over and over. The researchers demonstrated that this strategy allowed for the network to be used at close to full capacity without creating data jams that would significantly reduce network speed.

This research was revolutionary at the time, allowing the Internet to grow exponentially and connect everybody on the planet like never before. But one question remains open. When can science find a solution to the real life commute traffic jams everybody hates? Progress is always ongoing, and traffic aware self-driving cars may become part of the revolution. But this is a topic for another day.

Manuel Furia

Source:

V. Jacobson. 1988. Congestion avoidance and control. In Symposium proceedings on Communications architectures and protocols (SIGCOMM ’88). Association for Computing Machinery, New York, NY, USA, 314–329. https://doi.org/10.1145/52324.52356

How do we know what planets are made of and why should we care?

Before we talk about planets we need to understand the stars.

More importantly how stars are born.


Stars form in gas clouds, also known as interstellar clouds. Regions in space with gaseous elements. When stars form their new gravity causes the cloud around them to compress into a disc. These are known as accretion discs. Accretion discs look like frisbees, also like frisbees they spin around the star.


Why is any of this relevant?

Well as an accretion disc spins the matter within it bumps into each other slowly growing in size, like snowballs but with rocks instead of snow. Over time this process forms planets, moons, asteroids, etc. Basically most of the stuff you find in a solar system is made through this snowball method.


Before the invention of more powerful telescopes, we used to think there were only planets in our solar system, but in recent decades we found out that most stars have planets. So every star we see in the night sky likely has its own solar system.

Meaning there are millions if not billions of planets in the universe. Scientists now are trying to find out what these so-called exoplanets are made of and if they can support life.


It can be difficult to study exoplanets since they don’t emit any light, so scientists use methods like spectroscopy to study gas clouds instead.

You might be wondering “How are those two things related?”.

Well, when scientists study the makeup of a gas cloud or accretion disc they know that any planet that forms out of it will have roughly the same composition.


Why does a planet’s composition matter though?

Planets need to have certain compounds to be able to sustain life. For example, they need carbon, oxygen and hydrogen for organic molecules. Phosphorus and sulphur are also vital for sustaining life, as they are needed to make some organic molecules. If they find a planet that has the basic building blocks for life then we can study it further.

Who knows we might even find another Earth.


Source:

Öberg, K. I., & Bergin, E. A. (2021). Astrochemistry and compositions of planetary systems. Physics Reports, 893, 1–48. https://doi.org/10.1016/j.physrep.2020.09.004

Can patterns solve an unsolvable puzzle?

Are you a fan of puzzles? Perhaps riddles are more your style. Maybe you are someone who is partial to the occasional thought experiment. Regardless, chances are the highlight of a puzzle is finding the solution. Unfortunately, this is something that is not always so straightforward when maths gets involved.


The Collatz conjecture, invented by Lothar Collatz, has been around since 1937. To this day it is incredibly famous, all because it has been so difficult to solve. 


At first glance it may appear simple, it goes as follows: 


Take any whole number.


If it is even, half it.


If it is odd, multiply by 3 and add 1.


This process is repeated indefinitely, causing a sequence of numbers to form. 


This doesn’t seem all too complicated from a mathematical standpoint; in fact, it would be pretty easy to do this yourself (perhaps with a calculator when the numbers get very big). So why has it had mathematicians stumped for so many decades? 


So far, every number tested falls into the loop of 4 then 2 then 1. This becomes an infinite loop since 1 is odd so would be used in the 3n+1 function, which will give the output 4. 4 is even so it is halved to give 2. 2 is also even so it is halved again, and we are back at 1, only for it to loop back around again to 4. Mathematicians have spent decades trying to determine if every sequence will eventually reach this 4, 2, 1 loop for every single starting integer or if there is some whole number out there that produces a different result. The Collatz conjecture would be considered solved when it has either been proven to always reach the aforementioned loop or a contradiction has been found wherein this loop doesn’t occur.


Of course, being so old, many people have attempted to prove the Collatz conjecture, all without success! So maybe it’s time for some new ideas. 


The purpose of the article that I read was to approach the Collatz conjecture from a different perspective. It was all about clustering (plotting the various results onto a graph and examining how they group together). Clustering is something that I think shows a lot of promise when it comes to finding a proof. This is where the distance between the outputs is mapped onto a 3-dimensional chart. The distances are calculated using different Multidimensional Scaling algorithms where each equation examines something different. For example, the Hamming distance calculates to what extent components are identical or distinct while the Lorentzian distance compares small and large values using logarithmic functions.


As this is done over and over, different patterns start to form all depending on what distances are used. 


This example uses the ArcCosine-Hamming distance.


The idea here is to either spot clear outliers or clear patterns. Up until this point mathematicians have tried to prove the conjecture with computer programs that have tested it to ridiculously large numbers (2 to the power of 68, to be precise) or rigorous mathematical proofs. This is all great, but it lacks creativity which I think clustering brings. Every distance tested in the article showed an obvious pattern. From this it is made clear that displaying it visually and interpreting what we see rather than just relying on numbers can bring a whole new perspective to the problem.


In the end, this didn’t bring us to a solution but is definitely worth some merit and I don’t think it should be dismissed as a possibility any time soon.


Sometimes a logical problem requires an artistic solution.


Machado, José A. Tenreiro, Alexandra Galhano, and Daniel Cao Labora. “A Clustering Perspective of the Collatz Conjecture.” Mathematics (Basel) 9.4 (2021): 314–. Web.