Here I’ll post relevant links to subjects discussed in my poster at the FSTGII conference
Email: emma.mannfors (at) helsinki.fi
Want to find me? Look for the tall person with blue/turquoise hair.
Click here to download my poster (PDF, 1.4 MB)
Contents
- Summary
- Concepts mentioned in the poster
- Pictures in the poster
- Programs used for analysis
- The ngVLA telescope
- References
Summary
This poster is composed of two papers (in progress/submitted.)
In the first paper, we observed OMC 3 in Orion with Herschel SPIRE and APEX ArTeMiS. We combined the data with feathering. We derived column densities and Plummer profiles. We will study fragmentation. Our question: How does increased resolution change derived filamentary properties?
In the second paper, we simulated an IRDC at 4 kpc. We simulated observations of the cloud with ngVLA (Next-Generation VLA) using molecular lines. The poster focuses on N2H+ analysis. We additionally simulated single-dish data with the Green Bank Telescope. Our question: How well does the ngVLA recover emission from an IRDC?
Concepts mentioned in the poster:
Plummer profile:
(Arzoumanian et al. 2011; André et al. 2014).
We have used a modified version of this where both sides of the profile are fitted separately, with N0 kept constant.
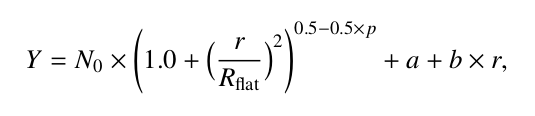
Where N0 = the maximum intensity / column density of the filament
r = the distance from the center of the filament
Rflat = the width of the filament
p = the slope of the filament
a + br = linear background
Modified blackbody (MBB)
(For more info on MBB fitting, see e.g. Mannfors et al., 2021. Direct ADS link on my research-> papers page)
The MBB describes IR emission and is described by the formula:
(B_{nu}(T) / B_{nu, 0}(T) ) * (nu / nu0)**beta
Where B_{nu}(T) is the Planck function at frequency nu, and beta is the opacity spectral index.
Beta = 1.8 is fairly accurate in dense clouds.
Pictures in the poster
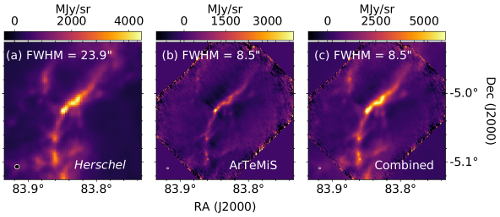
G208 / Orion Molecular Cloud (OMC)-3 with Herschel (a), ArTeMiS (b), and feathered (c). Feathering is a process where signal from two antennae of different resolutions are combined, and is often used in radio interferometry. Feathering was performed with uvcombine (see below), and took as its inputs the Herschel and ArTeMiS data, as well as the largest scale recoverable by ArTeMiS.
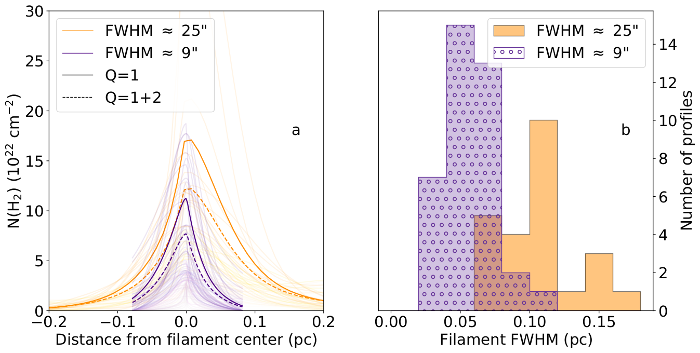
Orange color is Herschel-only (beam FWHM = 25”) and purple is Herschel feathered with ArTeMis (beam FWHM = 9”). The faint curves in frame a show Plummer profiles calculated for each row of the filament, and the dark lines the mean profiles for two quality bins.
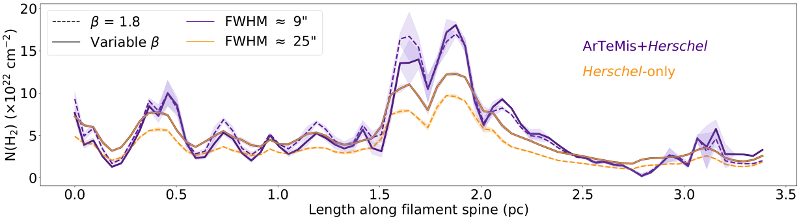
Orange color is Herschel-only (beam FWHM = 25”) and purple is Herschel feathered with ArTeMis (beam FWHM = 9”). Column density along the filament spine. Dotted lines correspond to fits assuming constant opacity spectral index (B / beta in the figure), and solid lines to ones in which B was allowed to vary between ~0.5~4.0.

Results of simulations of the IRDC (infrared dark cloud; Juvela et. al., subm, A&A). Simulated single-dish data were combined with simulated ngVLA data. Analysis was performed on fits to N2H+ spectra (including hyperfine components).
Frame i shows a column density image of the map. Filament spine is overlaid with white dots, and the locations of extracted spectra are marked with a-c. The single-dish beam (FWHM ~8”, Green Bank Telescope) is shown in the lower left and the ngVLA beam (FWHM ~0.5” at N2H+ frequency) in the lower right.
Spectra from these locations are shown on frames a-c. Blue solid lines show the ideal observations, dashed orange the ngVLA-only interferometric observations (showing loss of extended emission), dashed lines the single-dish data (which miss detail due to a large beamsize), and the combined single-dish+ngVLA data with black dots.
Frame ii uses the same markers (except that single-dish-only data are not shown) to show column density N(N2H+) along the filament spine.
Programs used for analysis:
Simulating ngVLA Data with CASA
next-generation VLA (ngVLA)
- Frequencies of 1.2 GHz (21 cm) to 116 GHz (2.6 mm)
- Main small array in New Mexico, United States, with antennae out to New Hampshire, Puerto Rico and Hawaii.
- Construction to begin 2029.
- Full science operations predicted to begin 2035.
References:
Juvela, M., Mannfors, E., and Liu, T. A&A, subm.
Mannfors, E., Juvela, M., et al. in progress
André, P., Di Francesco, J., Ward-Thompson, D., et al. 2014, in Protostars and Planets VI, ed. H. Beuther, R. S. Klessen, C. P. Dullemond, & T. Henning, 27
Arzoumanian, D., André, P., Didelon, P., et al. 2011, A&A, 529, L6
https://tinyurl.com/EMFSTGII