Final notes from the Research Assistant

The purpose of this research was to develop a proof-of-concept of how consumer generated interpretations of everyday sustainability in social media could be utilized in business settings. Main tasks were data acquiring, processing, and analyzing as well as presenting the results to academia in Finland and abroad as well as to members of interest groups from business.

On the first stage of this project, I went through some previous research on consumer generated social media data use to learn how to acquire such data and to find out whether anyone has done this type of research before. Quite soon I realized that MORE project is unique since it focuses on networks of tags rather than popularity or relationship between actors on the platform. Practically speaking, I had to be careful when going through the posts on Instagram so that the ones with clear commercial interests behind them would not be accepted into the data. Here, the advice from our colleagues at the University of Helsinki concerning our problems with data acquisition was highly valuable as it became clear that most platforms are not very reliable when it comes to large and sensitive data files.

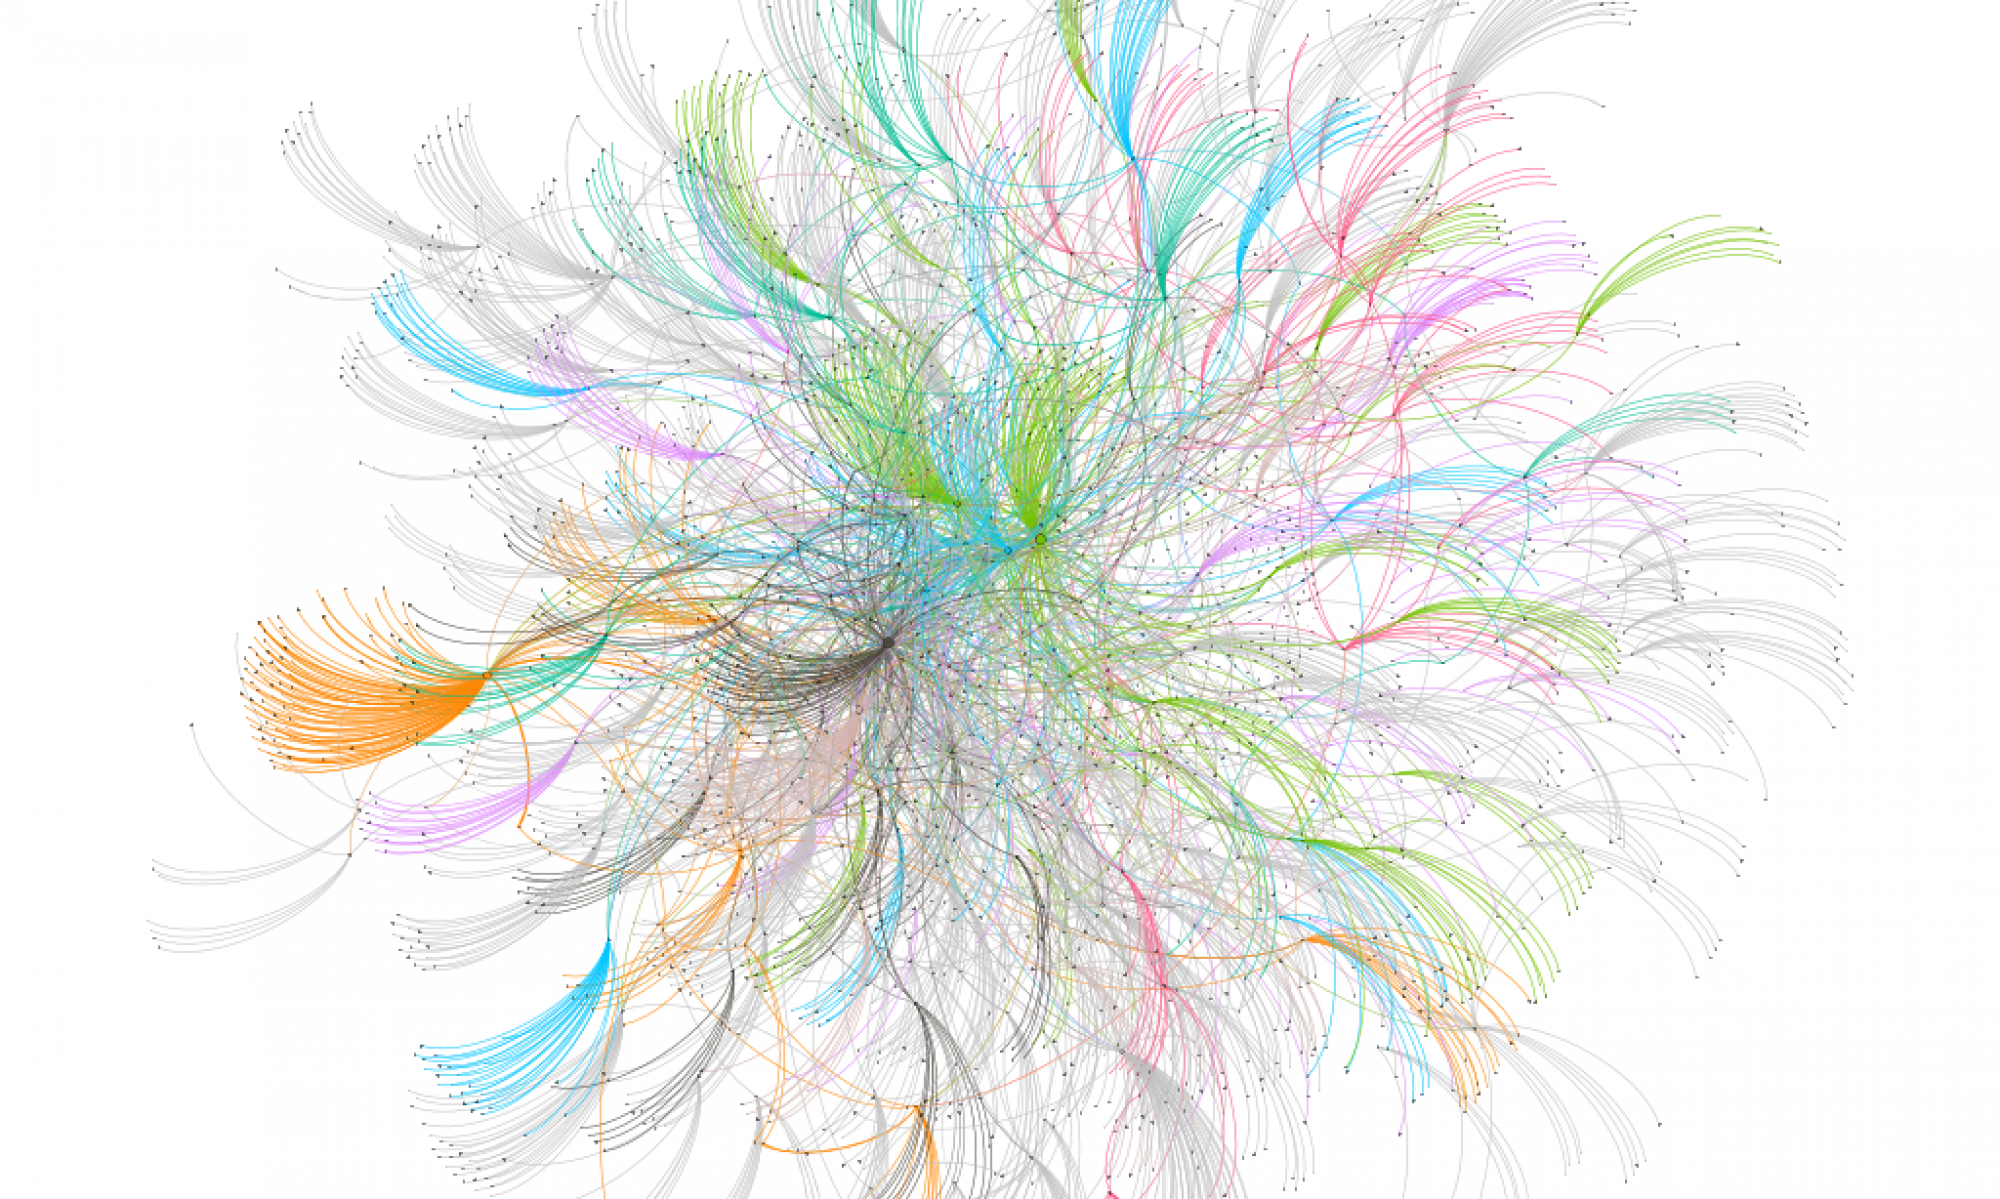
The following steps with the data required careful deliberation with processing and analyzing. Some of the rarely used tags had to be pruned from the network to make it more presentable. On the other hand, too few tags in the first place may lead to overemphasizing of individual posts. This could be seen especially with Twitter preliminary results. Hence, one should be more careful with the amount of data in future research­ despite whether the focus is on conversations or revealing large phenomena.

During these 11 months we organized three workshops for the company representatives participating in MORE project. The aim of the workshops varied from presenting the quality of the selected social media platforms and data to productive brainstorming inspired by final network visualizations.

At the first MORE workshop in May, we presented some of the Instagram data and preliminary results from Tumblr. The presentation provoked enthusiastic discussion among the participants and a lot of ideas about the future utilization of the method. For the second MORE workshop in September, we prepared a Tumblr data network visualization and revealed a few tags that represent the platform’s character as a creative and undergroundish individuals’ playground.

The data from Instagram, Tumblr and Twitter were analyzed as individual networks for the third and final workshop in November. Also, a slide of weak signals was created. We compiled four questions on Miro platform and participants were divided into three groups based on their department they represent at KONE. They were asked to type an answer to each of the four questions about the insightfulness of the social media network visualizations and the utilization of this new knowledge from the research in their own work. As could be imagined, lots of real-life stories and ideas were shared during this workshop. Personally, I found this workshop very intriguing since it brought our months long work and KONE employees’ practical knowledge on elevator business together.

A summary of the findings collected in the last workshop was presented in January at the Kone Technology & Innovation Talks event held at Kone’s headquarters in Keilaniemi, Espoo. A whopping 150 participants gathered around their computers to listen to the steps and findings of the MORE project. After this, Jaana Hyvärinen from KONE took us for a little tour in the buildings and finally, on top of the main building with one of the many elevators.

This project has involved various tasks from studying and learning from previous research to enjoying the fruits of the whole process by having conversations about the networks with everyone involved in workshops and other meetings in person and online. My part of the work ends here but Päivi and Petteri will continue with the project till the end of June 2023. I thank them for offering me this opportunity to participate in their research project and for all the good lessons I received from them and from the process itself. I hope this pioneering research is useful for the future researchers and its contribution to the sustainability research field a welcomed addition.

Preprocessing data for analysis

While it isn’t necessarily straightforward to acquire data from social media as has been communicated in previous blog posts (!), there’s always the challenge of starting to do something with the data once one has it. Spreadsheets offer one way to proceed as one often needs to pre-process data. While spreadsheets aren’t convenient in every endeavour, there’s a lot that can be done with them. Spreadsheets are good in partially automated stagewise working processes. Their outcomes can also be easily checked and re-checked, which is great.

We’ve used the freely available LibreOffice Calc to preprocess our data (https://www.libreoffice.org/discover/calc/). As we wish to examine co-occurrences between hashtags in posts, we wanted to process the post-by-post data into a csv file, which we could later import in Gephi (https://gephi.org/). Gephi includes a very useful plugin for creating networks from co-occurring hashtags so our job was simply to create a csv file with lines of hashtags. Another option would have been to establish pairwise co-occurrences in Calc.

Creating such a csv file was simple with API-acquired data as that was already very conveniently organized to our liking (i.e. the hashtags were already brought together in a dedicated spreadsheet column). Manually organized data were quite a different matter and required numerous steps, which we wouldn’t want to do with large data sets. The lesson learned is that it’s a good idea to work so that one doesn’t have to overly labour intensive preprocessing. With large data sets it may be even considered an essential prerequisite.

Acquiring data from Tumblr

We used Tumblr’s API to gather the data. It means, that we technically have access to the server of the platform. To gather the data and use the API, a Python script was created. The script allows us to perform several tasks: Automate the process; Combine separate chunks of data into a single .csv file; Continue the data collection process after the last checkpoint whenever the rate limit has been reached. It included a lot more manual work than expected. Sometimes the server would randomly jump from year, let’s say 2020 to 2018 with nothing in between. This would require to search for a date in between so that the server would again return the posts normally. For some tags, the server would only return old data (e.g., posts starting from 2015). Unfortunately nothing could be done about it, because we have no access to the server and can’t change the way it returns the data. Sometimes the server would return malformed data. This would result in invalid .csv file that would require manual inspection. Although, the API provides the capability to specify how many records to return on each request (up to 20), it often was not constant. Because of the reasons above, instead of leaving the script alone to gather the data, the process had to be constantly monitored.

Instagram data

There are over 12 600 posts with the hashtag ‘elevatorlife’ on Instagram. Not only does the #elevatorlife reflect consumer’s interpretation of elevator experience better than #elevator, but also the number of posts published stays rather reasonable. To ensure the quality of the material the data acquisition was performed manually.

On the workshop held in April we presented some of the qualified Instagram posts and also a few of the ones that didn’t meet the requirements. The qualified posts were publicly available, had at least one hashtag on their description in addition to #elevatorlife and published by an adult individual. Therefore, all posts with marketing interest or by commercial Instagram accounts were excluded. Also posts by elevator mechanics and meme accounts were not approved. Some posts met all the other requirements but the pictures had nothing to do with an elevator. These were not included as well as posts by accounts that rate elevators or collect other account’s posts.

As we noticed, consumers are inventive with their hashtags and similar looking posts differ from each other by the hashtags attached.

Next we’ll continue pre-processing the data and move forward with the other social media platforms.

Method development

Updates from the methodology team

Various tools to extract Instagram data has been used in previous research. However, these also include methods that are questionable, subsequently banned for research use or otherwise not fit for our research project objectives.

Fortunately, weekly methodology café sessions and discussions with university researchers on finding an applicable tool have proved to be helpful in every way and we will pursue on that.

While we continue our work with acquiring data from Instagram, we will prepare a demo with Twitter data for the meeting in May. A visualization tool will also be used to help the interpretation and to understand the scale of the results.

Methodologically advanced examination of consumer interpretations for refreshing sustainable urban life (MORE)

This research addresses the green transition and its social dimensions from a consumer perspective. It develops advanced network and script based methodologies for examining consumer interpretations of sustainability matters. The research task is to develop a proof-of-concept of how consumer generated interpretations of everyday sustainability in social media can be used in business settings. Current alternatives fall short because they focus on behavioral analytics or rely on insufficiently scalable qualitative approaches. The tested proof-of-concept connects to the roadmap of the ecosystem for sustainable solutions to support better people flow in urban environments led by KONE, and will be used in subsequent ecosystem co-innovation project focusing on refreshing sustainable urban life.

Advisory board appointed

We are glad and proud to announce our advisory board – together we are stronger!

Jaana Hyvärinen, Chair
Strategic Foresight Manager
Kone

Anna Martela
CEO
Kenno Consulting

Janne Korpi
Chief Analytics Officer
iloom.io

Topi Ahava
Account Director
Solita

Stay tuned!

Welcome to the web of the More project! We’re all about making sense of consumer interpretations of mundane technologies – for regeneration and circularity.

Päivi Timonen
paivi.timonen@helsinki.fi, +358 50 3433 138, research profile
Project visionary

Petteri Repo
petteri.repo@helsinki, +358 400 737 968, research profile
Methodological explorer

Maija Luoma
maija.x.luoma@helsinki.fi
Data wizard