This summer (nor the year) didn’t go quite as planned. Due to the work from home recommendation, the office was replaced by a kitchen table and coffee breaks turned into virtual ones. The CFT group had hired five summer students and here are their thoughts about their projects.
Jaakko Hällfors
During the summer I investigated the damping of primordial gravitational waves in early universe phase transitions. This phenomenon could be detected by the European Pulsar Timing Array (EPTA) in a potential stochastic gravitational wave background originating from, for example, cosmic inflation. While gravitational waves interact weakly at temperatures below 1016TeV, the expansion of the universe leaves its mark on the the energy spectrum. The expansion rate is determined by the thermodynamics of the universe, and therefore through the particle content and interactions. This yields an interesting connection between the gravitational wave background and high energy particle physics.
On the more practical side, my work consisted mostly of numerically solving differential equations with an assortment of precomputed equations of state as the parameters. In addition to gravitational waves originating from inflation, I also computed results for a model with sources that are active during the transitions. The differences in the resulting spectra could help distinguishing between alternative sources for the background.
Tiina Minkkinen
I worked on the LISA Data Challenge, which is a collaborative project organized by the LISA Consortium. The aim of the project is to develop tools and solve problems relating to the analysis of the actual LISA data – but since we have to wait for that for a little while longer, this challenge provides an exciting opportunity to practice with simulated data!
Our project focused on the analysis of a data set containing a stochastic gravitational wave background, which is a sort of a background hum from an indiscernible amount of GW sources at great distances. Relying on theoretical predictions on the power-law form of the GW background, I used the curve fit method to extract the signal from the data. This first challenge was a bit easier as the simulation parameters were given, so we knew what to look for. Still it kept me busy for the whole summer, and taught me more about coding than all the university courses I’d taken before that!
Riikka Seppä
I’m a bachelor student here at University of Helsinki. I learned a lot working with this group, and hope to learn even more in the future (hopefully back at the campus at some point). Most of the summer I ran 3D-lattice simulations on Kale, and then analysed the simulation results to see how magnetic monopoles behaved on different lattices.
To better visualize these results I decided to learn to use VisIt. This proved worthwhile, as after bit of a learning curve I was able to produce animations from the lattice data and saw how nicely magnetic monopoles annihilated during cooling. I think this showed very well why good visualizations are so important in science: I did already know from the data and earlier plots made with it that the monopoles would decrease during cooling, but it is a different thing altogether to really see it happen in front of your eyes. And, I can now show that video to people who might have very different background in physics and they too, would see those same monopoles annihilate, which might not have been very apparent otherwise.
Satumaaria Sukuvaara
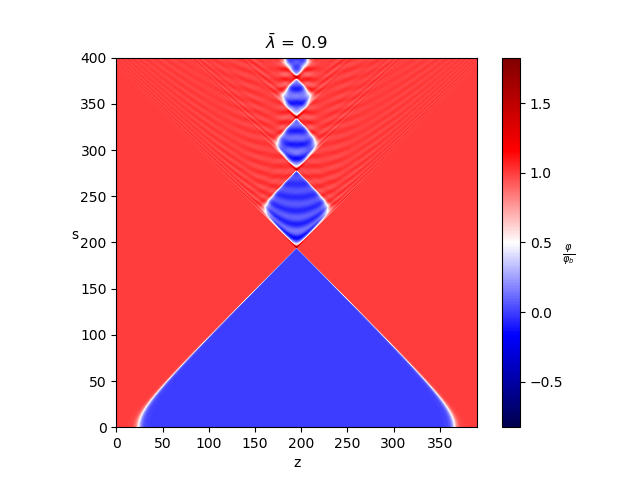
For the last two summers (and some of the time in between) I’ve been part of the computational field theory group, working on the dynamics of early universe phase transitions, bubbles and the gravitational wave spectrum they create. My project is focused on two bubble collisions. In my time working on this project, I’ve created codes for simulating two bubble collisions and for calculating their gravitational wave spectrum. Writing and testing the codes have definitely dominated my working time, but looking at the results and trying to interpret them have also been an important part of my work.

 Field evolution of two colliding thin (top) and thick (bottom) wall bubbles. In general, the red areas correspond to broken and the blues to symmetric phase, with φ/φb=0 being the symmetric minimum and φ/φb=1 the broken minimum. The z coordinate is the axis that goes through the centers of the bubbles, which are located on the edges of the plot. The simulation is done in hyperbolic coordinates and the coordinate s (s²=t²-r²) can treated as a time coordinate.
Essi Vilhonen
I started at the Computational Field Theory Group as a research assistant last summer, working on early universe droplets. These droplets occur in a first order phase transition of the cooling universe, where regions on the higher-temperature phase get trapped between the expanding bubbles of the cooler phase. Because the droplets are very hot, they fight against the bubbles, and thus change the amount of kinetic energy that gets transferred to the fluid.
We investigate this phenomenon with spherical simulations of ideal plasma as an approximation. So, my work is mainly running the simulations and writing codes to analyse the results, and trying to understand what’s going on. Working on research is not always easy, but I have enjoyed this work very much, and have been warmly welcomed by the group.

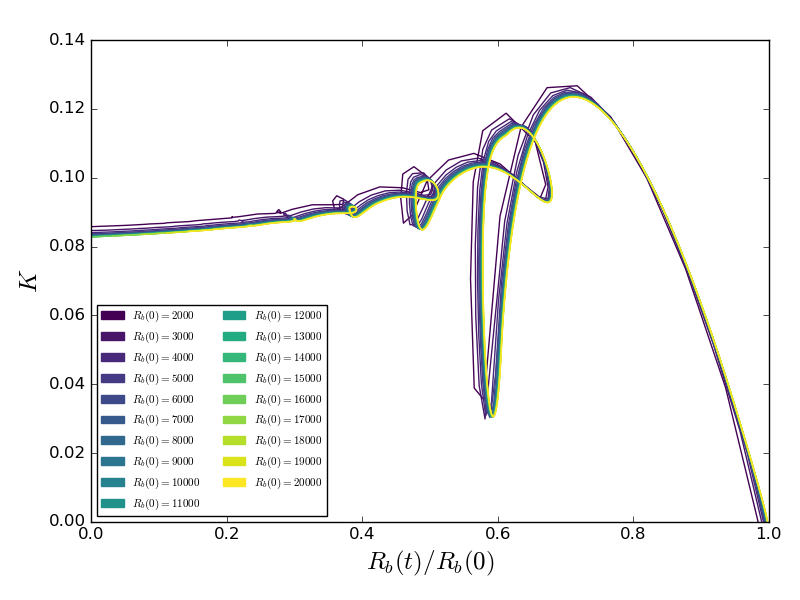
This plot shows the fraction of available vacuum potential energy that has been converted into kinetic energy of the plasma during the phase transition. This kinetic energy fraction K is shown on the vertical axis, the horizontal axis being
the radius of the droplet in time, Rb(t). The latter is normalised using the initial droplet radius Rb(0), and the different colours indicate different initial radii. These simulations have been made with a rather strong transition strength, α = 0.5, where the droplets are very hot.
The lines in different colours show a convergence towards larger initial radii. The loops of the graph indicate the heat of the droplet first slowing down the expansion of the bubble, and then even pushing the bubble wall backwards. Eventually this effect gets smaller, and the droplet decays upon reaching the origin.