
Author: Jussi Torkko
The highlights of the study
Throughout late 2020 and 2021, with the help of Digital Geography Lab, I did my master’s thesis on modelling and understanding how people experience greenery. Most often greenery is observed from a top-down point of view, through the sensors of aerial vehicles or satellites. However, we do not know sufficiently well how greenery measures captured from high above match the true greenery experience by the people on the ground level. This experienced greenery is termed human-scale greenery for this thesis. Methods for modelling and quantifying human-scale greenery are based on data sources like street view images or LiDAR. Similarly to the top-down perspective, it is not known how well these data and methods reflect the experience of people.
This lack of knowledge is what I set out to solve with this thesis. By comparing greenery assessments collected from people by interviews to modelled greenery values from the same locations, I was able to show that all tested greenery modelling methods have a strong linear relationship with the greenery that people experience. However, the results also revealed that the modelling methods underestimate the amount of greenery people perceive and that while the modelled values share a strong relationship with surveyed greenery, there are significant deviations between the modelled and perceived values. Also interestingly, methods created specifically for quantifying human-scale greenery do not always appear to have an advantage over traditional top-down greenery assessment methods.
While interviewing people, I also collected limited sociodemographic data of the respondents. I found that age may affect people’s relationship with greenery, but this could not be confirmed with certainty. However, it was clear that people with less experience of nature and belonging to the age group around 30 years were met more frequently at study sites with low greenery values than other groups of respondents. In future studies, additional attention should thus be given to how people can experience human-scale greenery. More detailed descriptions of the results for both modelled and sociodemographic pathways can be found in the thesis.
Why does greenery on human scale matter?
Even though our society changes to a more urbanized form, the presence of nature and greenery remains vital. Urban greenery is paramount to our quality of life and is linked to physical, social, and psychological benefits. The share of visible greenery has been found to affect how people perceive environments around them. Visible greenery has societal and health related effects that are different from the ones arising from the general presence of greenery. That is why we need to be able to capture how much greenery there is in our cities and to study it in more detail.
Assessing and quantifying human-scale greenery has nevertheless been a challenging task, even if it has been a subject of interest for research for almost half a century now. It is often highly individual how people experience greenery. Recently, however, researchers have made significant advancements in quantifying peoples’ perspectives on greenery by introducing novel, automated approaches and indices based on various sources of data. These methods try to simplify human perception and make it more accessible for research. In my thesis, I aimed to compare how the methods which have been developed to quantify human-scale greenery manage to capture it.
How did I study it?
The main methodological pathway for my thesis was an empirical study, where surveyed greenery assessments were compared to modelled greenery values. Also, sociodemographic variables were compared to greenery values to see if there were differences in how people in the survey experienced greenery.
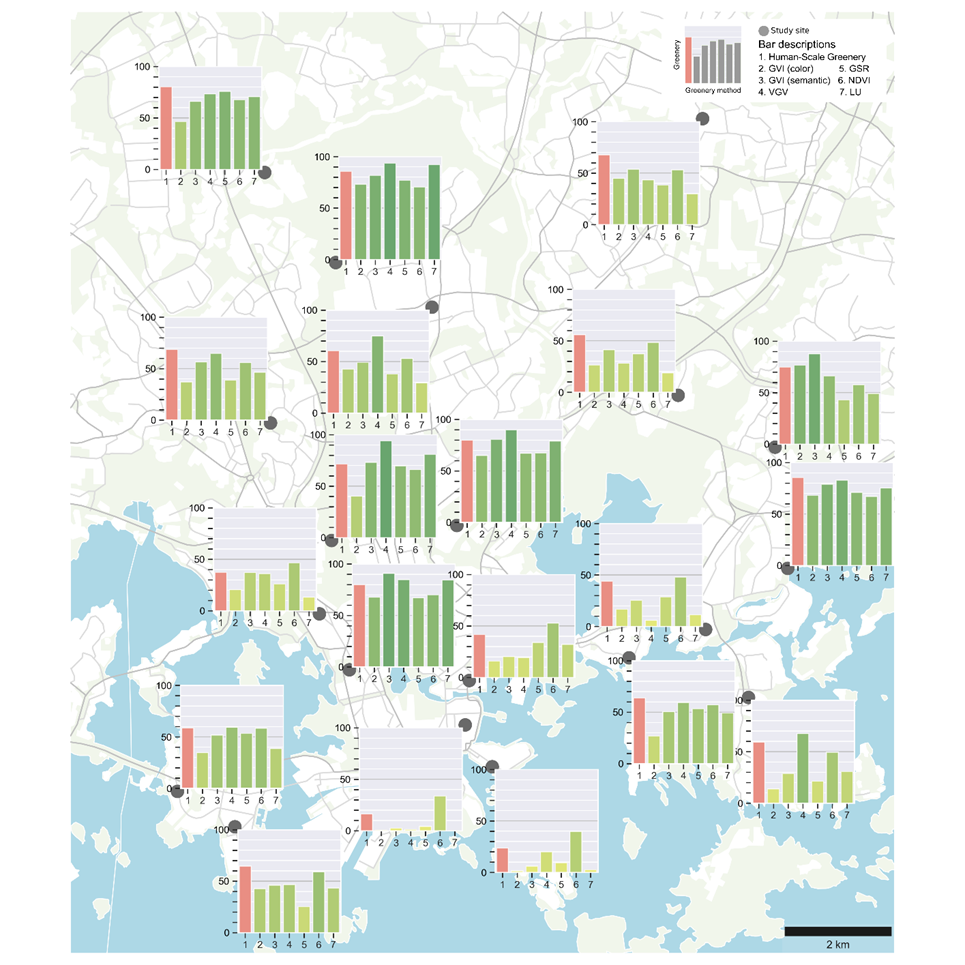
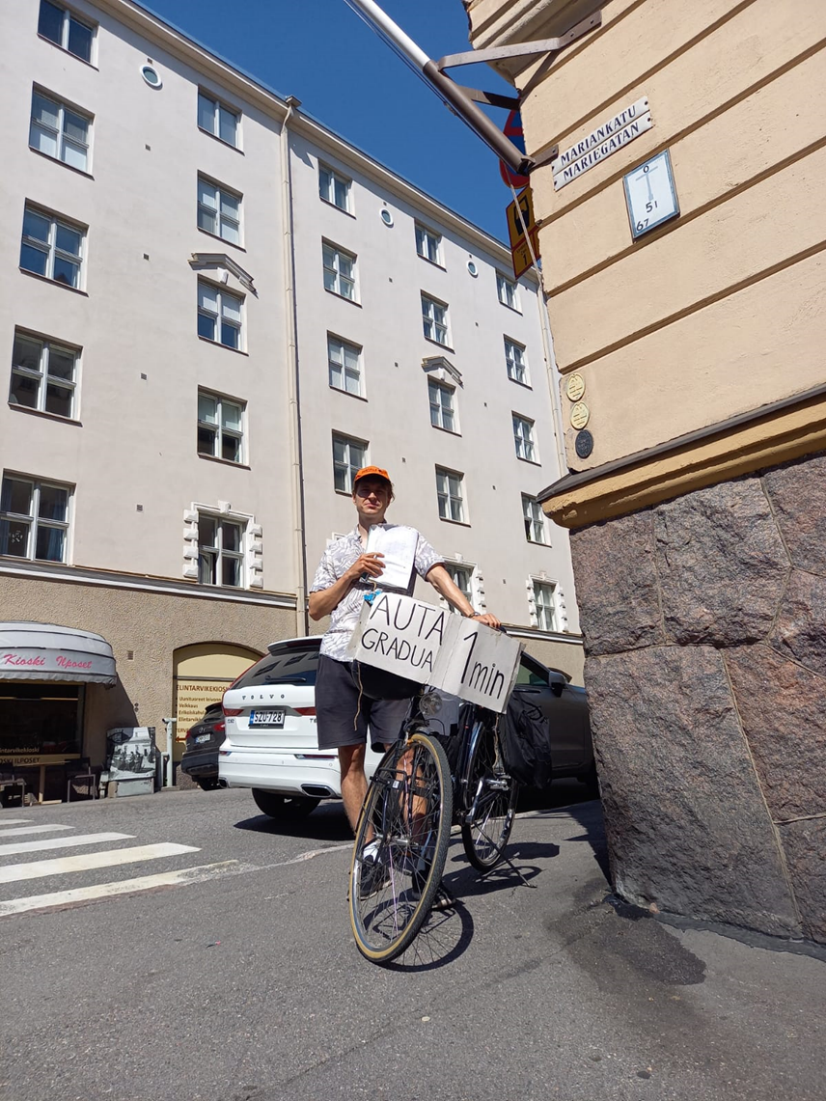
I collected human-scale greenery values from people at randomly sampled study locations around the City of Helsinki. In total, I included 20 study sites and interviewed 412 participants. I asked the participants to evaluate the interview location’s greenery level on a scale of 0 to 100. I also enquired about how frequently they visit nature next to some personal characteristics. These questions and answer ranges can be found from the thesis together with the pictures of the sites.
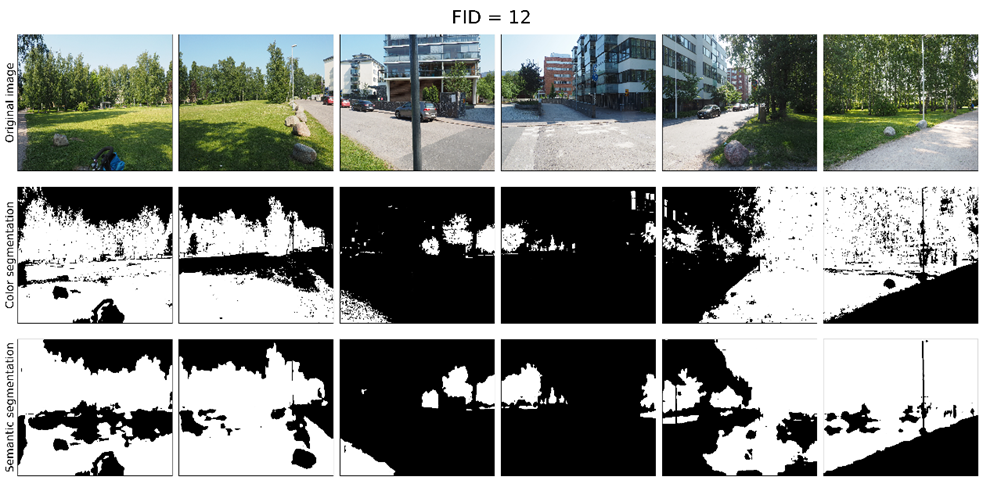
I used six different types of modelling methods to generate greenery values. These were two image-based methods that use color and semantic segmentation (color GVI, Semantic GVI), two LiDAR based methods that use point clouds and their derivates to evaluate the viewshed (VGVI, GSR), and two top-down methods including Normalized Difference Vegetation Index (NDVI) and land use assessment (LU). All the tested methods were normalized to the same scale with the interviews (from 0 to 100) if they had not been collected based on this scale already originally. More information about the methods and their usage can be found in the thesis.
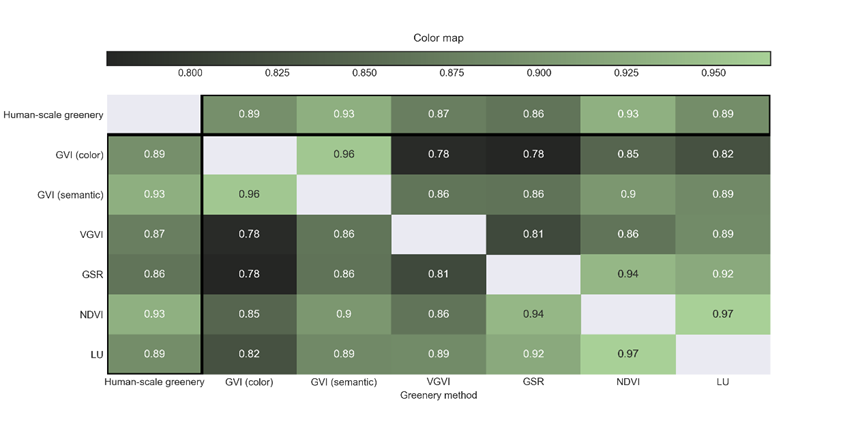
I compared the modelled and surveyed greenery values using three main methods: correlation analysis with Pearson (see the chart below), mean absolute error (MAE), and root mean square error (RMSE). I used Kruskal-Wallis one-way analysis of variance (ANOVA) for the sociodemographic comparison. In case I found significant differences, I inspected those further with Games-Howell posthoc tests. The sociodemographic comparison was done twice: the first time with the original data and the second time with the data that were normalized to the mean surveyed greenery value at each site to prevent demographic biases.
What comes next?
In the future, studies about human-scale greenery should focus more on the components and meaningfulness of greenery, instead of only quantifying the amount of greenery. Also, other senses than the visual might affect the experience of greenery. The impact of other visible aspects such as the amount of water or visible sky in urban environments could also be considered in greenery assessments. Further avenues for research are linking human-scale greenery measures with the indicators on the usage and access of green spaces as well as measuring the importance of seasonal change in greenery in cities like Helsinki where the leaves are on the trees less than half of the year.
This thesis provides evidence that new methods are applicable for evaluating the greenery that people experience in outdoor urban environments during their daily lives. However, questions remain on what they truly capture and how this should be integrated with traditional greenery assessment methods. Also, we need to further study which characteristics and factors affect how people experience or can experience greenery. Most likely, the best results will be gained with holistic attention to greenery using multiple diverse methods and perspectives. This thesis hopefully supports these further attempts trying to capture the essence of urban greenery.
Read the full MSc thesis here: Human-scale greenery: modelling and understanding the experience of people
This MSc thesis was done for the benefit of the UIA HOPE project (Urban Innovative Action HOPE – Healthy Outdoor Premises for Everyone). The thesis was supervised by Professor Tuuli Toivonen, Age Poom and Elias Willberg from the University of Helsinki’s Digital Geography Lab. The Digital Geography Lab is an interdisciplinary research team focusing on spatial Big Data analytics for fair and sustainable societies.
One Reply to “Modelling and understanding greenery on the scale of people: A look into Jussi Torkko’s MSc thesis”
Comments are closed.