
Fresh from the press, Jussi Torkko’s MSc thesis has been turned to an article, and it’s out in Frontiers in Sustainable Cities!
Torkko, J., Poom, A. Willberg, E. & Toivonen T. (2023) How to best map greenery from a human perspective? Comparing computational measurements with human perception, Frontiers in Sustainable Cities, 5, https://doi.org/10.3389/frsc.2023.1160995
Urban greenery has been shown to impact the quality of life in our urbanizing societies. While greenery is traditionally mapped top-down, alternative computational approaches have emerged for mapping greenery from the street level to mimic human sight. Despite the variety of these novel mapping approaches, it has remained unclear how well they reflect human perception in reality. We compared a range of both novel and traditional mapping methods with the self-reported perception of urban greenery at randomly selected study sites across Helsinki, the capital of Finland.
The mapping methods included both image segmentation and point cloud-based methods to capture human perspective as well as traditional approaches taking the top-down perspective, i.e., land cover and remote sensing-based mapping methods. The results suggest that all the methods tested are strongly associated with the human perception of greenery at the street-level. However, mapped greenery values were consistently lower than the perceived values.
Our results support the use of semantic image segmentation methods over color segmentation methods for greenery extraction to be closer to human perception. Point cloud-based approaches and top-down methods can be used as alternatives to image segmentation in case data coverage for the latter is limited. The results highlight a further research need for a comprehensive evaluation on how human perspective should be mimicked in different temporal and spatial conditions.
See a longer post about Jussi’s work in the lab blog 3/2022!
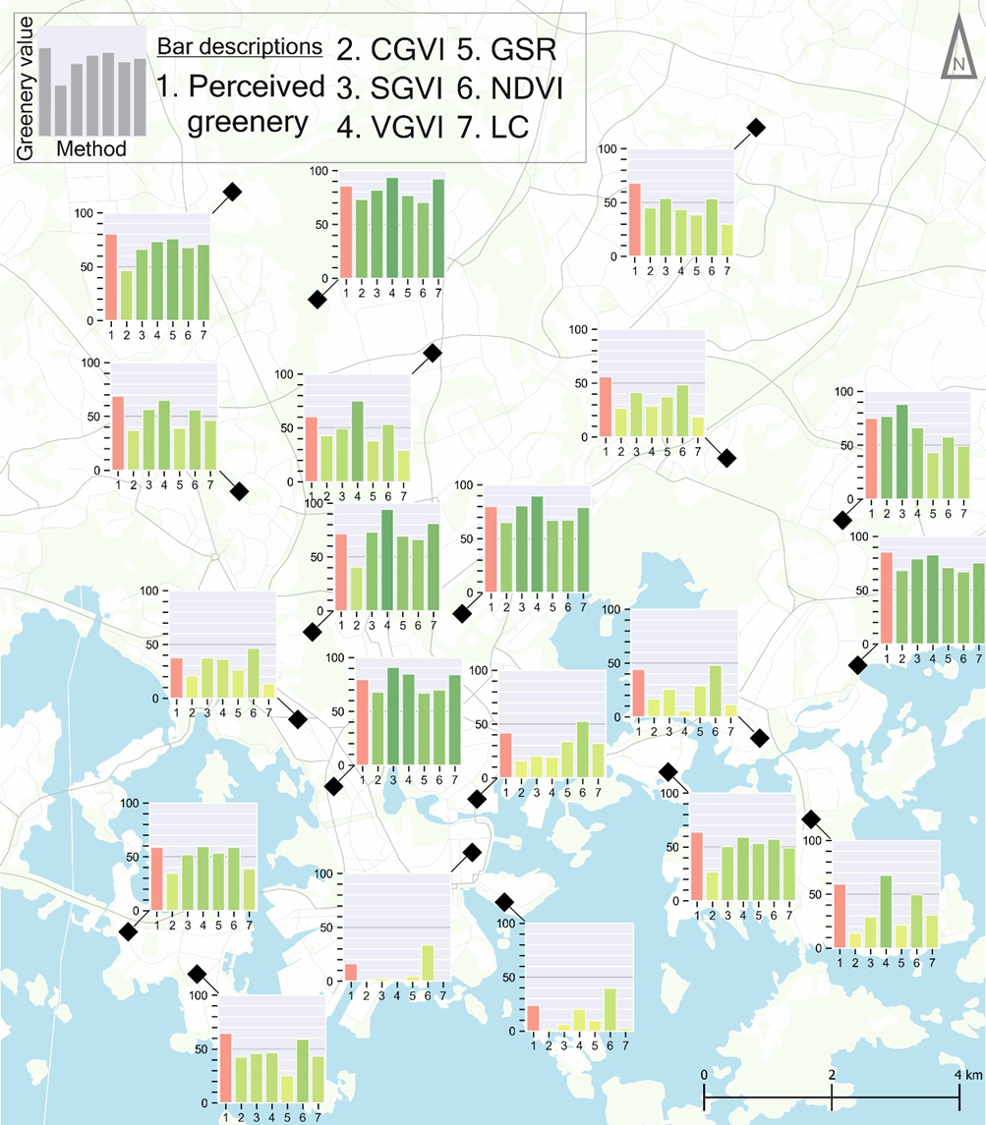
Figure 4. Mapped greenery values for the study sites. Vertical bar hue is weighted on the value with higher values having darker green hues and vice versa. Perceived greenery is highlighted in red for comparison.
The work relates to the finished Horizon 2020 funded HOPE-project (2019-21) and ongoing ERC funded GREENTRAVEL project at the Digital Geography Lab as well the Exposure to greenery and noise in active travel environments: opportunities for making cities pleasant, healthy and sustainable at the Mobility Lab of the University of Tartu.
The Digital Geography Lab is an interdisciplinary research team focusing on spatial Big Data analytics for fair and sustainable societies.