
Authors: Janika Raun, Olle Järv
MOPA (Monipaikkaisen asumisen rytmit, paikat ja asiakasryhmät) project revealing multi-local living patterns in South Savo based on electricity data analysis has reached its end. The project was led by the researchers from Ruralia Institute (Torsti Hyyryläinen, Manu Rantanen, Toni Ryynänen) and was done in collaboration with the Digital Geography Lab researchers Janika Raun, Olle Järv and Tuuli Toivonen.
AIM OF THE PROJECT
We started the project by thinking more broadly about how different big data sources could be utilised in second home research. We first provided an overview on the potential use cases in Finnish (Raun & Järv 2022), which then finally resulted in a coherent perspective paper, “New avenues for second home tourism research using big data: prospects and challenges”, published in the Current Issues in Tourism Research (Raun et al., 2022). The article is available open access here: https://doi.org/10.1080/13683500.2022.2138282.
Our literature analysis for the article revealed that so far utility consumption data has been used relatively little in second home and multi-locality research. However, it has a high potential to uncover where second homes are located and when they are actually used and visited. Thanks to the fruitful collaboration between Ruralia Institute and the local electricity company Suur-Savon Sähkö Oy we were able to use monthly-level electricity consumption data of second homes and analyse what it can tell us about the multi-local living practises in South Savo. Our aim was to understand the spatiotemporal rhythms, variations, and trends in second home usage patterns and identify different user groups. Read more about the start and aims of the project from one of our previous blog posts.
WHAT WERE THE MAIN RESULTS?
Electricity consumption in second homes increased during the COVID-19 pandemic.
Our results reveal that the electricity consumption in second homes has increased, especially during the years 2020 and 2021, indicating the intensified usage of second homes during the pandemic. The increase was biggest in areas with the highest relative share of free-time residences, such as Hirvensalmi, Mäntyharju, and Puumala municipalities. This finding is in line with the results of a previous study made in Finland using mobile phone data, which indicated that people escaped from cities when the pandemic started, and the increase of people was biggest in municipalities with the highest relative share of second homes (Willberg et al., 2021; and DGL blog posts here). The increase in electricity consumption was highest during the spring and autumn months, indicating that people extended their summer season and spent more time in their second homes also late spring and early autumn (Figure 1).
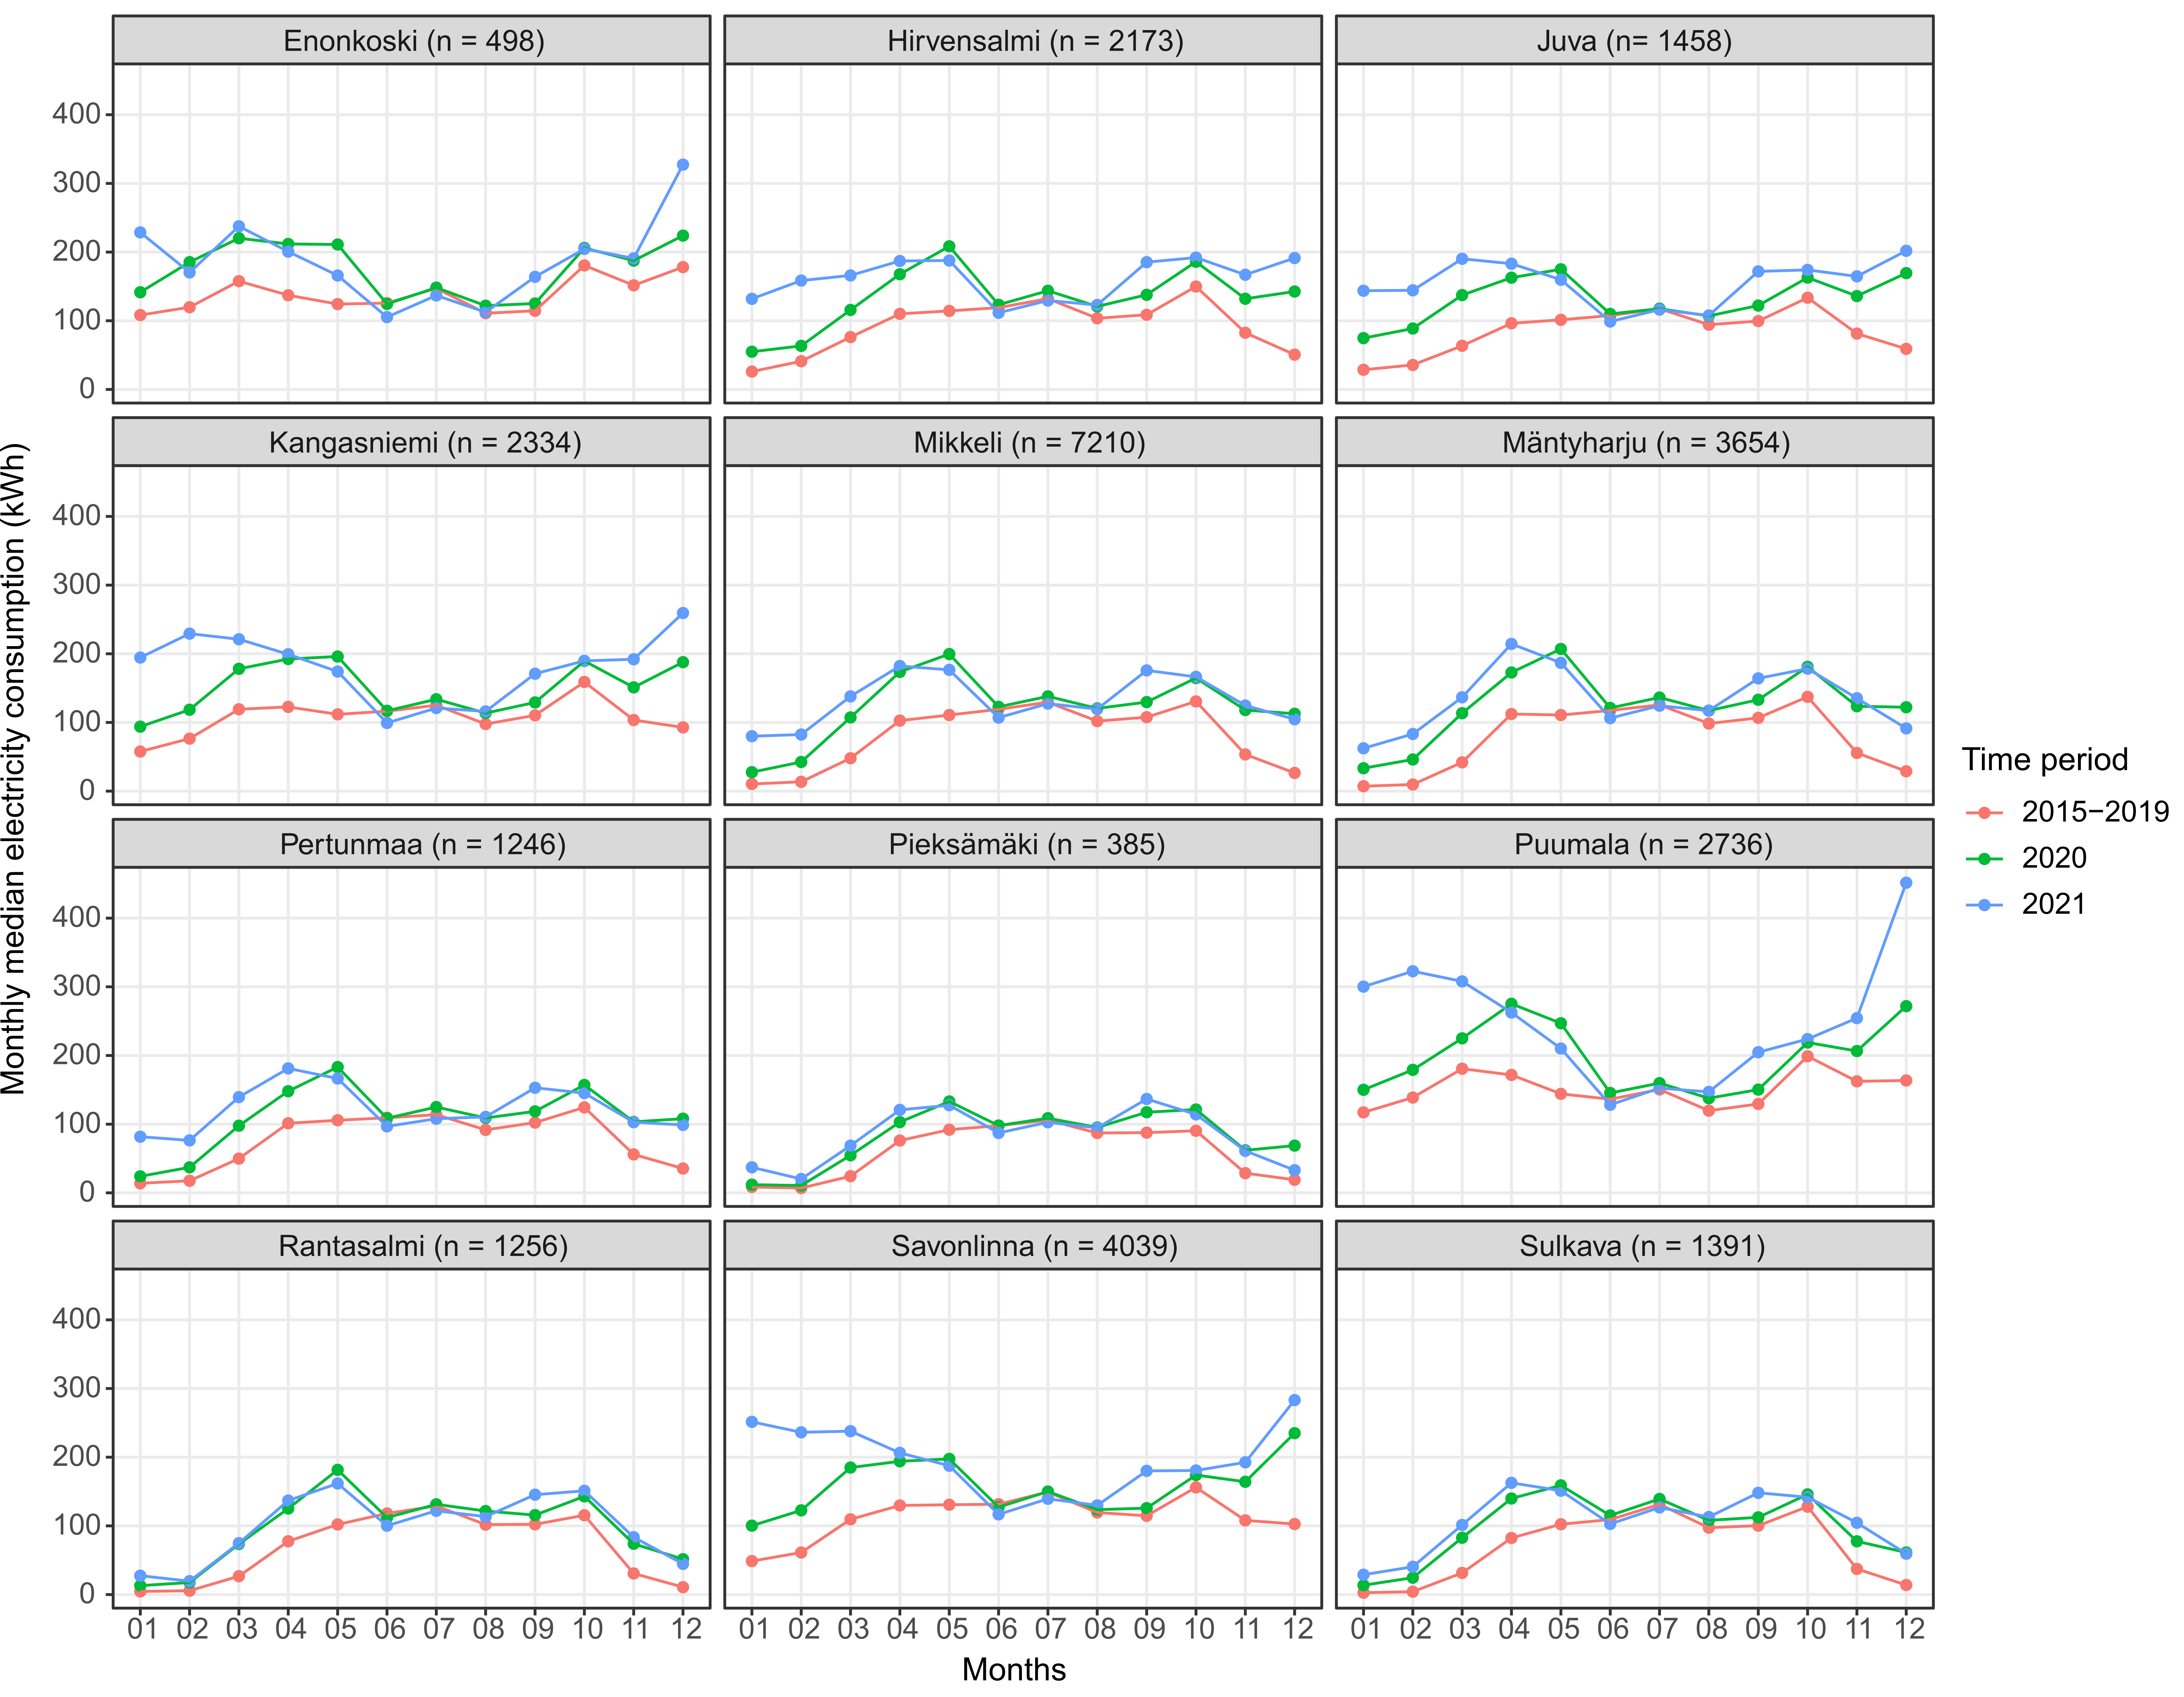 Figure 1. Monthly median electricity consumption (kWh) in municipalities during three periods: average for 2015-2019, 2020 and 2021. N represents the number of free-time residences in January 2021.
People living closer to their second homes also use them more often during the off-season.
It is important to note that the distance between the primary home and the second home plays a major influence on consumption patterns. Luckily the electricity data includes information about the home municipality of the owner, and based on that, we know that 1/3 of the owners live in the South Savo region, 1/4 live in the metropolitan area of Helsinki (including Vantaa, Espoo, and Kauniainen), and the rest live in some other places in Finland. We found out that people living and also having their second home in South Savo use more electricity during winter months in their second homes compared to people living outside of South Savo (Figure 2). This means they are either visiting their second homes more often or at least have the minimum heating on to keep the places warm.
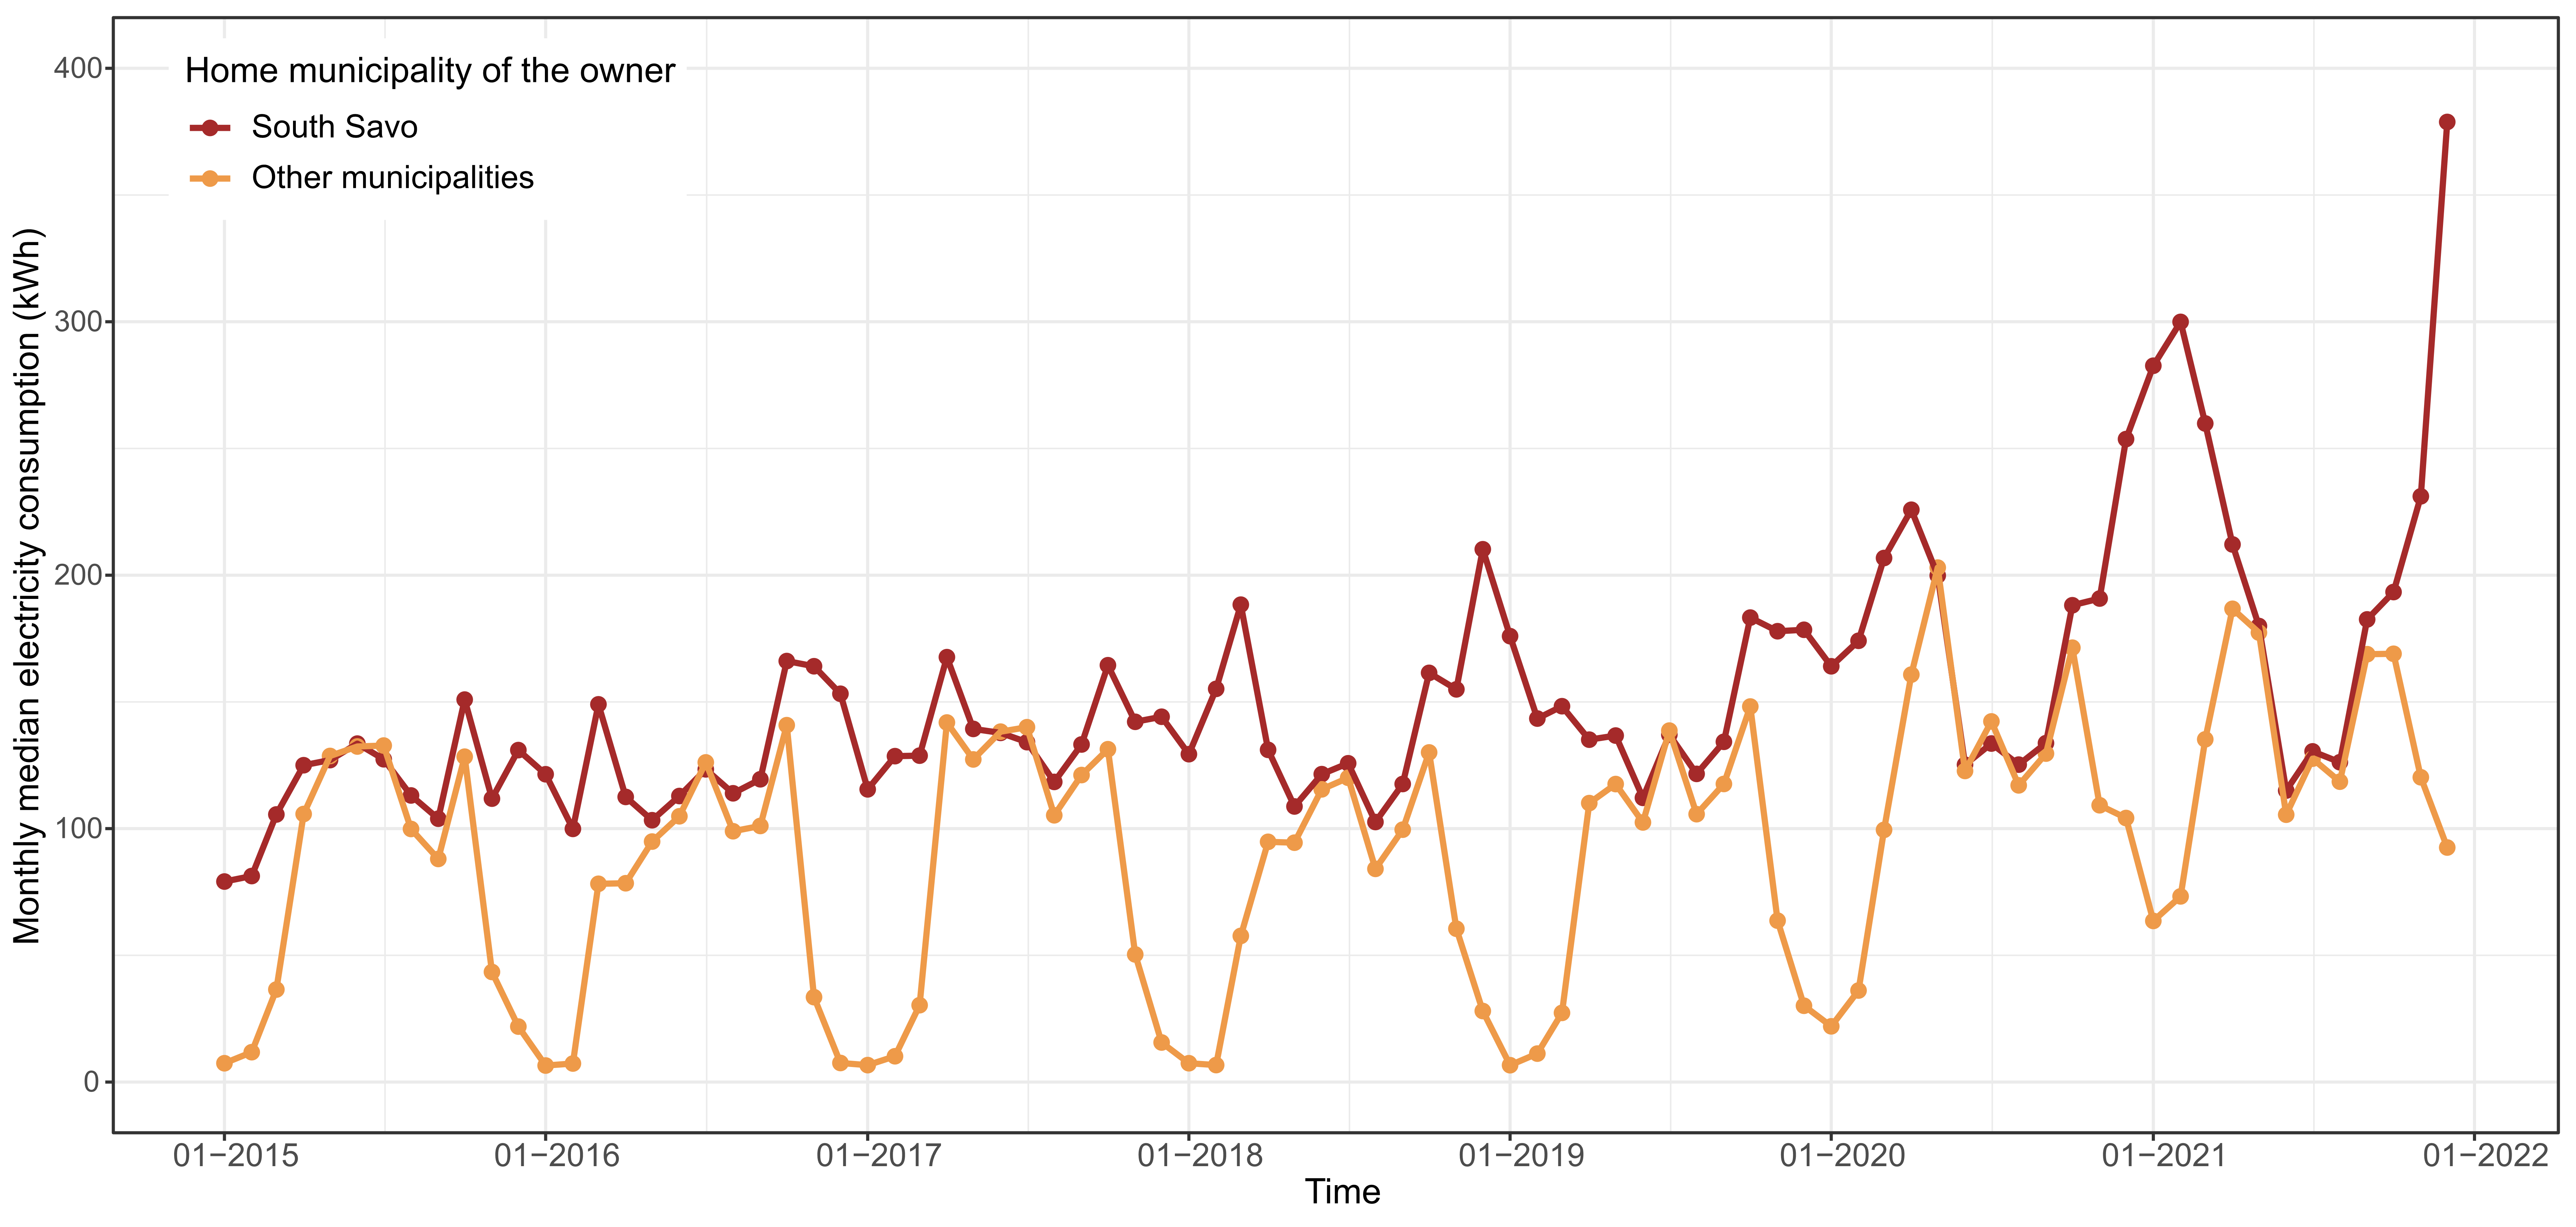 Figure 2. The monthly median electricity consumption (kWh) depends on the location of the home municipality.
Half of the second homes have some electricity consumption throughout the year.
Thanks to the long-term consumption patterns, we developed a methodology to determine whether a residence was occupied in a particular month. For validating the method, we used monthly-level mobile phone presence data from Telia Crowd Insights. This methodology is explained in more detail in Iivari Laaksonen’s MSc thesis and in one of our previous blog posts. Using that methodology, we found out that during summer months, more than 80% of the free-time residences are occupied, but during winter months, the occupancy levels are only around 50% (Figure 3).
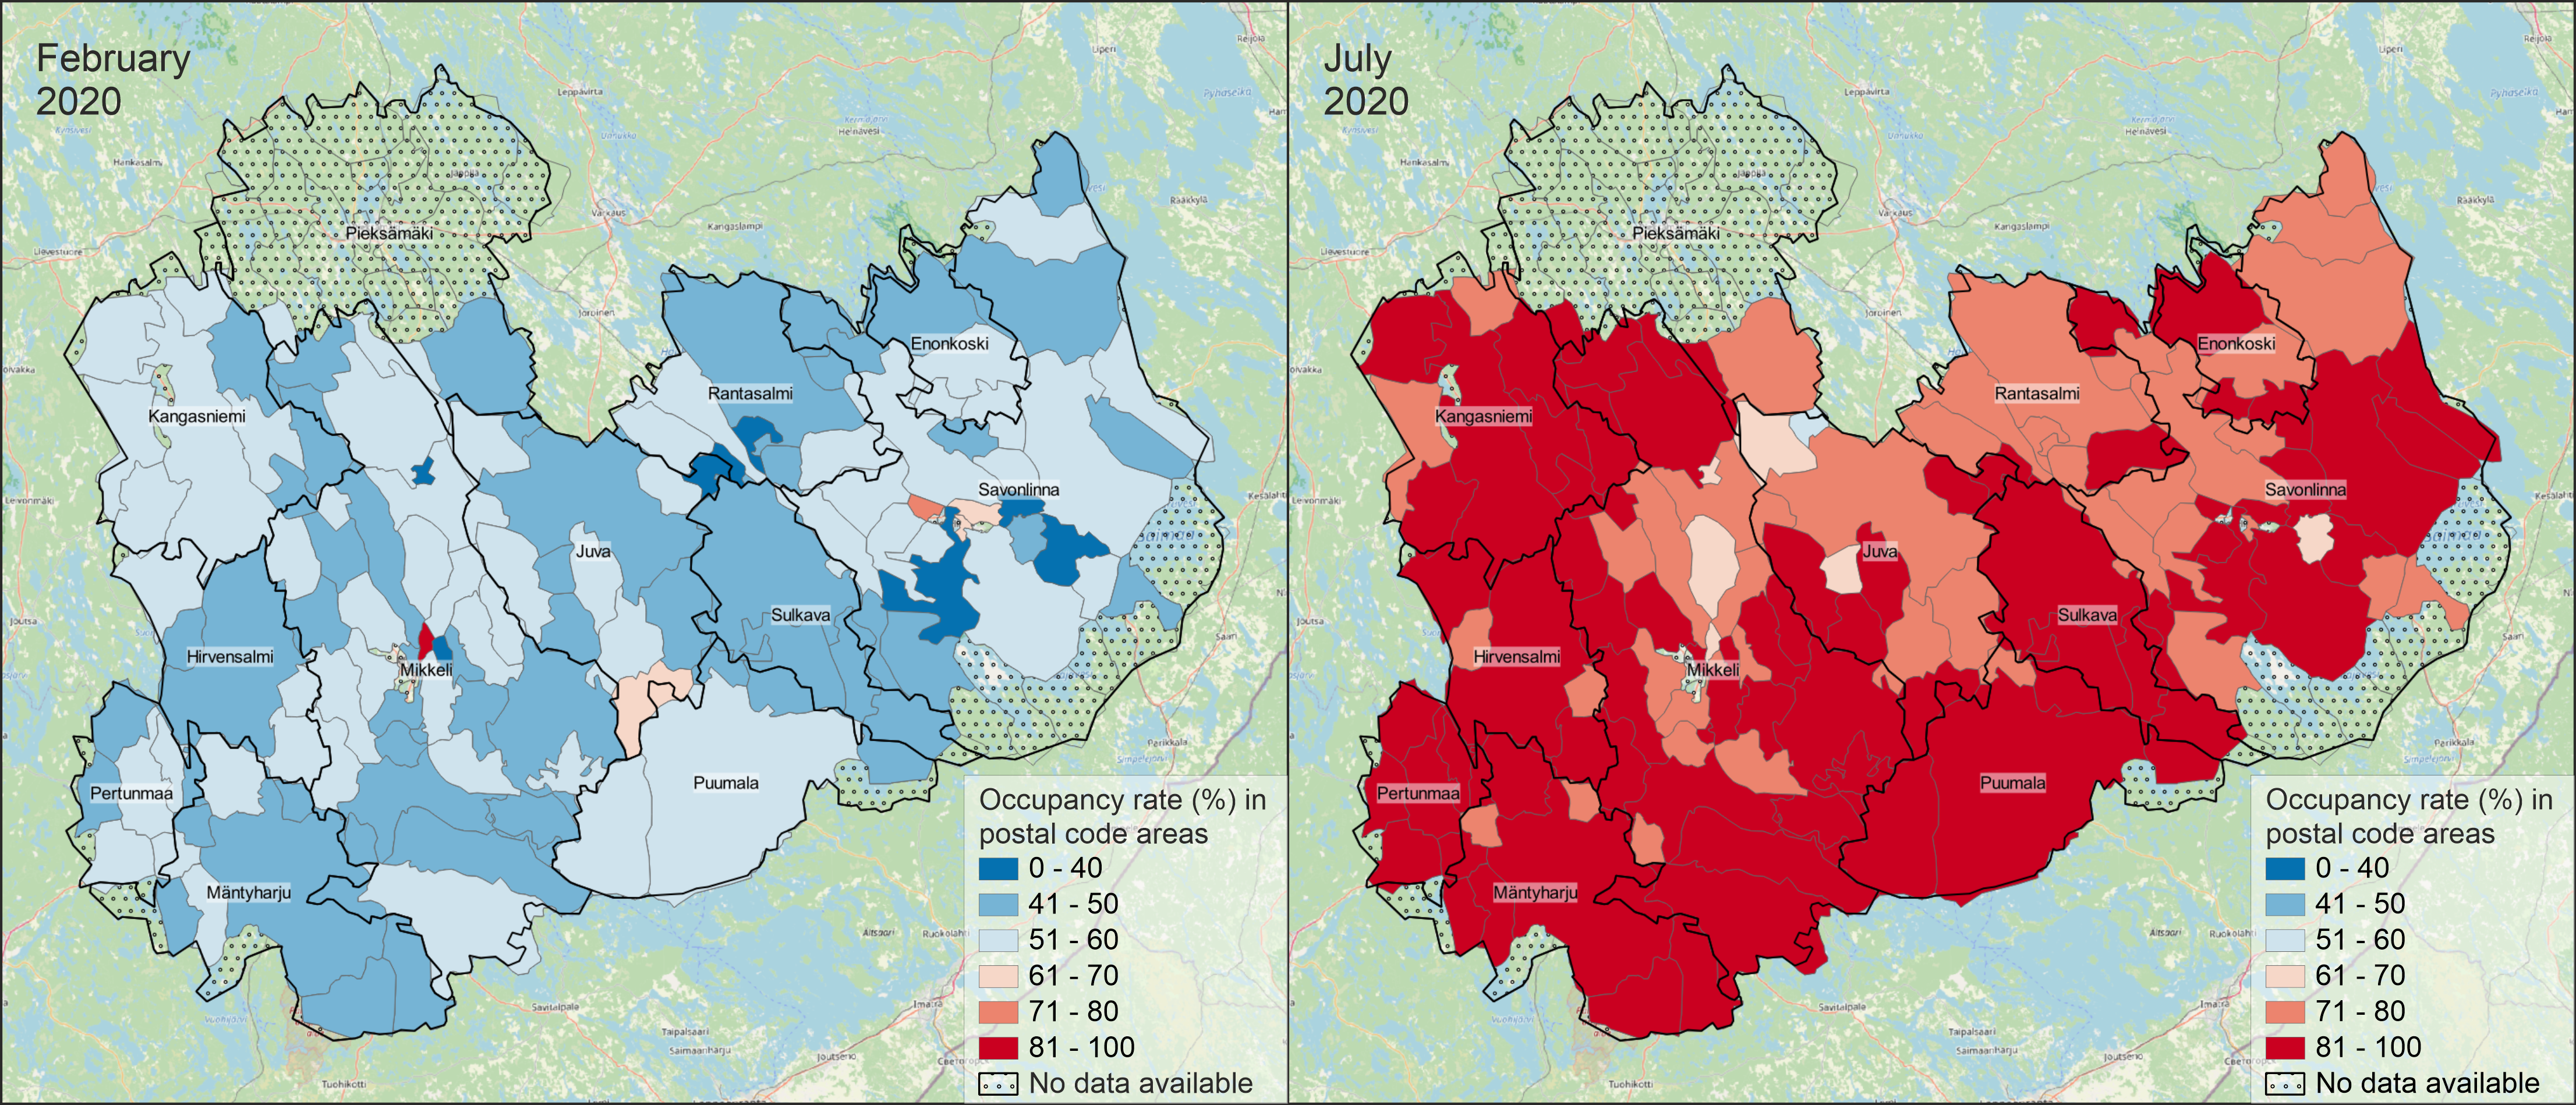 Figure 3. Occupancy rate (%) in South Savo postal code areas in February (left) and July (right) 2020.
In addition, based on occupancy information, we could identify three main usage types. The first and the biggest group (up to 60%) are residences occupied throughout the year (ca 9-12 months). In this group, the share of residences owned by people living in South Savo is the highest, indicating their more intense usage patterns again. The second group (ca 35%) consists of summer-use residences that are in active use during the warm summer season, roughly from April to October. The third and smallest group consists of residences that are either not used at all or are used only for a few months per year. Interestingly, the share of properties being used 9-12 months per year has increased throughout the seven years at the expense of summer users, indicating the increased time spent at second homes again. More results can be found in the project report published in Finnish.
FUTURE RESEARCH PERSPECTIVES
Our analysis and results confirm and illustrate the potential of electricity consumption data in understanding second home usage types and uncovering long-term trends. The use of temporally and spatially more detailed data in the future will enable the provision of even more detailed information to the local stakeholders, e.g., for providing better services. Clearly, electricity data does not replace traditional data sources but complements them and provides supplementary information about second home usage. Research combining electricity data with traditional data sources is the most desirable way forward as it provides a holistic understanding of second homes and multi-local living.
Last but not least, this project was an excellent example of a successful collaboration between experts in big data and spatial analytics, and second home research, but also between academic institutions and the private sector.
Read the full version of the perspective paper:
Raun, J., Järv, O., Okkonen, P., Rantanen, M., Hyyryläinen, T., Ryynänen, T., & Toivonen, T. (2022). New avenues for second home tourism research using big data: prospects and challenges. Current Issues in Tourism. https://doi.org/10.1080/13683500.2022.2138282
Read more about the results of the MOPA project from the reports published in Finnish:
Raun, J., Rantanen, M., Järv, O., Okkonen, P., Laaksonen, I., & Hyyryläinen, T. (2022). MONIPAIKKAISEN ASUMISEN RYTMIT ETELÄ-SAVOSSA Sähkönkulutustiedot vapaa-ajanasuntojen käytön analysoinnissa. (Ruralia-instituutti. Raportteja; Nro 222). University of Helsinki, Ruralia Institute. http://hdl.handle.net/10138/350786
Raun, J., & Järv, O. (2022). Uudet aineistolähteet monipaikkaisen asumisen ymmärtämisessä. teoksessa. In M. Rantanen, & T. Pihkala (Eds.), Aika lähteä mökille: Kestävän vapaa-ajan asumisen kehittäminen Etelä-Savossa (pp 29-40). (Ruralia-instituutti. Raportteja; Nro 217). University of Helsinki, Ruralia Institute. http://hdl.handle.net/10138/345152
Read Iivari Laaksonen’s MSc thesis on multi-local living:
Laaksonen, I. (2022). Multi-local living: a comparison between mobile phone and electricity consumption data. MSc thesis. University of Helsinki. http://urn.fi/URN:NBN:fi:hulib-202206102263
– – – – –
Digital Geography Lab is an interdisciplinary research team focusing on spatial Big Data analytics for fair and sustainable societies.