
Olle Järv, Elias Willberg, Tuomas Väisänen, Tuuli Toivonen
According to Statistics Finland (2018), there are more than half a million summer cottages around Finland. They are mostly located in rural areas close to waterbodies – lakes and seaside. In a country with 2.7 million households, such a high number of cottages may change the population patterns drastically once people would move to their cottages in large numbers. This is a potential risk during the epidemic outbreak such as the COVID-19 – health care services are designed mostly based on the permanent population and the cottage dwellers might break the balance in sparsely populated areas. Our preliminary findings already indicated that despite travelling restrictions due to the COVID-19 outbreak in Finland many people escaped from big cities to their summer cottage, see here. But was it really the lure of the summer cottages that explain the mobility patterns to more rural countryside?
Method: We used anonymised and aggregated mobile network data from Telia Crowd Insights such as activity location data as in our previous analyses, and further examined trip data between municipalities. Activity location data indicates the presence of people in a municipality – once a person stays at least 20 minutes in one municipality during one day, then his/her presence is counted as one activity location in given municipality. For example, when having a longer lunch break in a gas station during a long-distance travel. Thus, a person can have several activity locations in different municipalities each day. Trip data is calculated between the two consecutive activity locations at municipality level. In trip data, actual long-distance travel is counted as two different trips, if a longer break is taken during travelling. For example, travel from Helsinki to Rovaniemi by train via Jyväskylä is counted as two trips in data, because train stops at Jyväskylä longer than 20 minutes. These nuanced must be taken into account while reasoning findings.
Findings: We compared the change in the number of people in municipalities and the relative distribution of summer cottages. We found a strong proof that urban dwellers did escape to their summer cottages amid the COVID-19 outbreak. Mobility flows to summer cottages started already after the first official guidance on 12th March, and people were in their second-homes already before travelling restrictions were made official by the government. Data indicates that on average some 370 additional people for every 1000 summer cottages in a municipality arrived to a municipality towards the end of March.
To analyse the phenomenon further, we chose six municipalities for further analysis. All of these municipalities are rich in summer cottages and showed increasing number of dynamic population during the COVID-19 outbreak. We analysed the flow of people using aggregated and anonymized trip data (see above).
The mobility flows show varying geographical catchment areas for different municipalities, indicating also different risk levels of potential virus spreading outbreak. Municipalities in Central Finland received people from more diverse directions, whereas in coastal areas and closer to country border origins of mobility is more concentrated to close by municipalities or other shoreline locations. Thus, from the perspective of human mobility, summer cottage areas in the central parts of the country play stronger mediating role for virus transmission between different regions in Finland.

Figure 1. The linear correlation between the increase of people compared to typical workdays and the relative amount of summer cottages per 1000 inhabitants at municipality level gives the correlation coefficient 0.75. Municipalities in the Åland Islands are excluded from the correlation as ferry passengers passing through the archipelago affect their data. On average, municipalities gained some 11 % of additional people in case of municipalities that increased the presence of people in the last week of March compared to the baseline week (n = 174).

Figure 2. Temporal dynamics of temporary population compared to the baseline working days (average from Mon 3.2. to Thu 6.2.) in case of six well-known ”summer cottage” municipalities in Finland. In addition to typical weekend visits to summer cottages, people stayed there also during the winter holiday season (15.2-8.3). After just a couple of typical workdays people started to move back to their summer cottages since Thursday (12.3.) regarding the COVID-19 outbreak, but with much higher volume.
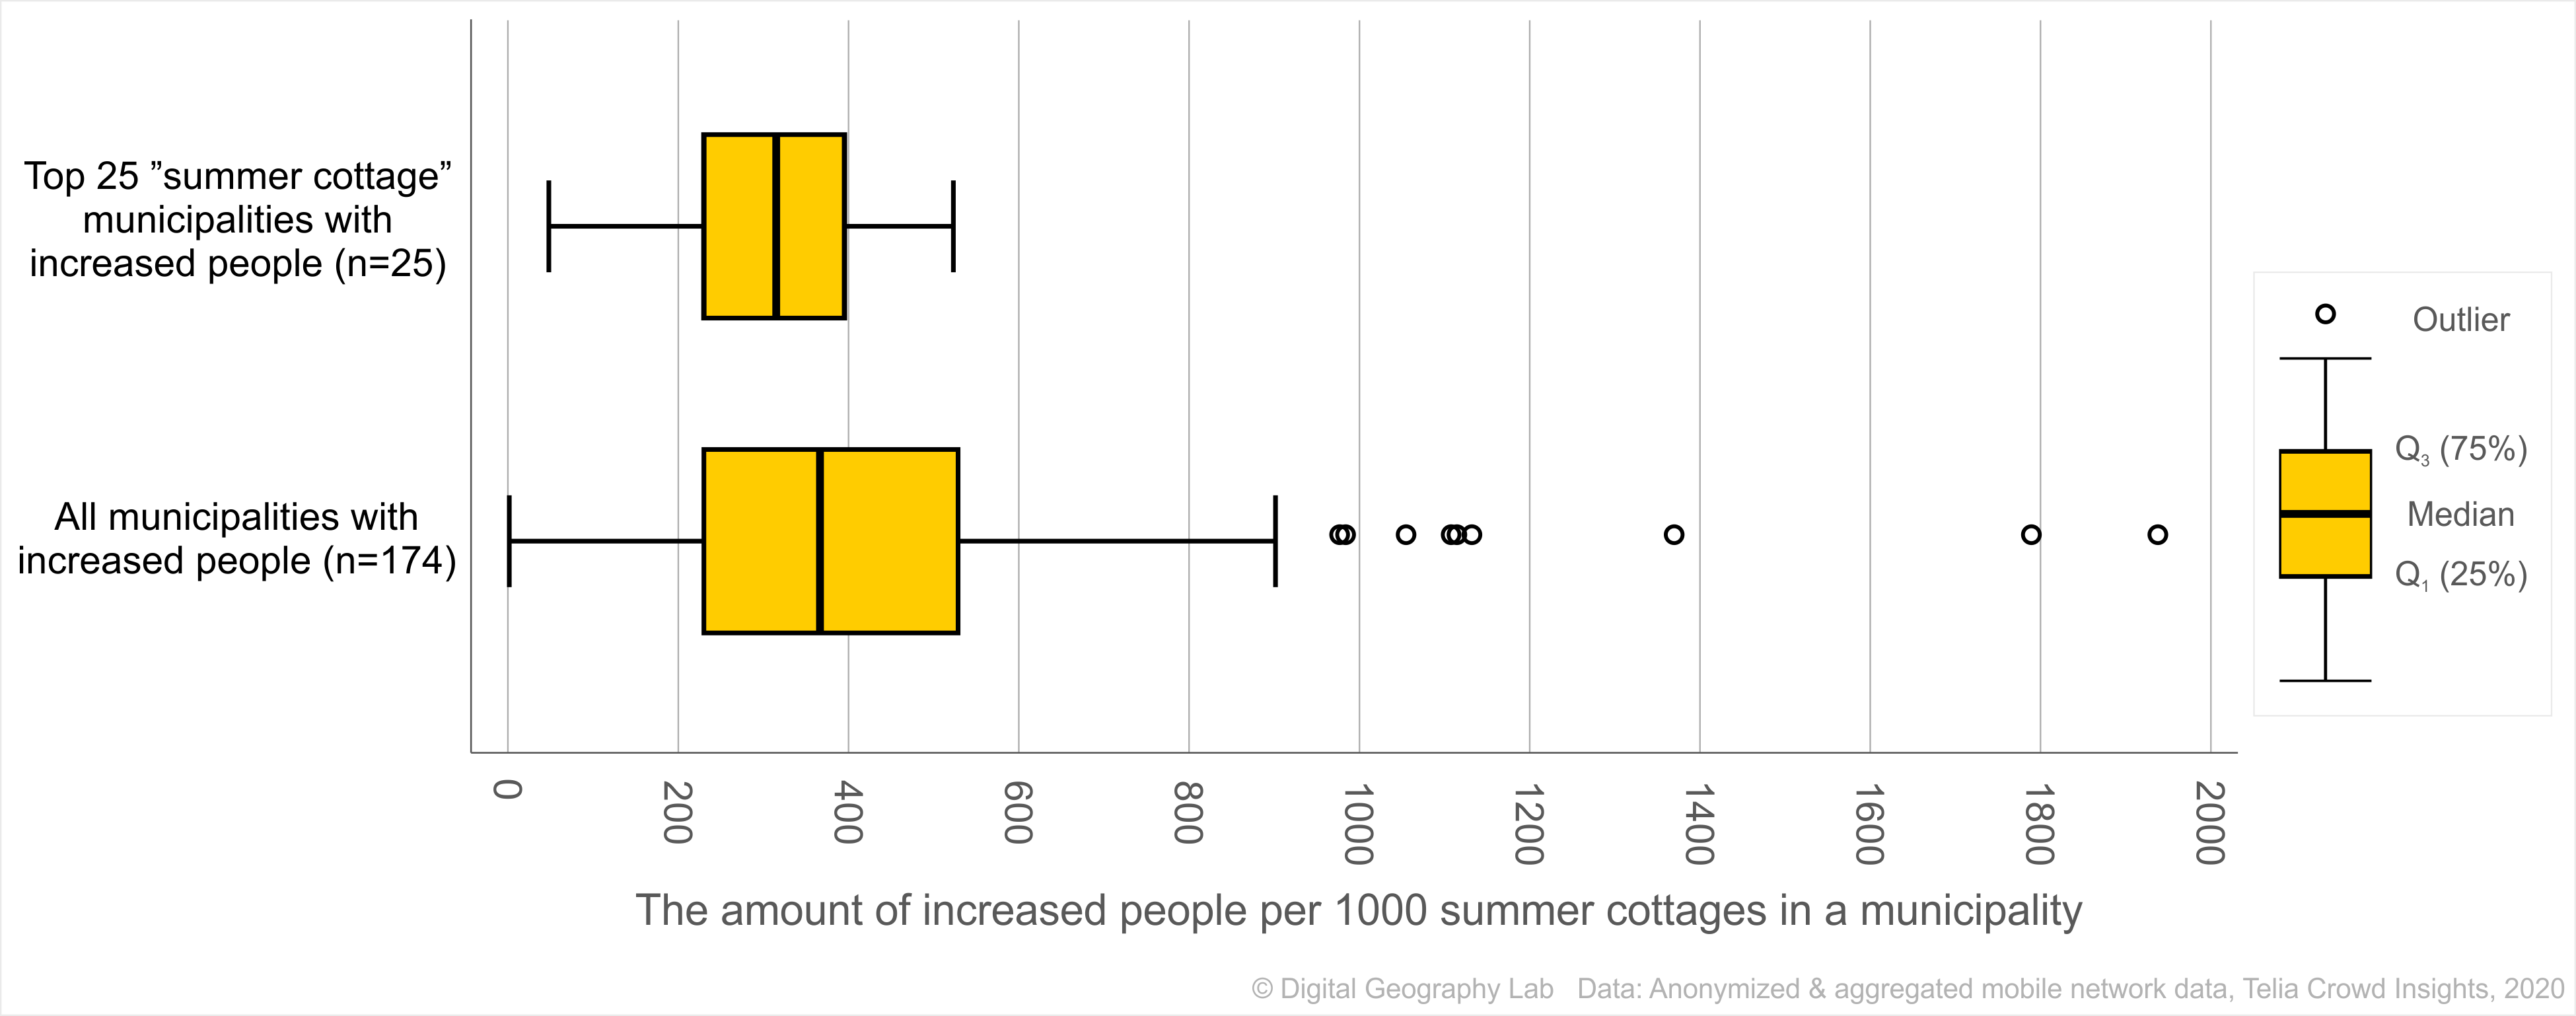
Figure 3. We approximated the “occupancy” of summer cottages while people escaped cities due to the COVID-19 crisis. The amount of increased people per 1000 summer cottages in a municipality is considered as an indicator for the summer cottage “occupancy”. We examined municipalities that increased the presence of people in the last week of March compared to the baseline week (n = 174). These municipalities gained some 370 additional people per 1000 summer cottages in a municipality, on average. Half of these municipalities gained additional people from 230 to 530 per 1000 summer cottages. More specifically, we rank ordered municipalities by summer cottage count per inhabitants and selected top 25 “summer cottage” municipalities – half of these municipalities gained additional people from 230 to 400 per 1000 summer cottages in a municipality.

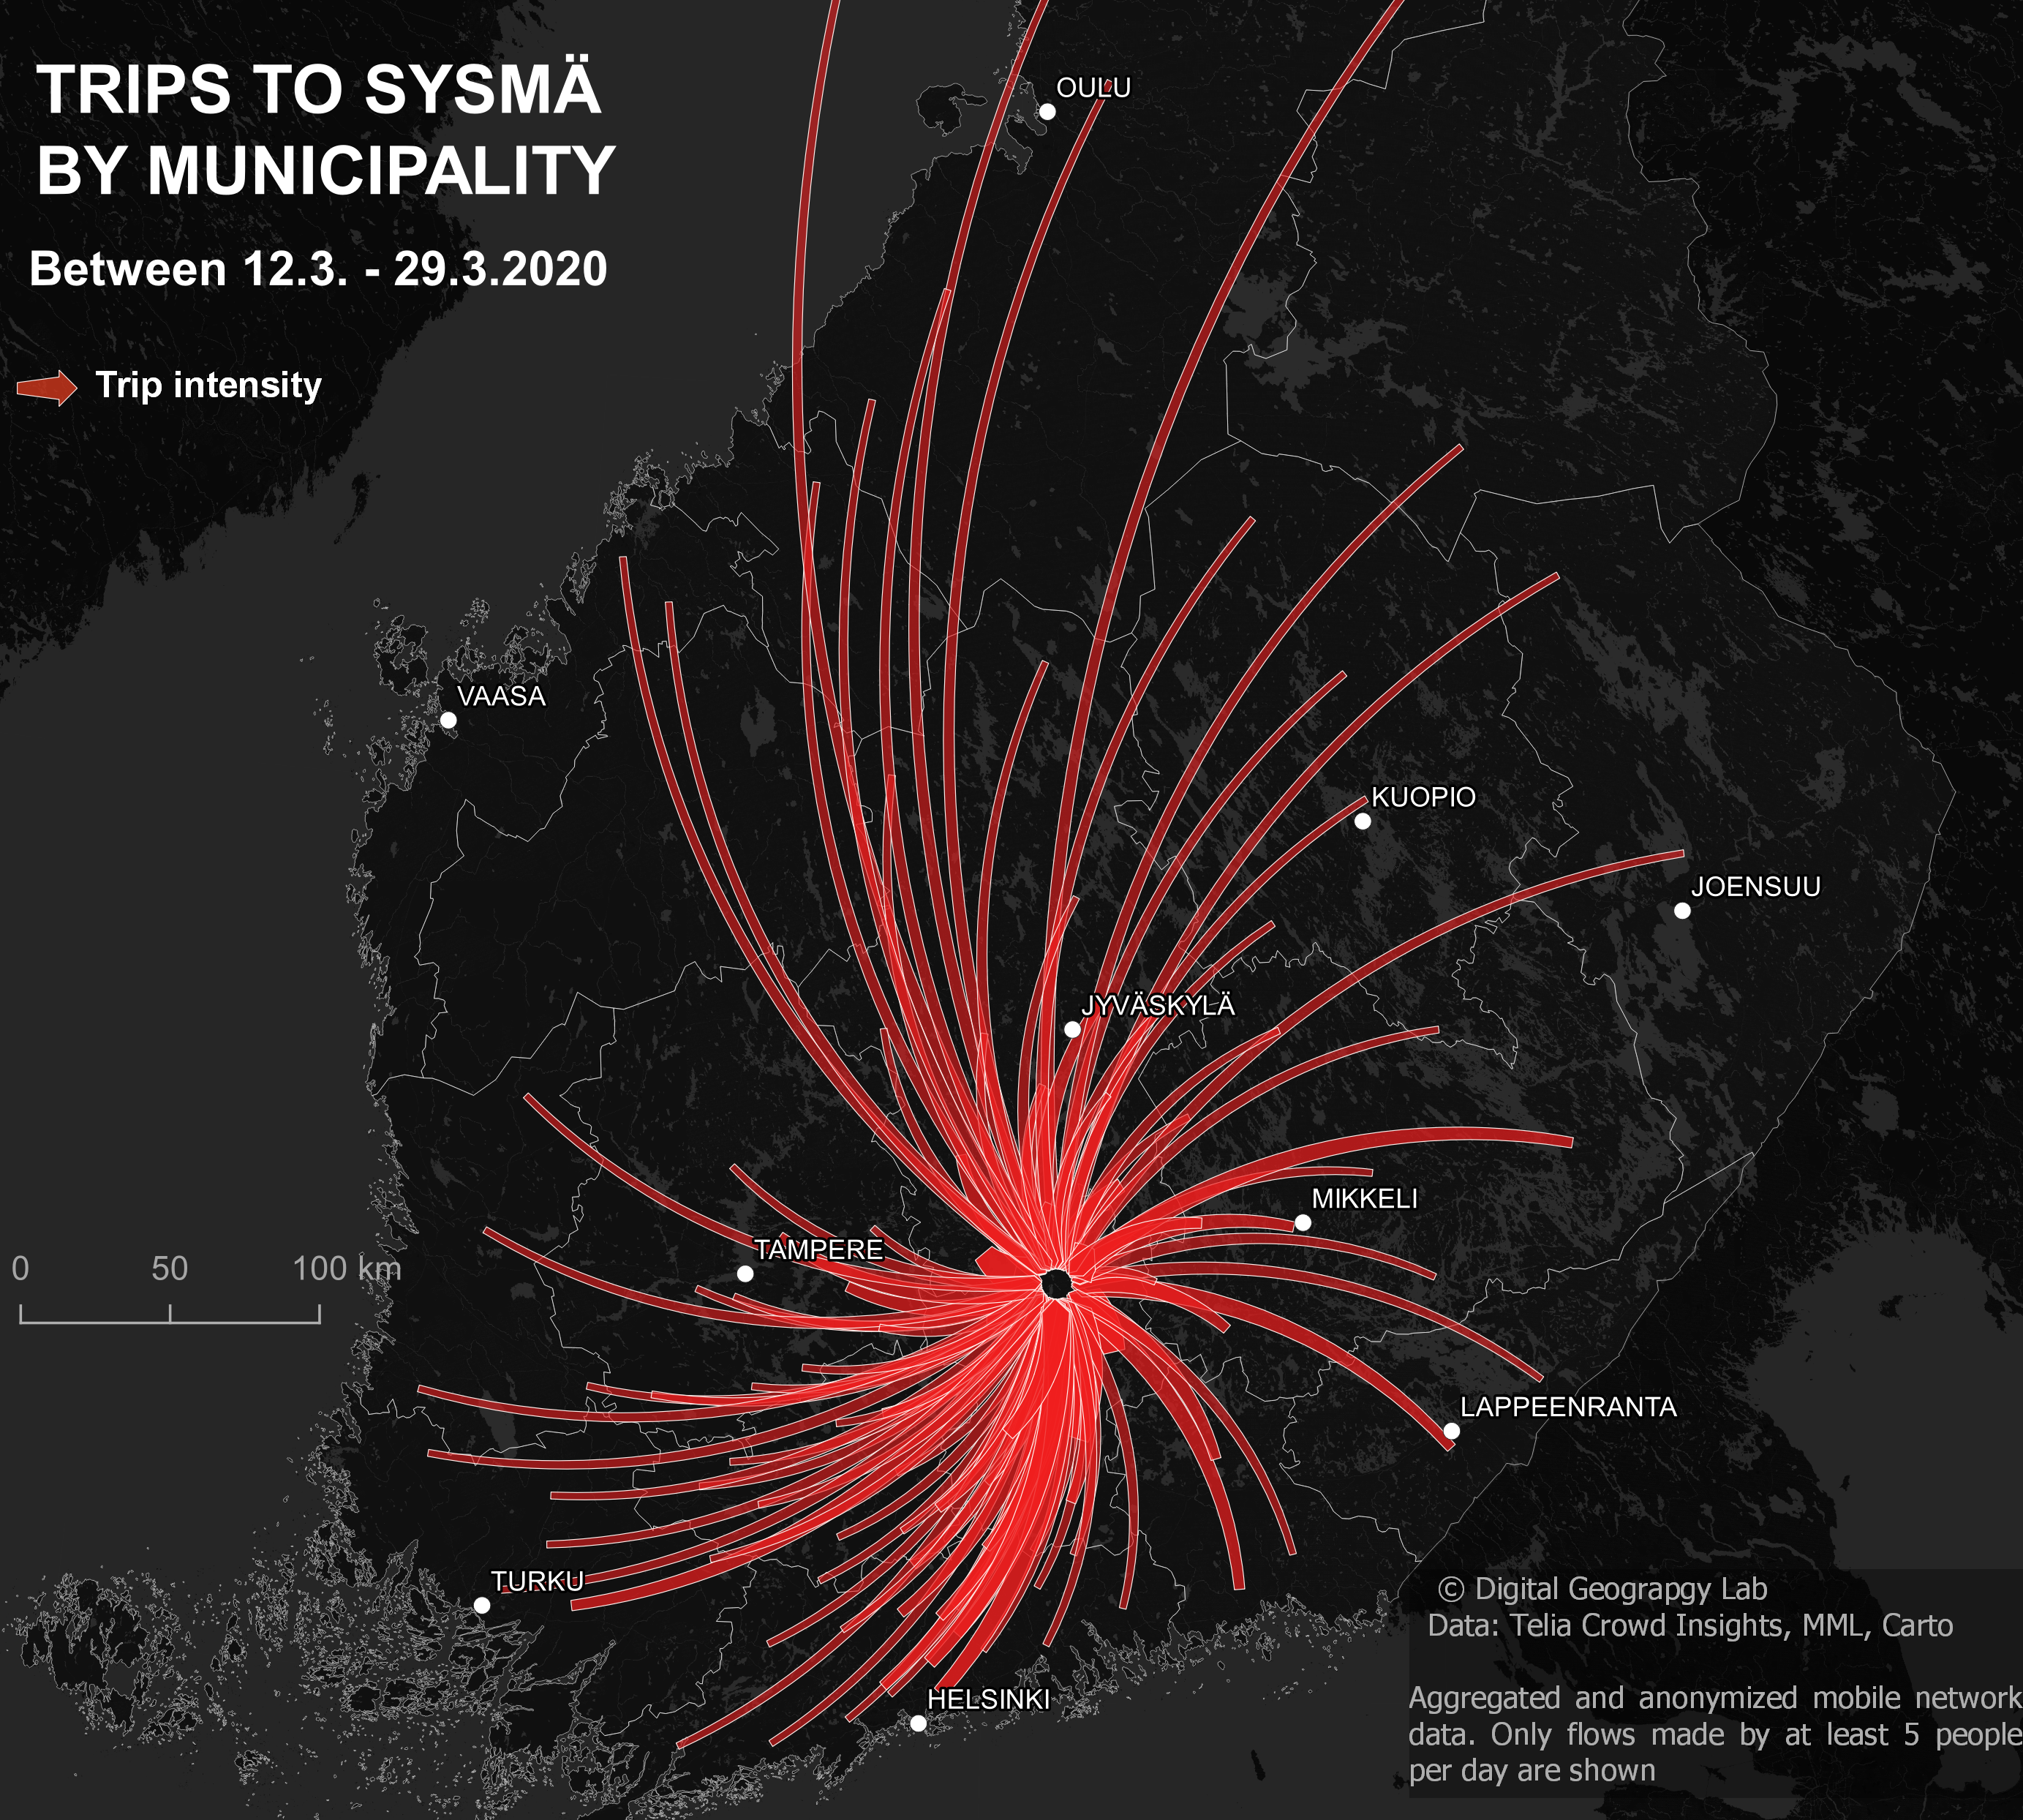
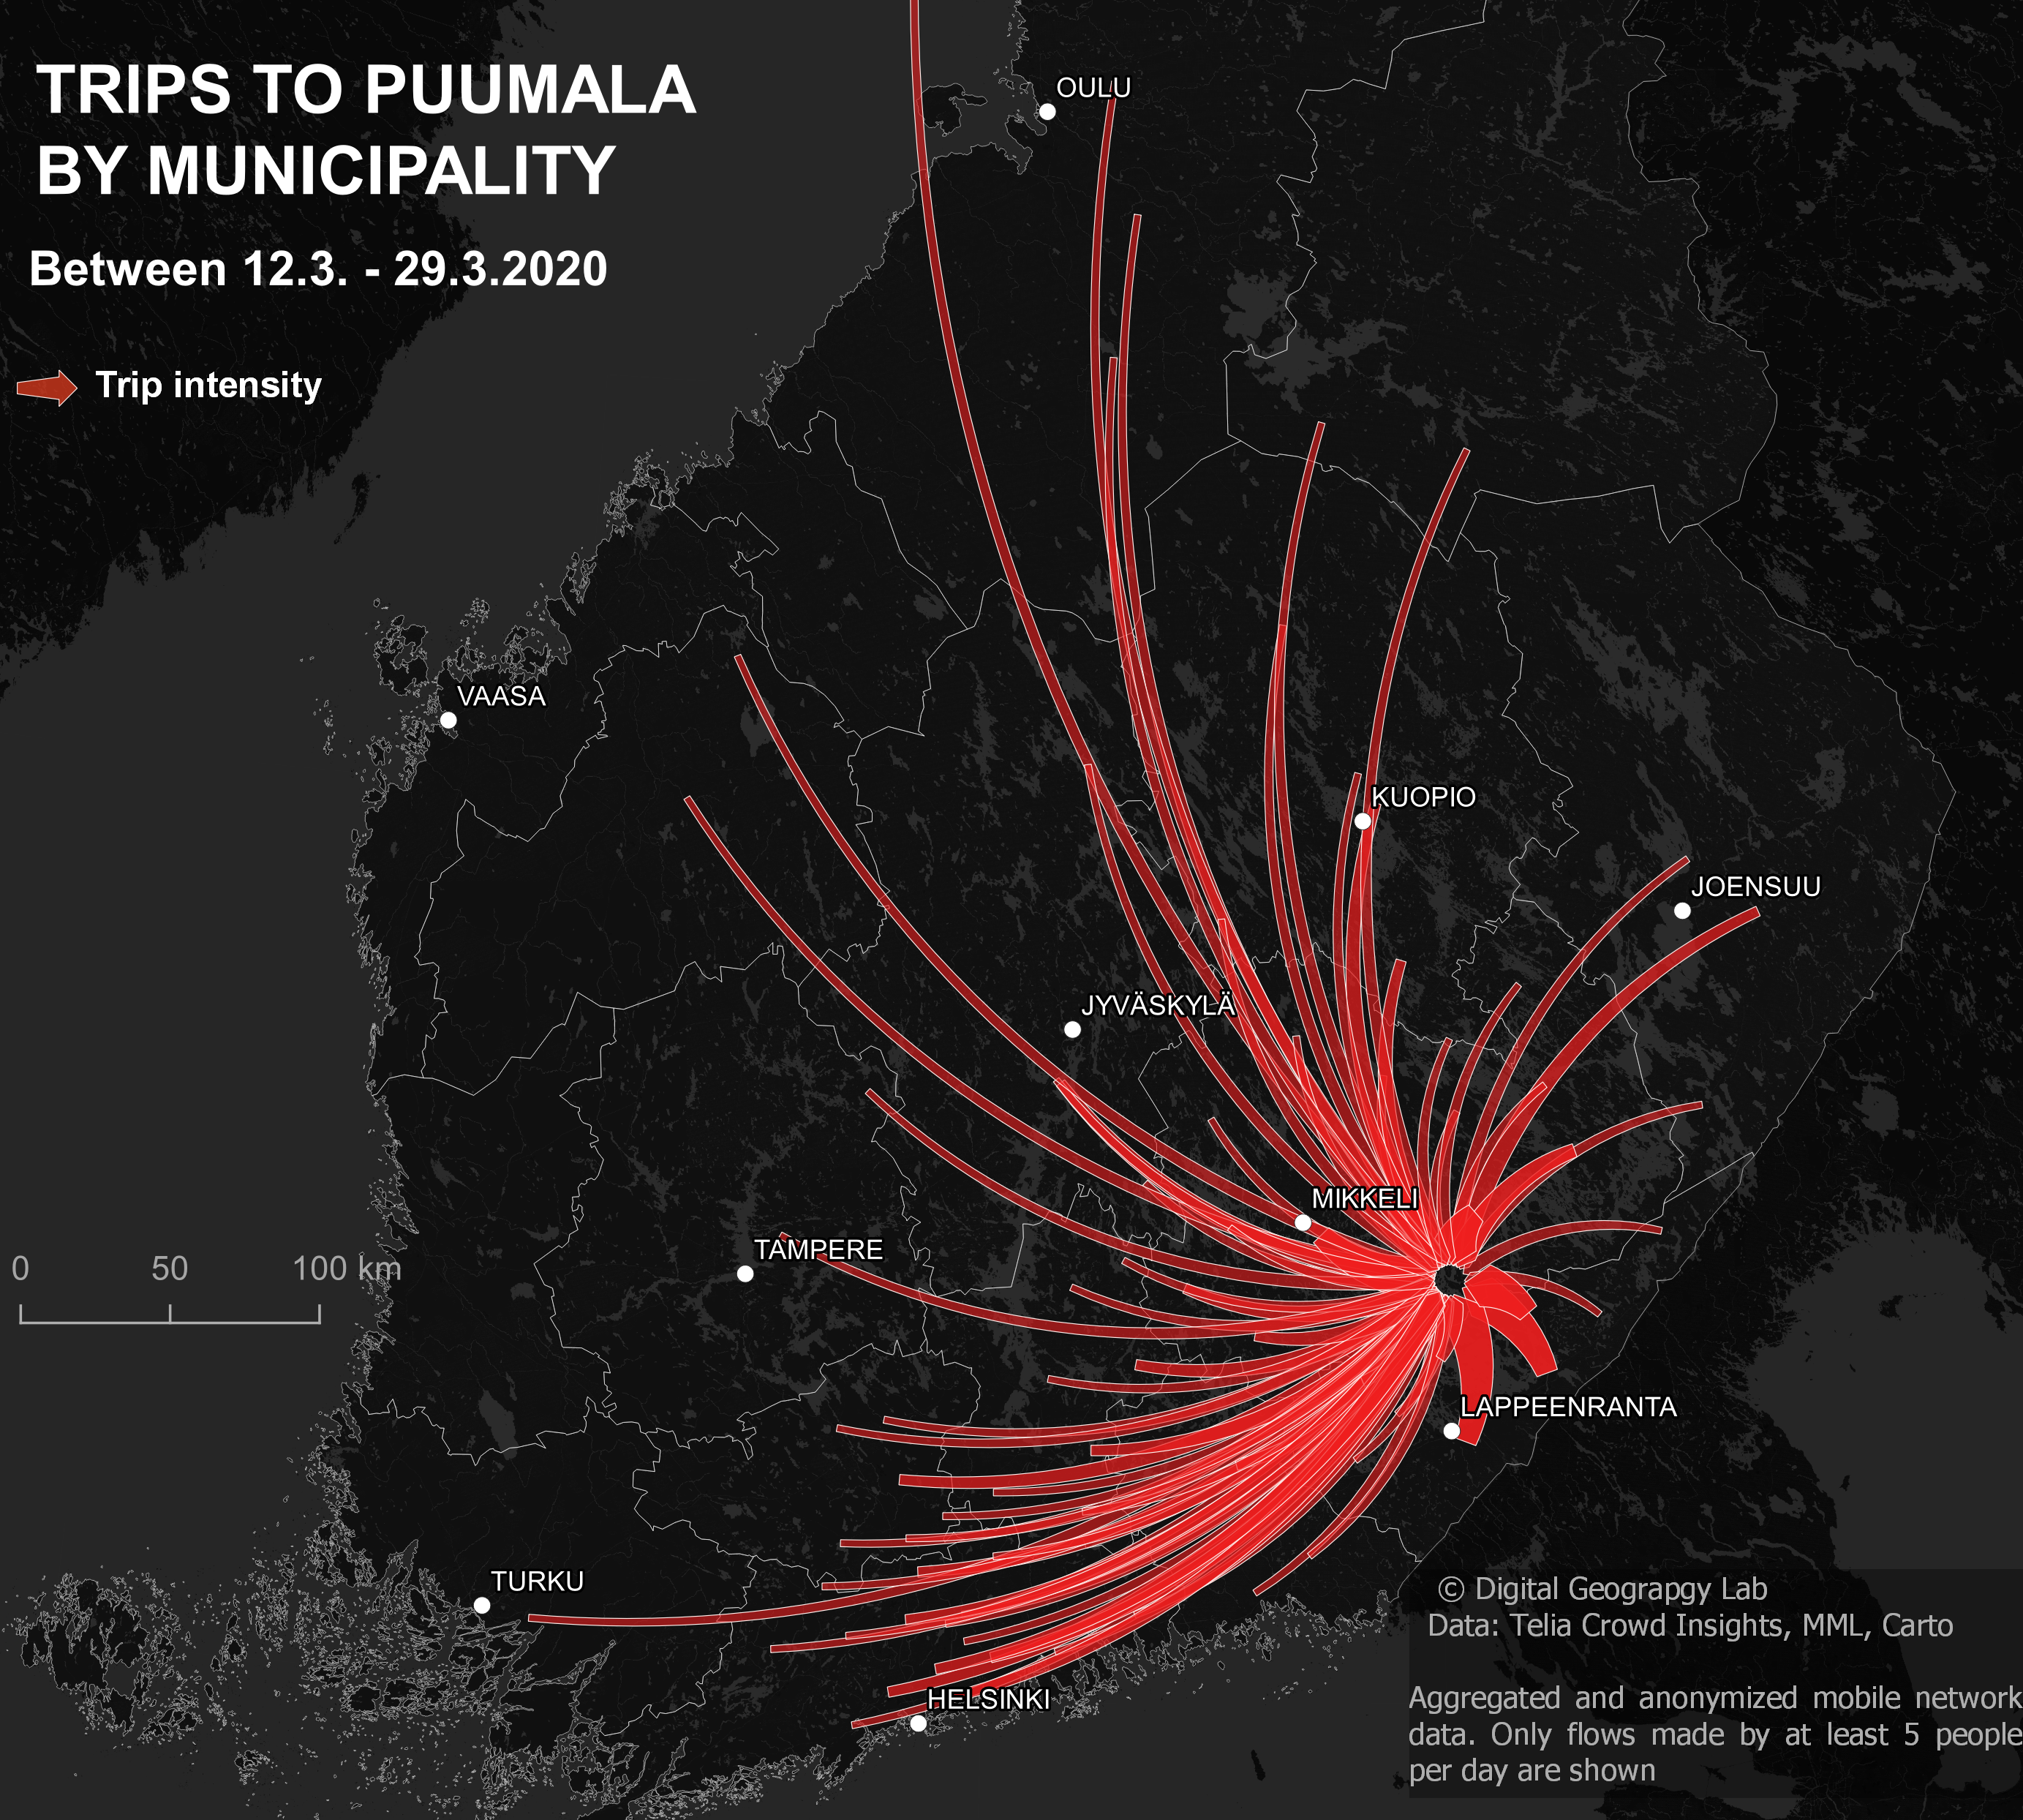
Figure 4. Three different geographical tales of human mobility to popular summer cottage municipalities in Finland: 1) Sysmä, 2) Puumala, and 3) Kustavi. The maps show the geographical catchment area of each observed municipality. In each selected municipality, most people arrive from the close neighboring municipalities; however, these also attract people widely from different parts of Finland.
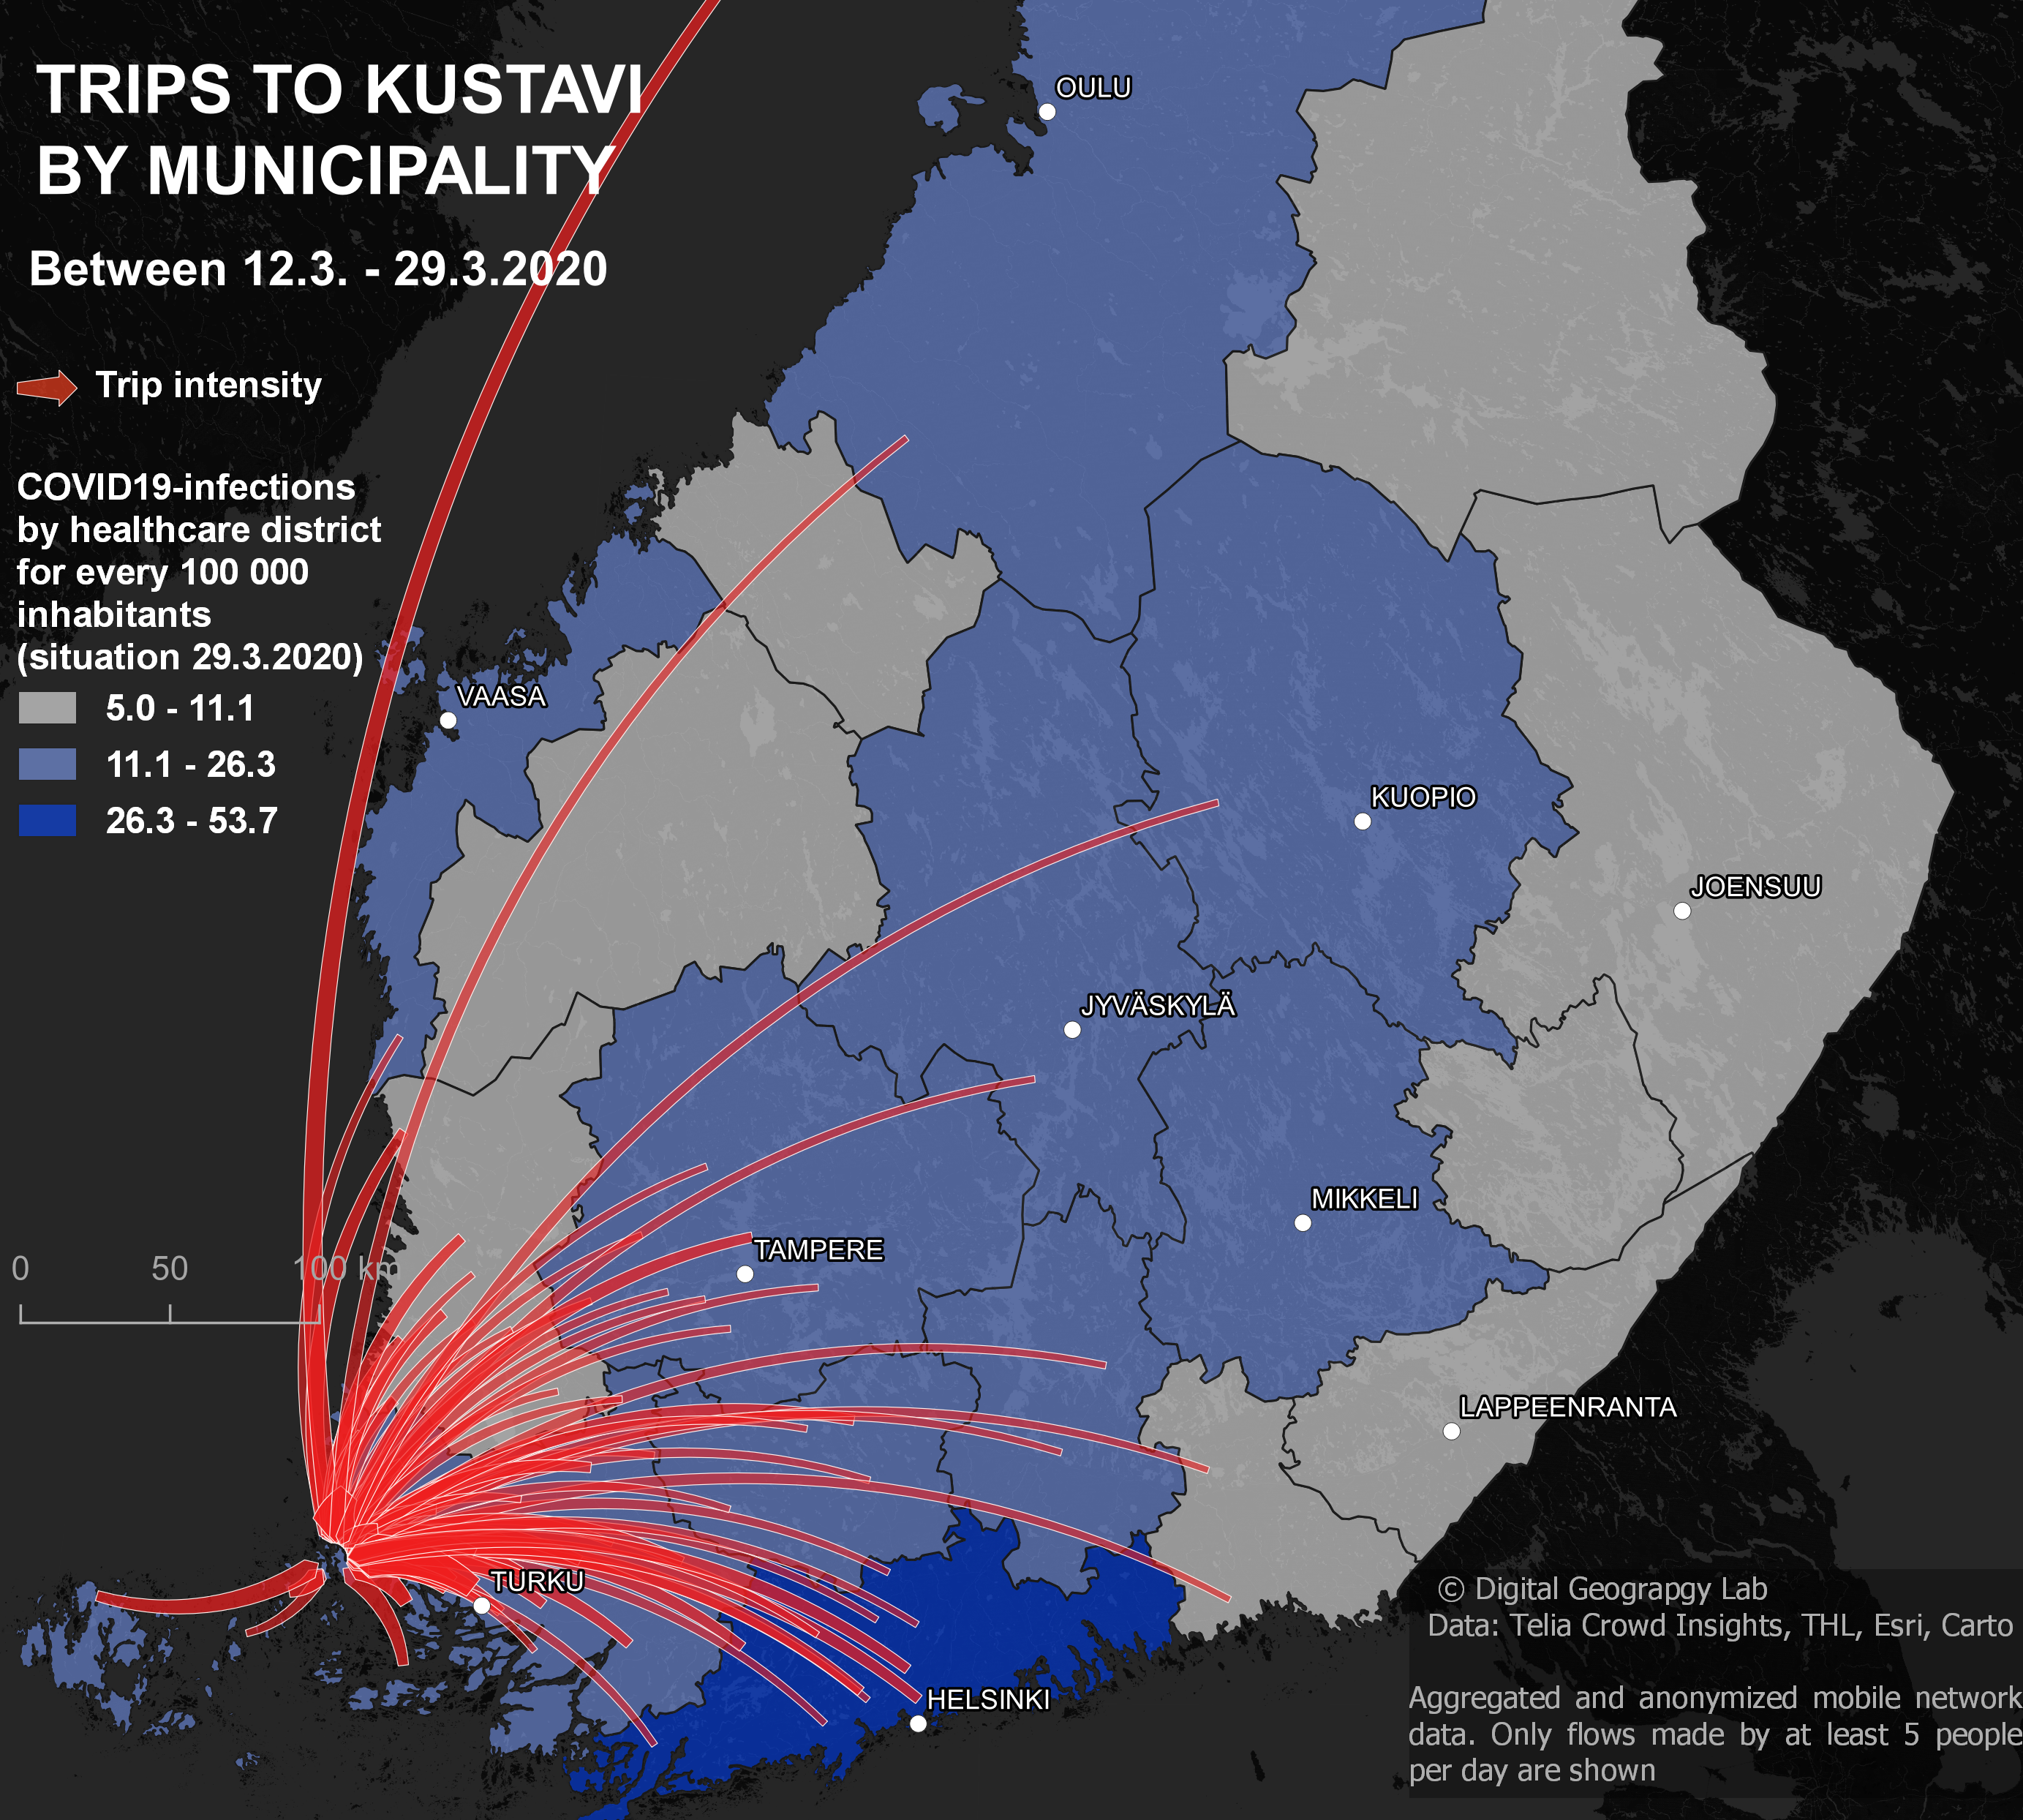
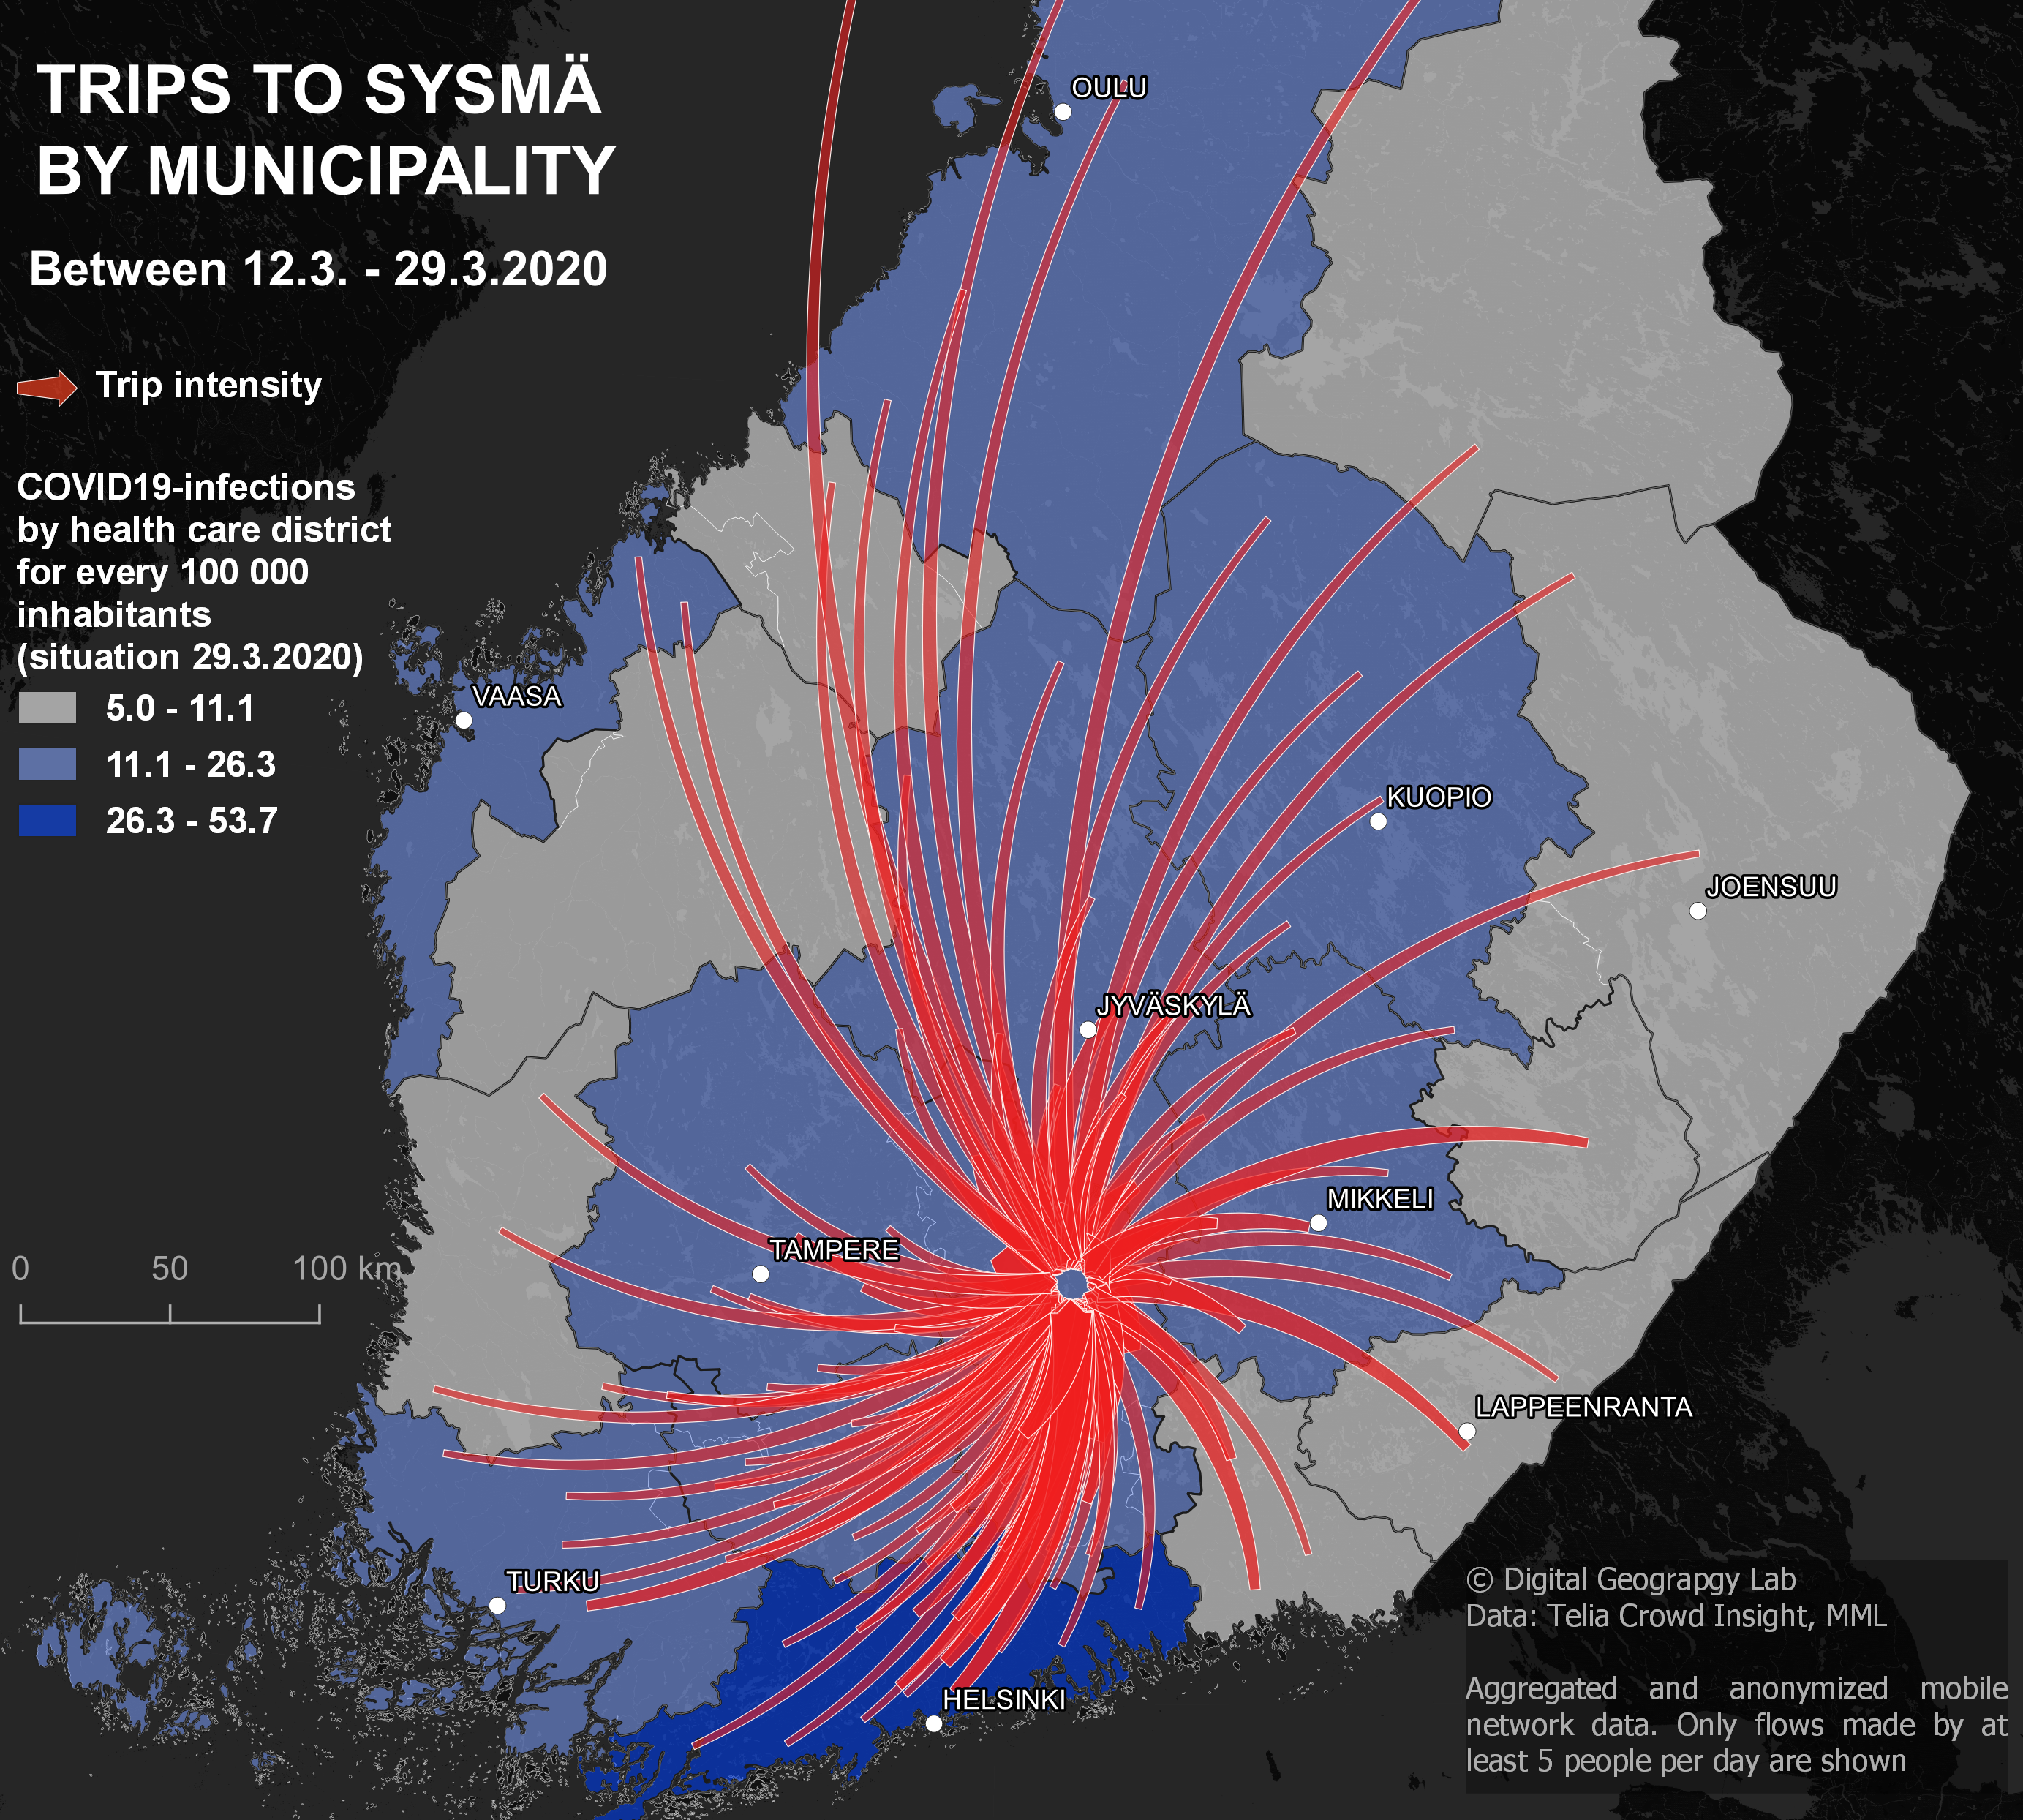

Figure 5. Mobilities to Sysmä, Puumala, and Kustavi in the context of the COVID-19 infection situation. The mobility flows reveal varying geographical catchment areas for different municipalities, which also can indicate different risk levels of potential virus transmission for different municipalities. For example, Uusimaa region in South Finland (including the Capital of Helsinki) has been the hotspot of the COVID-19 outbreak in Finland and had the highest infection rate per 100 000 inhabitants at late March 2020 (data by healthcare districts in 29.3.2020). Considering all trips to a municipality between 12.3 – 29.3, only 13% (Sysmä), 9.5% (Puumala) and 7.3% (Kustavi) were from Uusimaa.
5 Replies to “Towards summer cottages: Mobility flows amid the COVID-19 outbreak in Finland in March”
Comments are closed.