
Parks and other green spaces are an important part of sustainable, healthy and socially equal urban environment. Urban planning and green space management benefit from information about green space use and values, but such data are often scarce and laborious to collect. Temporally dynamic geographic information generated by users of different mobile devices and social media platforms are a promising source of data for studying green spaces.

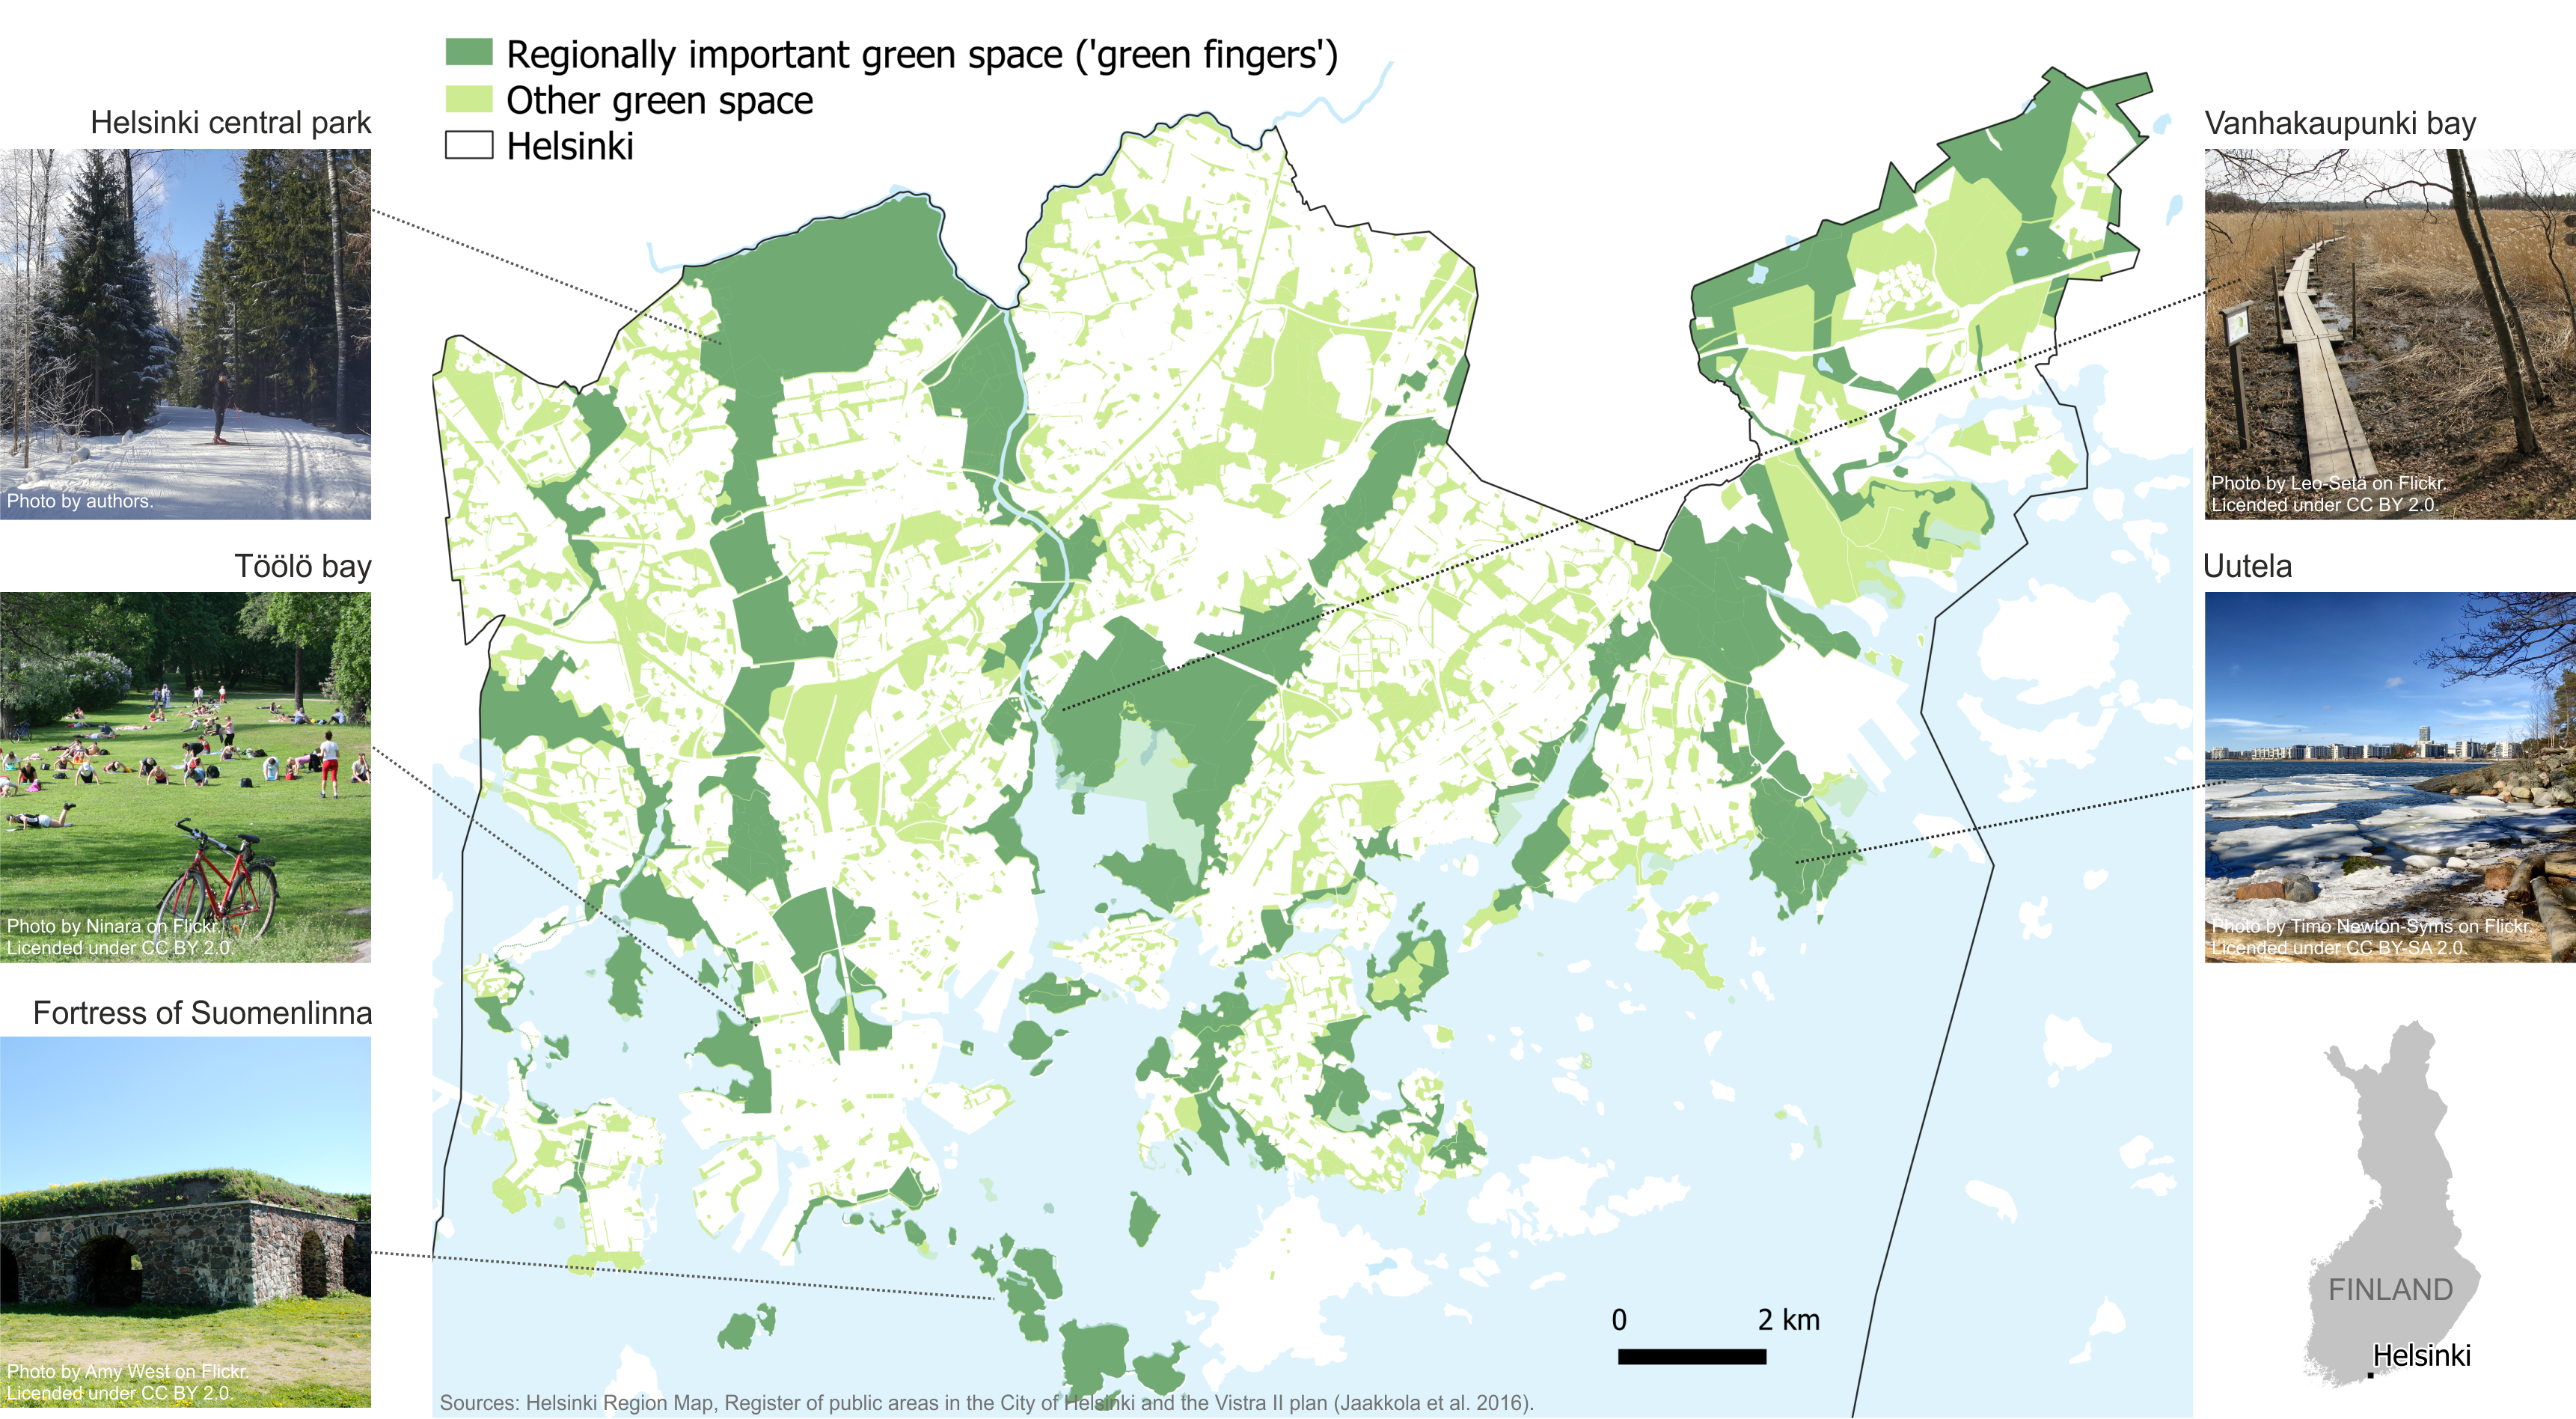
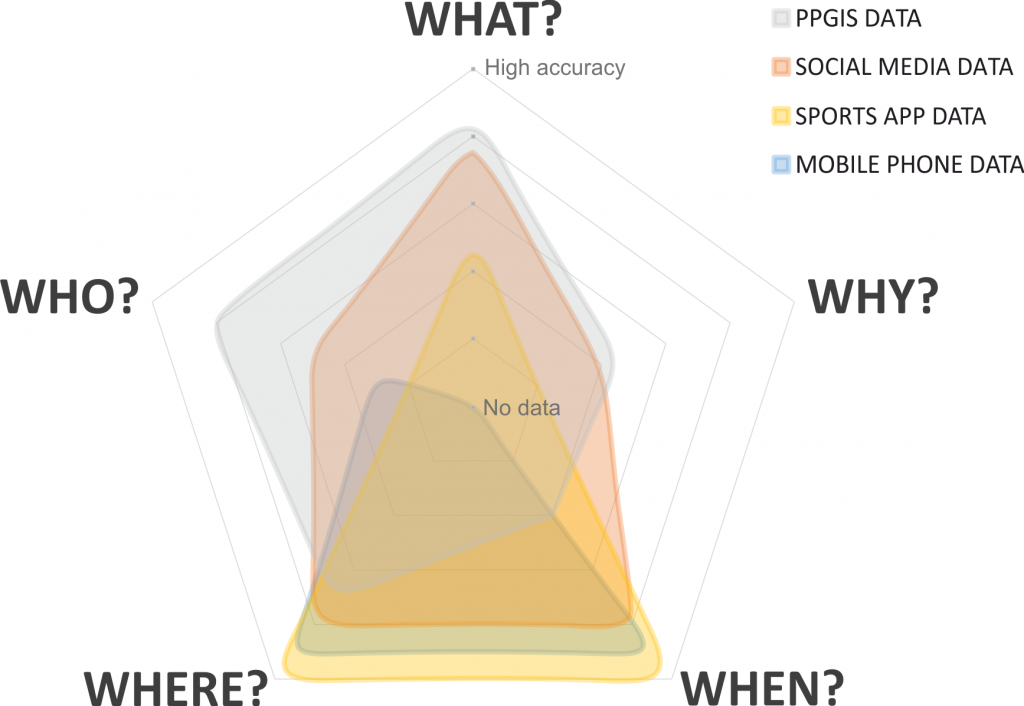
In a recent article published in the Landscape and Urban Planning journal we compare the ability of different user-generated data sets to provide information on where, when and how people use and value urban green spaces. We compare four types of data: social media, sports tracking, mobile phone operator and public participation geographic information systems (PPGIS) data in a case study from Helsinki, Finland, and ask: 1) where the spatial hot-spots of green space use are, 2) when people use green spaces, 3) what activities are present in green spaces and 4) who are using green spaces based on available sample data sets.
Being in, moving through and perceiving urban green spaces
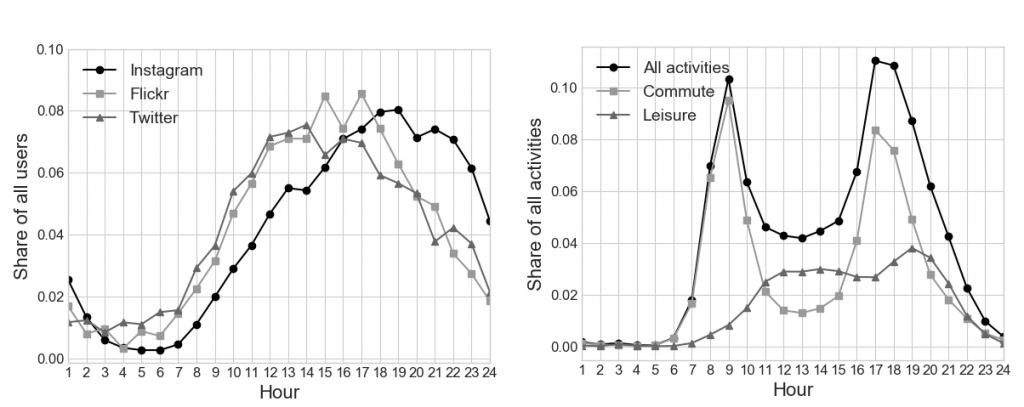
Our results show that user-generated geographic information provide dynamic information about the use of urban green spaces. Social media data highlight patterns of leisure time activities and allow further content analysis. Language detection allows further understanding of the different user groups. Sports tracking data and mobile phone data capture green space use at different times of the day, including commuting through the parks. PPGIS studies allow asking specific questions, including relevant background information from active participants.
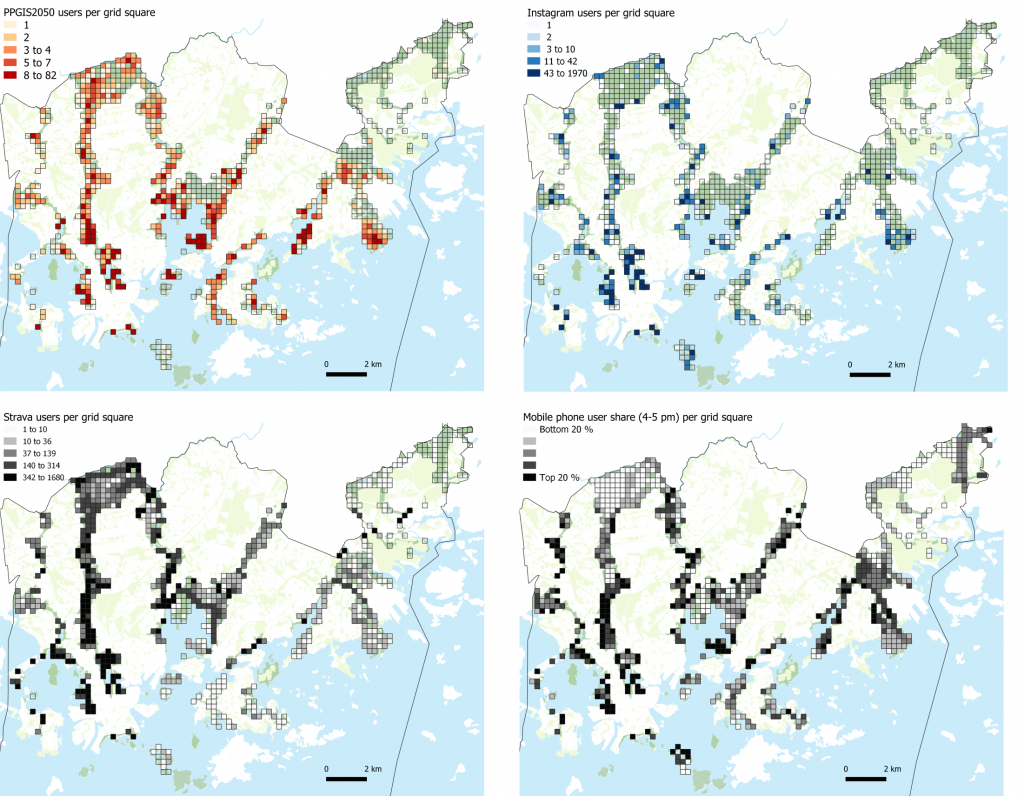
in 250 m x 250 m grid squares. (see more results in the original publication).
Each data source has its limitations which need to be acknowledged in further analyses. For example, social media data are mainly produced by young adults and the popularity of different platforms might change quickly over time. Sports tracking data is dominantly produced by men and focuses on physical activities such as biking and jogging. Mobile network data is often difficult to access at fine granularity, and PPGIS data are limited in duration and extent. In all cases, user-generated data should be processed and reported in a privacy-preserving manner.
Despite evident limitations, these data might often be the best available information about the use of green spaces. Combining information from multiple user-generated data sets complements traditional data sources and provides a more comprehensive understanding of green space use and preferences.
New data have become available during the COVID-19 pandemic
Near-real time information about human activities in different areas have become extremely relevant during the COVID-19 pandemic in spring 2020, and new data sources about people’s mobility patterns have become available for research.
The Digital Geography Lab recently analyzed changes in population distribution, and mobility patterns in Finland based on aggregated and anonymized mobile network data acquired from a local operator. The local newspaper Helsingin Sanomat had access to more detailed mobile network data allowing the comparison of activity in green spaces between spring 2019 and 2020, showing a significant increase of people, for example, in national parks in the Helsinki Region.
Also Google, and Apple have shared previously inaccessible information about people’s mobility patterns openly online (for a limited time period). These mobility data sets show a general trend of increased activity in green spaces in the Helsinki Region, and decreased activity in transit, retail and workplaces. Data from Google and Apple contribute to understanding questions related to where, when and what with most accurate information about the temporal dimension.
These data sets are highly aggregated and anonymized – individual users, or even individual parks are not visible in these mobility data sets.
Main limitations for using these data are still the same as we highlight in our paper (Heikinheimo et al. 2020): the representativeness of, access to and ethical use of user-generated content.
Overall, there is clearly an increasing need for versatile information about crowded (and silent) places in urban areas, and the various benefits of urban green spaces to people.
Read the full article (written before the covid-crisis) at: https://authors.elsevier.com/sd/article/S0169204619313635
Heikinheimo, V. , Tenkanen, H., Bergroth, C., Järv, O., Hiippala, T., & Toivonen, T. (2020). Understanding the use of urban green spaces from user-generated geographic information. Landscape and Urban Planning, 201, [103845]. https://doi.org/10.1016/j.landurbplan.2020.103845