
Olle Järv, Elias Willberg, Tuomas Väisänen, Tuuli Toivonen
Finland, like all other countries in Europe, was hit by the emergence of the covid-19 in March 2020. On Thursday 12th of March, the government gave the first serious recommendations of cancelling big public gatherings and encouraging distant working. On Monday 16th March the government presented a state of emergency. The schools and public services like museums and libraries were closed and visits to elderly care homes were prohibited. Travel was to be limited to minimum. Historically, the border between Sweden and Finland was closed on the 19th March, restricting the workforce to move across the border in the northern areas and Åland islands. As the glittering snow of Lapland was still attracting tourists from the south, the ski resorts were closed on the 23rd March. As the strongest and an unprecedented measure, the border of the Helsinki-Uusimaa region was closed for personal traffic on the 28th March.
We at Digital Geography Lab received data from mobile phone operator Telia to analyse how these recommendations and restrictions were followed. Below are some first views on the results, showing how the presence of people changed in the 310 municipalities of Finland during February – March 2020. We concentrate on March and compare the presence of people in different municipalities to the first week of February (1.-7.2.2020) – a baseline week before the start of the school winter holidays and the emergence of Covid 19. The analysis is based on anonymised and aggregated mobile network data (Telia Crowd Insights activity data). A single activity is recorded of every 20 minute stay in one location. Some February days (12.2., 13.2, 25.2.) are missing in the dataset.
Our inspection shows, for example:
- A significant drop in inter-municipal mobility since mid-March. The biggest changes happen already after the governmental recommendations, not by the time of the binding lockdowns.
- The municipalities with summer cottages gained people, while the number of people spending time in cities decreased rapidly after the state of emergency was declared.
- In addition to big cities, estimated population in Åland islands and Lapland decreased drastically.
- Number of people in Lapland decreased only after the ski resorts were closed.
The decline of mobility at national level – people follow governmental guidance
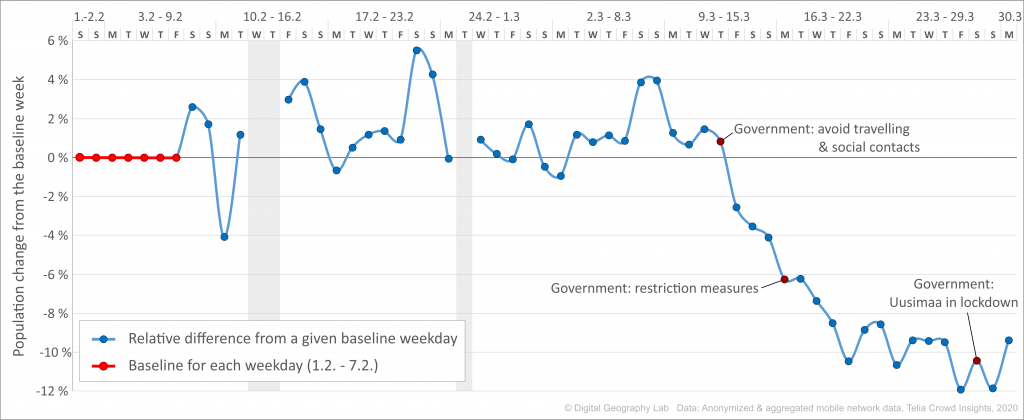
Figure 1. Inter-municipality mobility in Finland dives from mid-March. The activity location data shows the presence of people in a municipality. During typical times, people visit and spend time in several municipalities during a day. Extra mobility between municipalities takes place during the winter holiday season in Finland (17.2 – 6.3. or 15.2-8.3.). The government gave a recommendation to avoid travelling and promoting remote working since at the beginning of the Covid-19 outbreak 12.3. That recommendation was taken seriously – people’s activity spaces were rapidly limited. The governmental recommendation was a clear turning point, the later mobility restrictions by law influenced less.
Figure 2. The animation shows the relative change in number of people by municipality during March. People are accounted for each municipality they spend time in during the day. The baseline period for the daily comparisons is the first week of February (1.2 – 7.2.). (If the video does not show, see the animation here: https://bit.ly/2YGCMoO)
The relative population change in Helsinki Metropolitan area – seizing activity
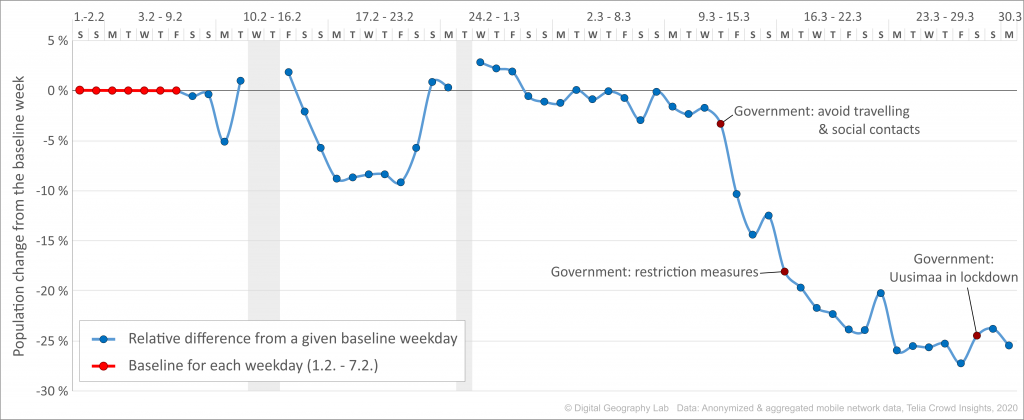
Figure 3. Inter-municipality mobility in the Helsinki metropolitan (HMA) area follows the national pattern of declining mobility, but with much greater effect. Typically, the HMA has a stable mobility between municipalities. Every year February is special as people travel during the school winter holiday week. Then almost 10% of people left the region (many to Lapland). After the governmental recommendation to avoid travelling and restrict social interactions, the presence of people in the HMA decreased drastically. This happened already before the lockdown of the Uusimaa region (28.3.). Before the Uusimaa lockdown inter-municipality mobility had decreased some 25% compared to a typical week (1.2 – 7.2.) as people stay home and avoid social activities.
The relative population change in Lapland – boom and bust
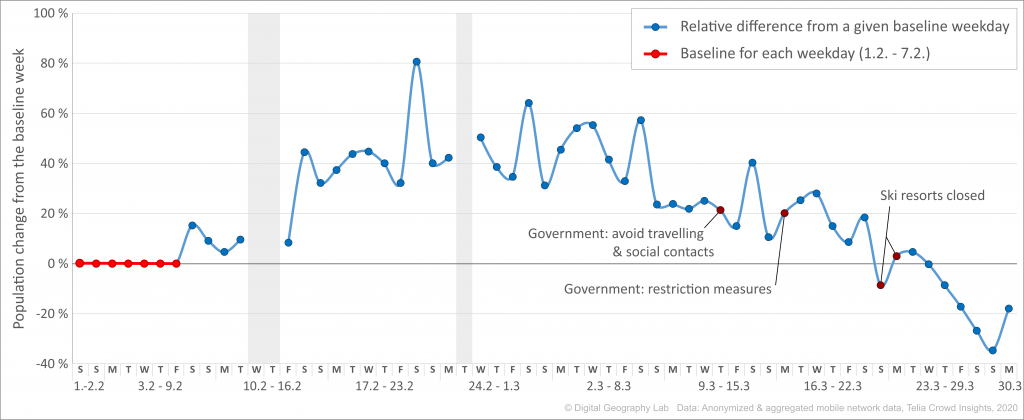
Figure 4. During the winter holiday season (15.2 – 8.3.) the presence of people in the in six municipalities with a skiing resort in Lapland (Inari, Kittilä, Kolari, Kuusamo, Muonio, Pelkosenniemi) is booming as usual. Working days show some 40% increase of people compared to the baseline week (red line). Furthermore, Saturdays show even 60-80% increase of people compared to a baseline Saturday (1.2.). Interestingly, the governmental guidance to avoid travelling since 12.3. did not affect Lapland – some people wanted to have their skiing holiday! Only after the early closure of skiing resorts since 22.-23.3. visitors are sharply decreasing from Lapland – by the last Sunday (29.3.) there are 35% less people than the baseline Sunday (2.2.).
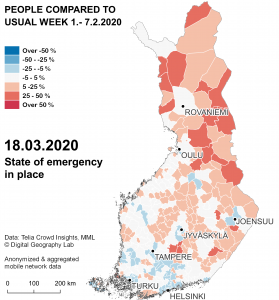
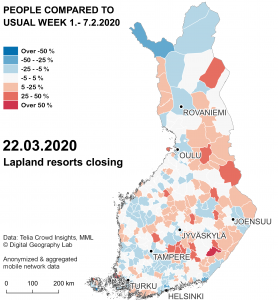
Figure 5. The relative change in the number of people spending time in municipality on 18th and 22nd March, compared to the baseline week. Declaring state of emergency starts to limit travelling to big cities in the south. Visitors leave the northern municipalities only when the ski resorts are to be closed.
The presence of people at the end of March with restrictions in place – Winning and losing people
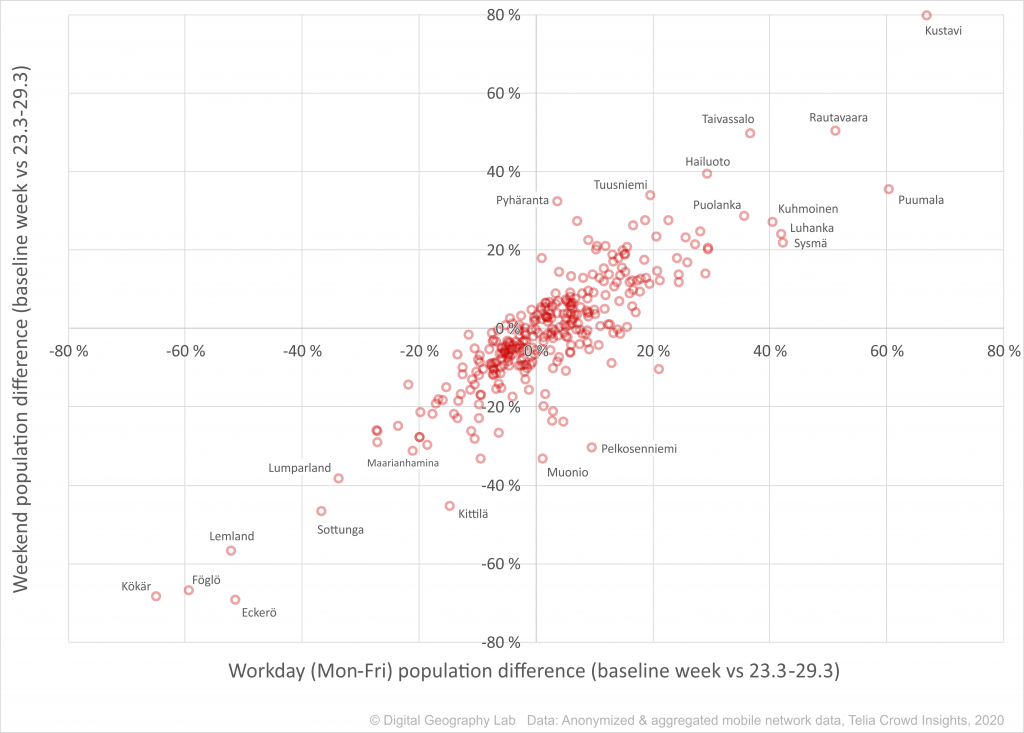
Figure 6. The relative change in the presence of people between the last week of March (22.3. – 29.3.) and the baseline week (1.2. – 7.2.). At the end of March, the most severe restrictions were in place, including the closure of Uusimaa and the Lapland skiing resorts. The biggest decrease in the presence of people is seen in the smallest municipalities of the Åland archipelago, as municiplaities in Åland Islands had 25 % – 35 % less people compared to the baseline. Partly the change is explained by the stopping of the passing ferry traffic. The biggest increase in the presence of people took place in smaller municipalities that have a large amount of summer cottages. Despite travelling restrictions, some people escaped from big cities to their summer cottage. For example, Kustavi municipality hosted some 70-80 % more people during the last week of March compared to baseline. The summer cottage municipalities such as Puumala, Sysmä, Luhanka, Kuhmoinen and Taivassalo also gained people.
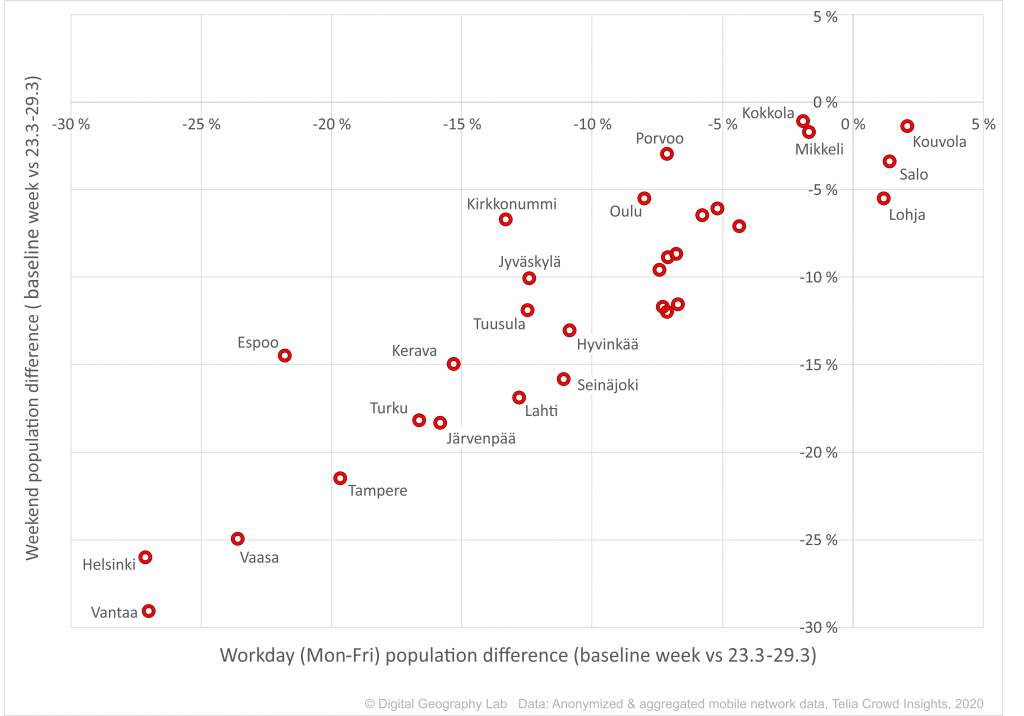
Figure 7. The presence of people in 30 biggest municipalities in Finland is clearly negative during the last week of March, compared to normal. During the Covid-19 restrictions, cities having the biggest commuting flows (Helsinki, Vantaa, Tampere, Turku, Vaasa) are the ones losing the most people. Oulu seems to be an exception here, but for a reason: Oulu municipality covers a very large area and thus commuters living within the municipality do not cross municipality borders. Some of the biggest municipalities have remained with the same number of people, including Kouvola, Salo, Lohja and Mikkeli. These municipalities have, however, also significant amount of summer cottages. In all cases, the presence of people during weekends is lower during the last week of March compared to the baseline week in the beginning of February.
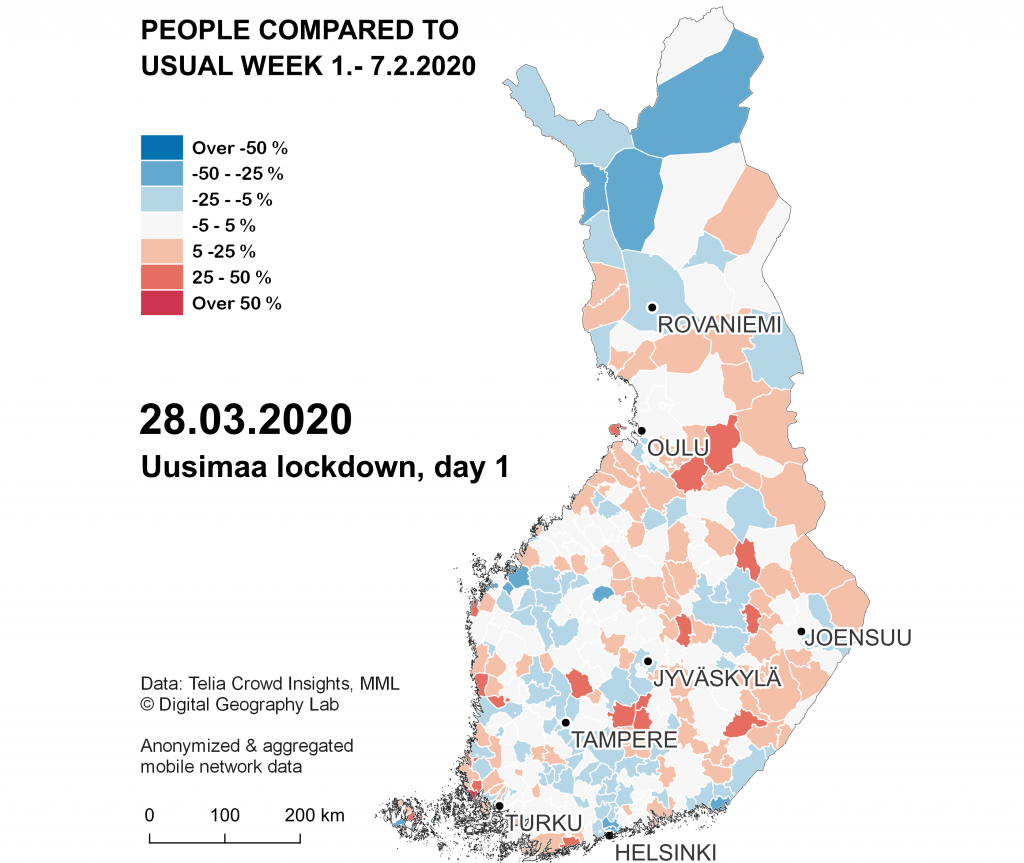
Figure 8. Uusimaa lockdown, day 1: The number of people in major cities and their surrounding regions is lower while many summer cottage municipalities are having more people than normally. If comparing to previous maps, the Uusimaa lockdown does not change the pattern drastically anymore at national level. People have limited their travelling already earlier.
3 Replies to “COVID-19 changed the distribution of people in Finland in March – snapshots from aggregated and anonymized mobile network data”
Comments are closed.