Monthly Archives: July 2014

Internet of Things: Hydroponics!

The goal of my project on this Internet of things -course is to design and implement an environmental condition monitoring system for hydroponics. In a hydroponic system plants are grown in a nutrient solution without use of soil.

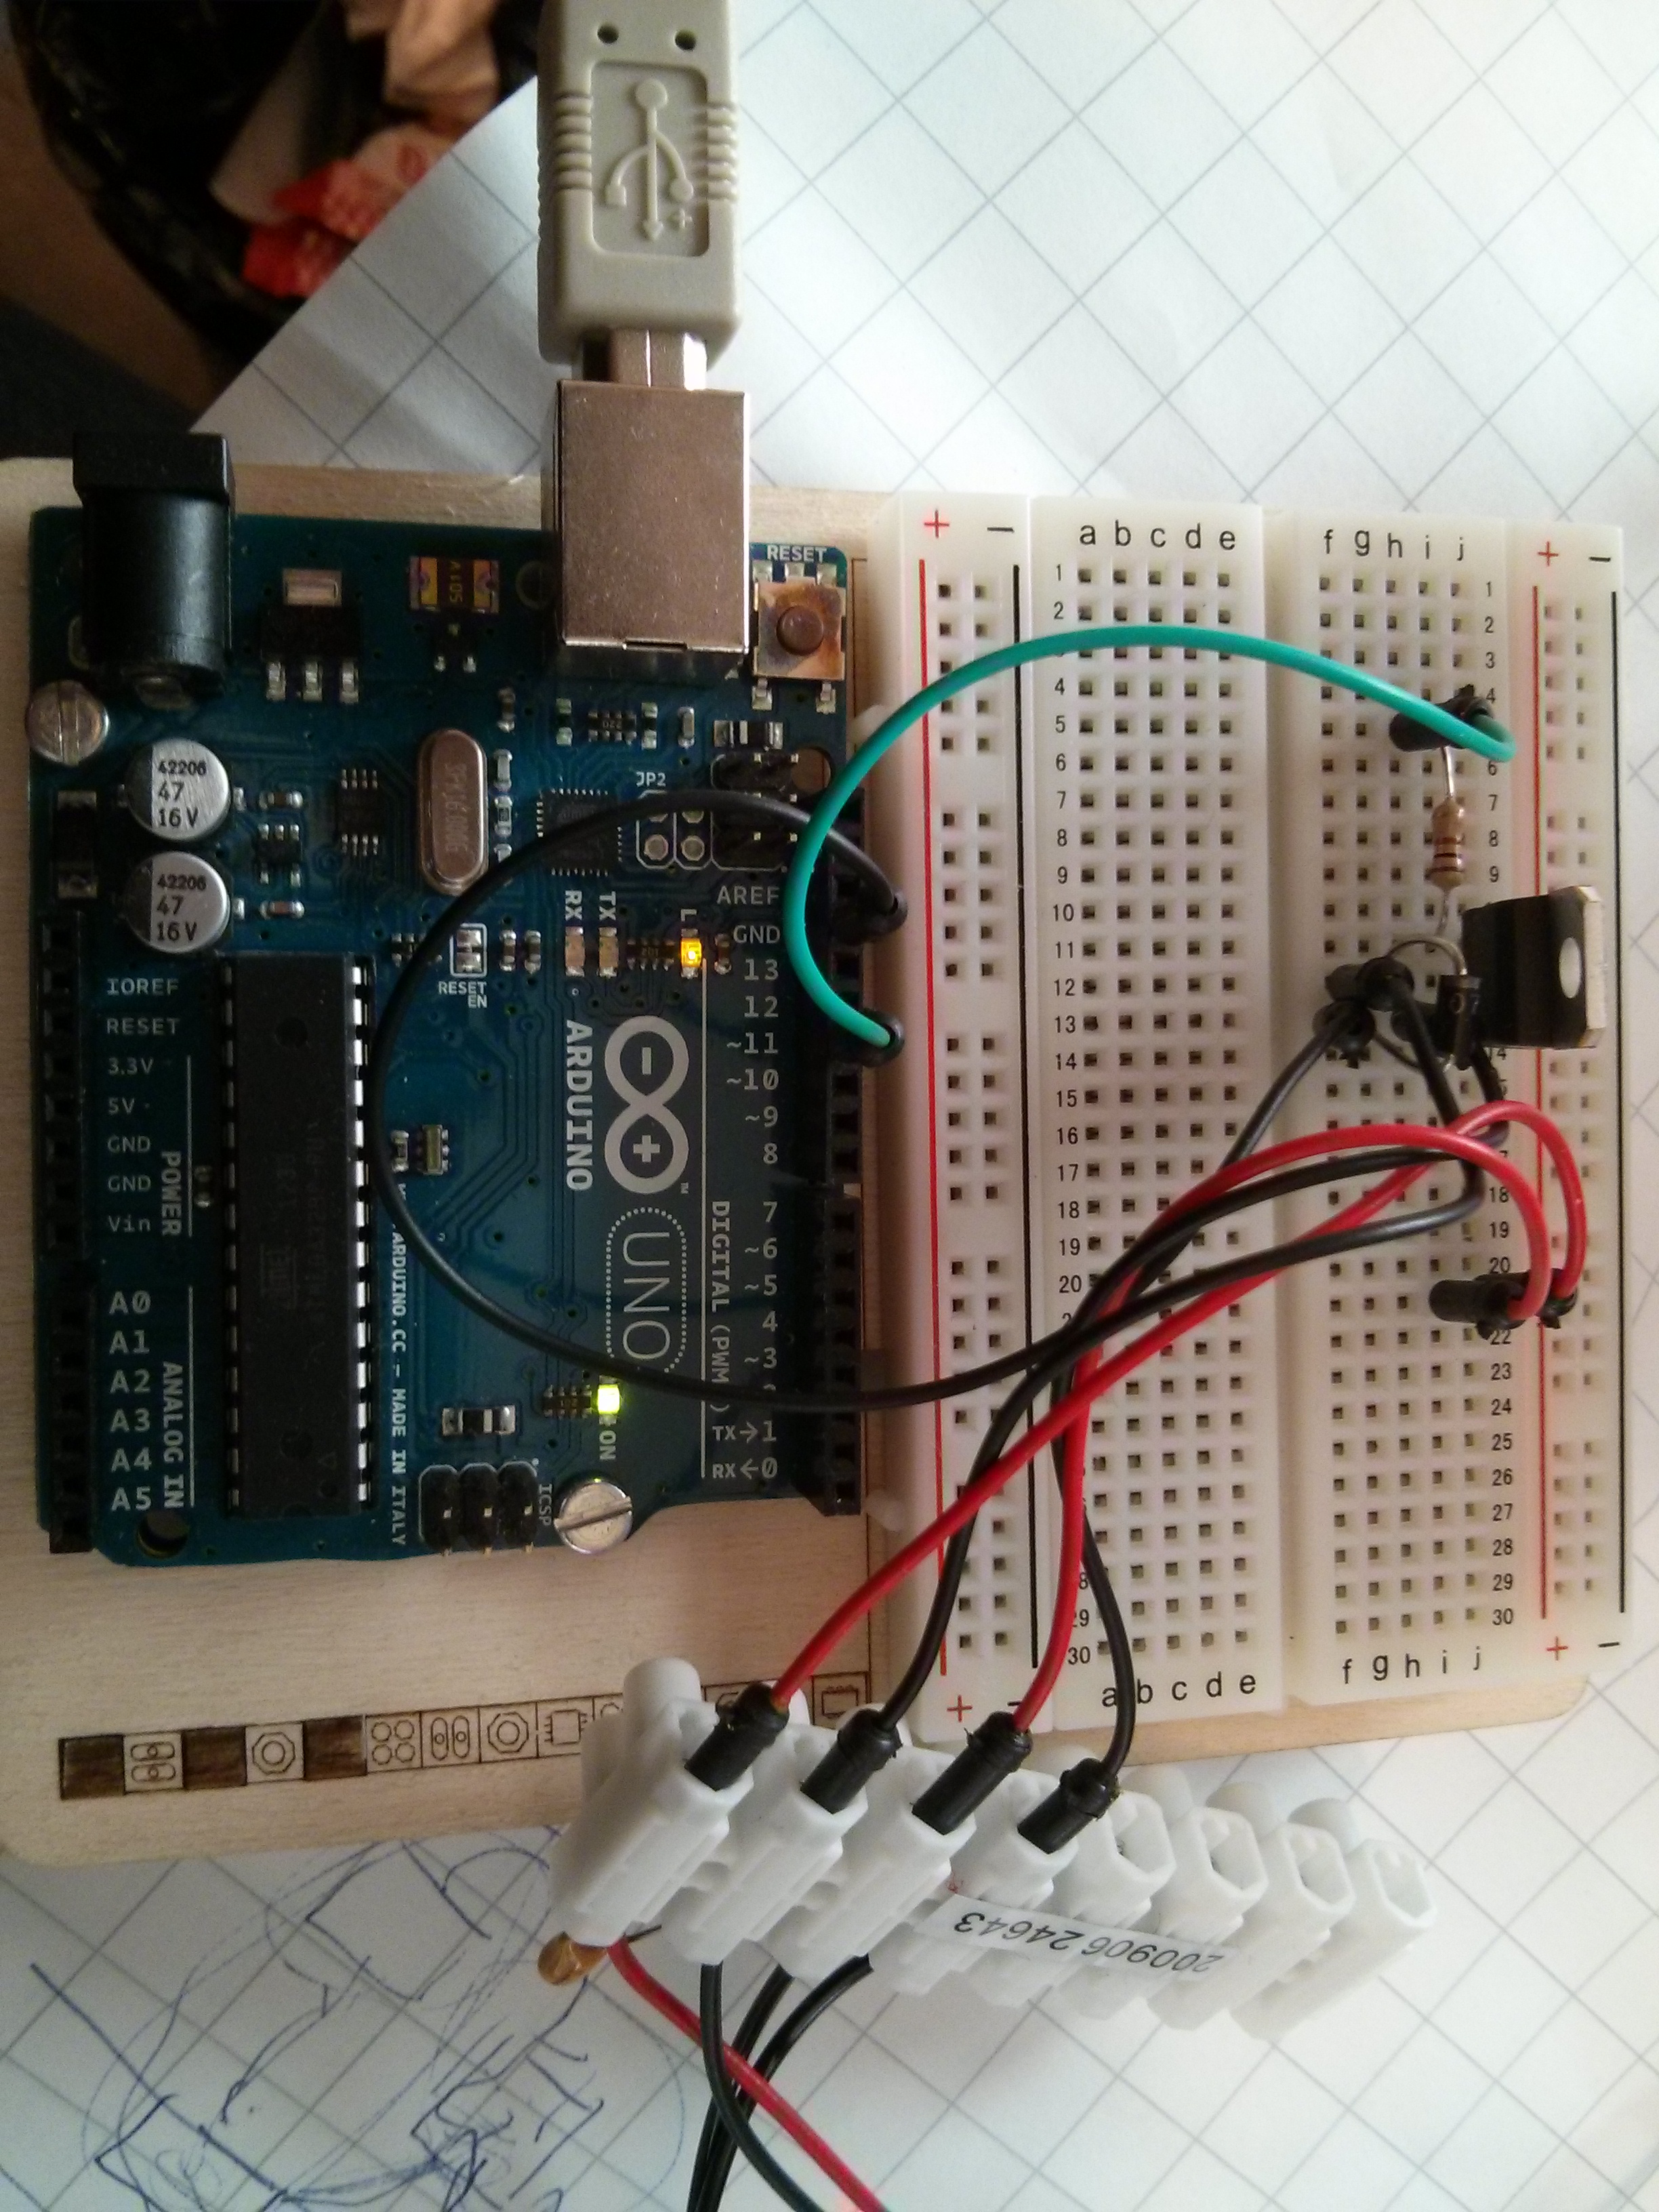
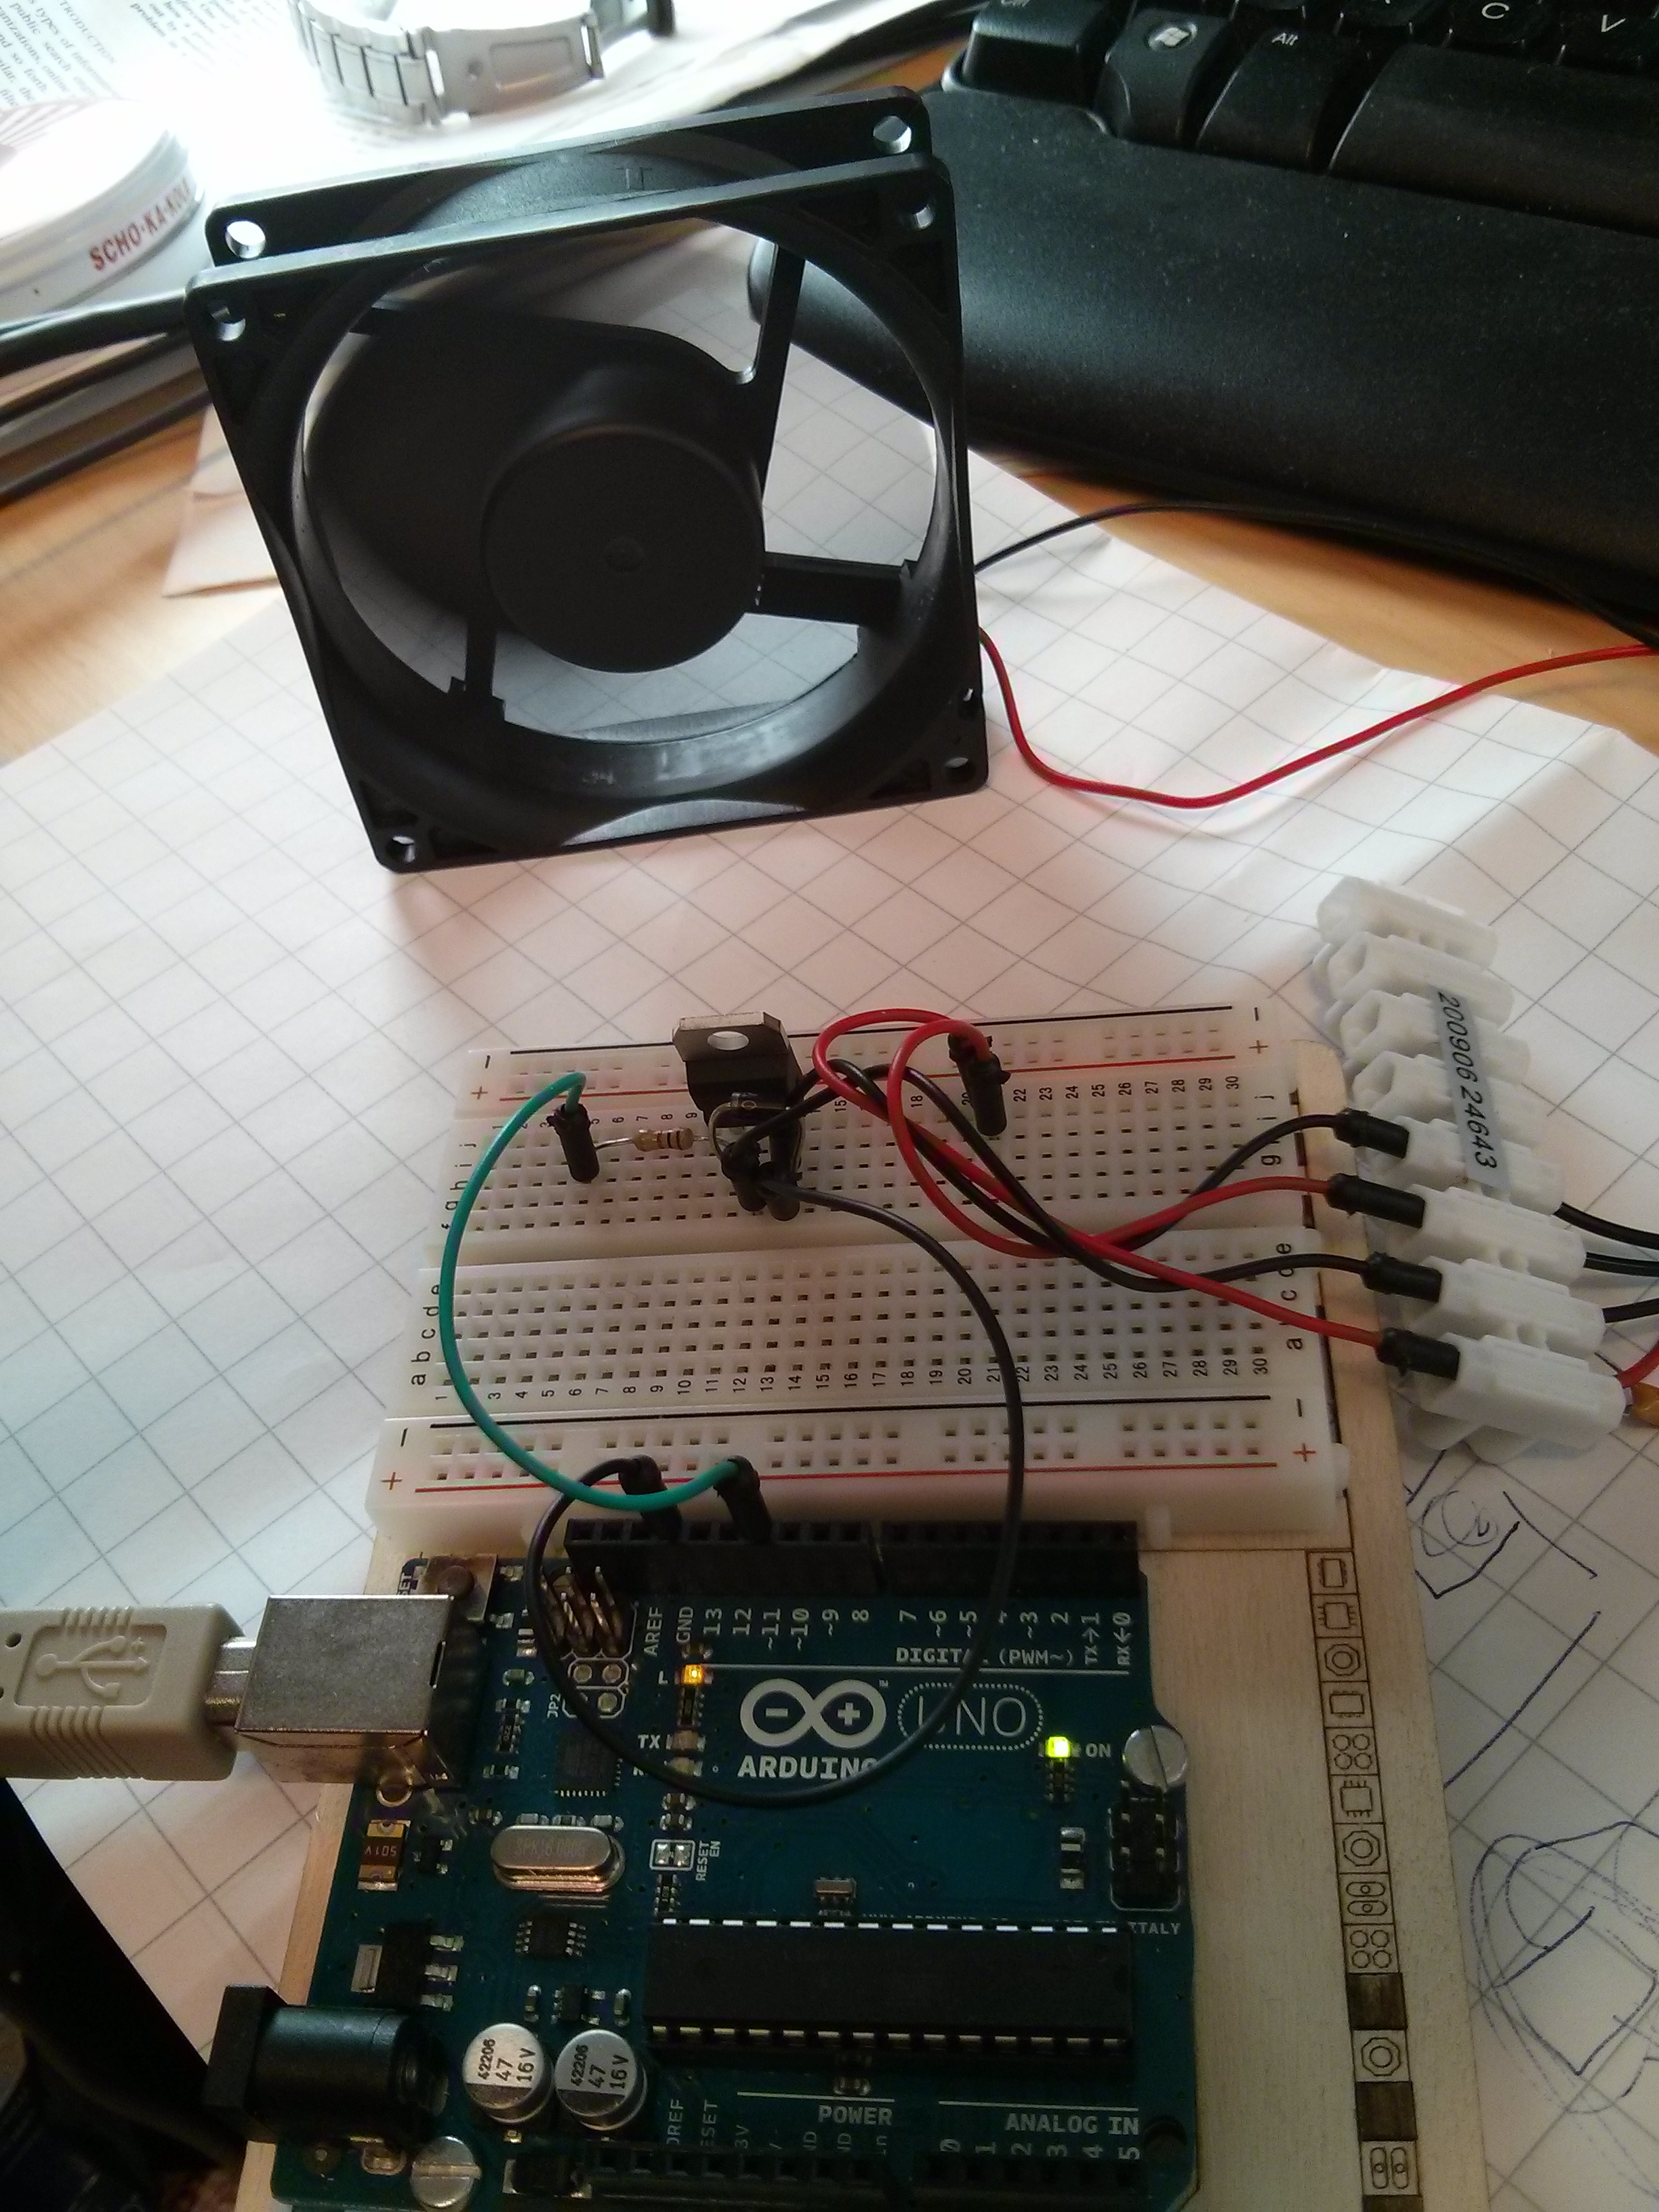
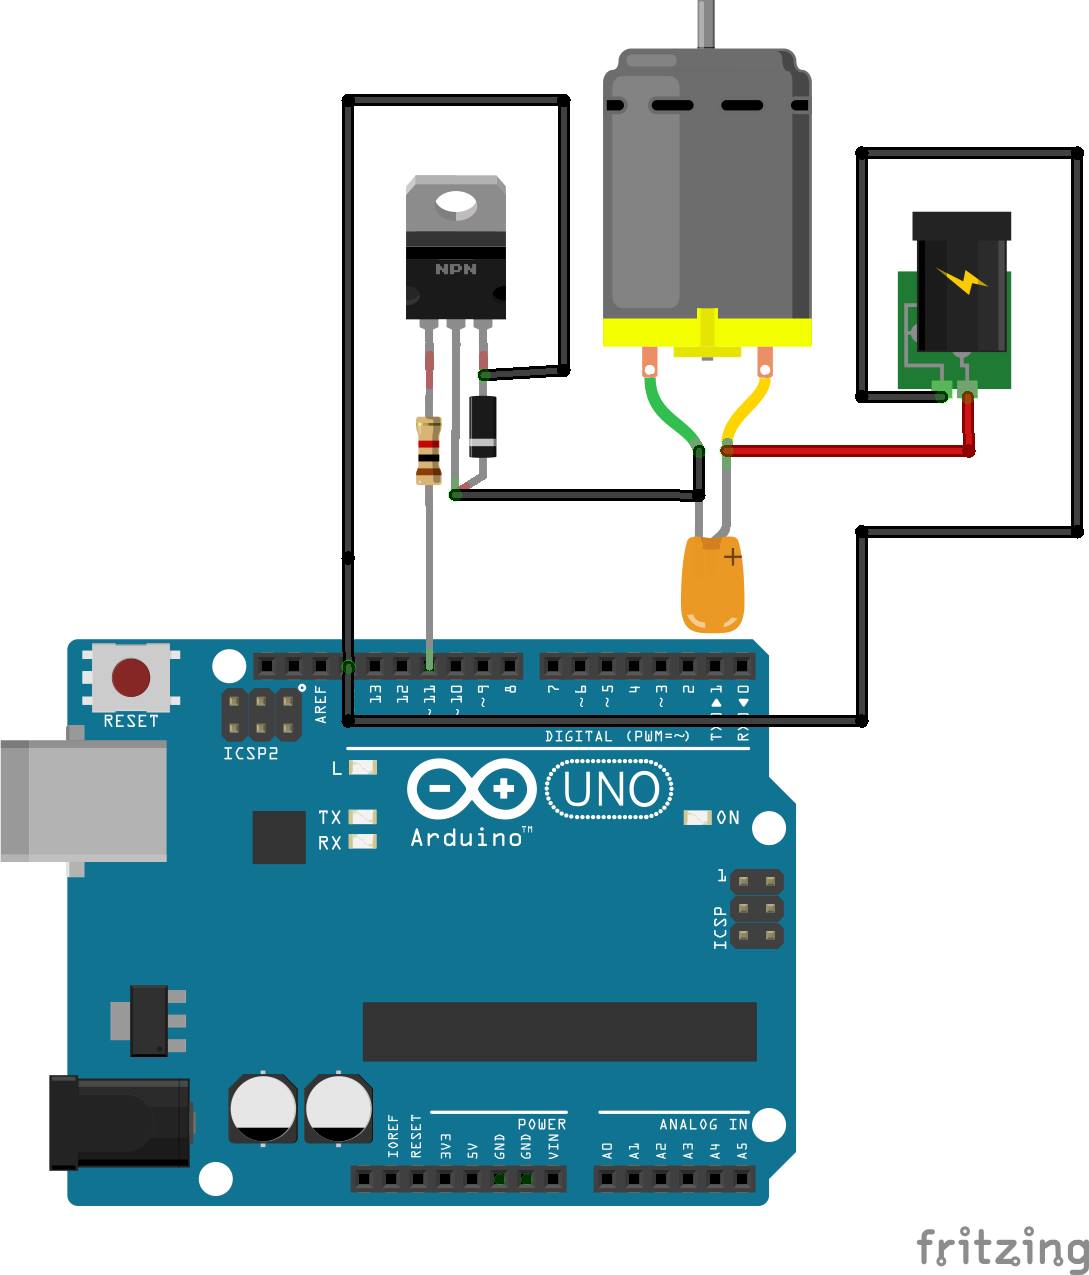
I’ll be working with a platform called Arduino, which is a single board microcontroller and an open source development platform. It provides a way to create devices which interact with the environment, with sensors, for an example.

The sensors I’ll be using are based on the Grove system manufactured by Seeedstudio. Its main part is the base shield, which is plugged into the microcontroller. All the sensors are attached to this shield. I plan to include sensors for temperature and humidity of air, ultraviolet intensity, air quality and water temperature. Initial plans were to also measure the pH and electric conductivity of the water, but this part seems a bit problematic at the moment.

My system will measure the data points and push them to the web server using HTTP GET. That’s why I plan to use the Arduino Yún board, which has built-in Ethernet and WiFi support. The user interface will visualize the data stream by drawing real time charts of it.

Sounds like fun, doesn’t it? 🙂

UPDATE: My source code is now online on GitHub!

I have proceeded as planned and used an Arduino Yún board with the Grove sensors. The sensors include a temperature and humidity sensor (DHT22), an ultraviolet light sensor (GUVA-S12D), an air quality sensor (TP-401A) and a 1-Wire temperature sensor (DS18B20), which is used for monitoring the water temperature. These are all connected to the Grove base shield, which in turn is connected to Yún, to avoid any unnecessary tinkering.

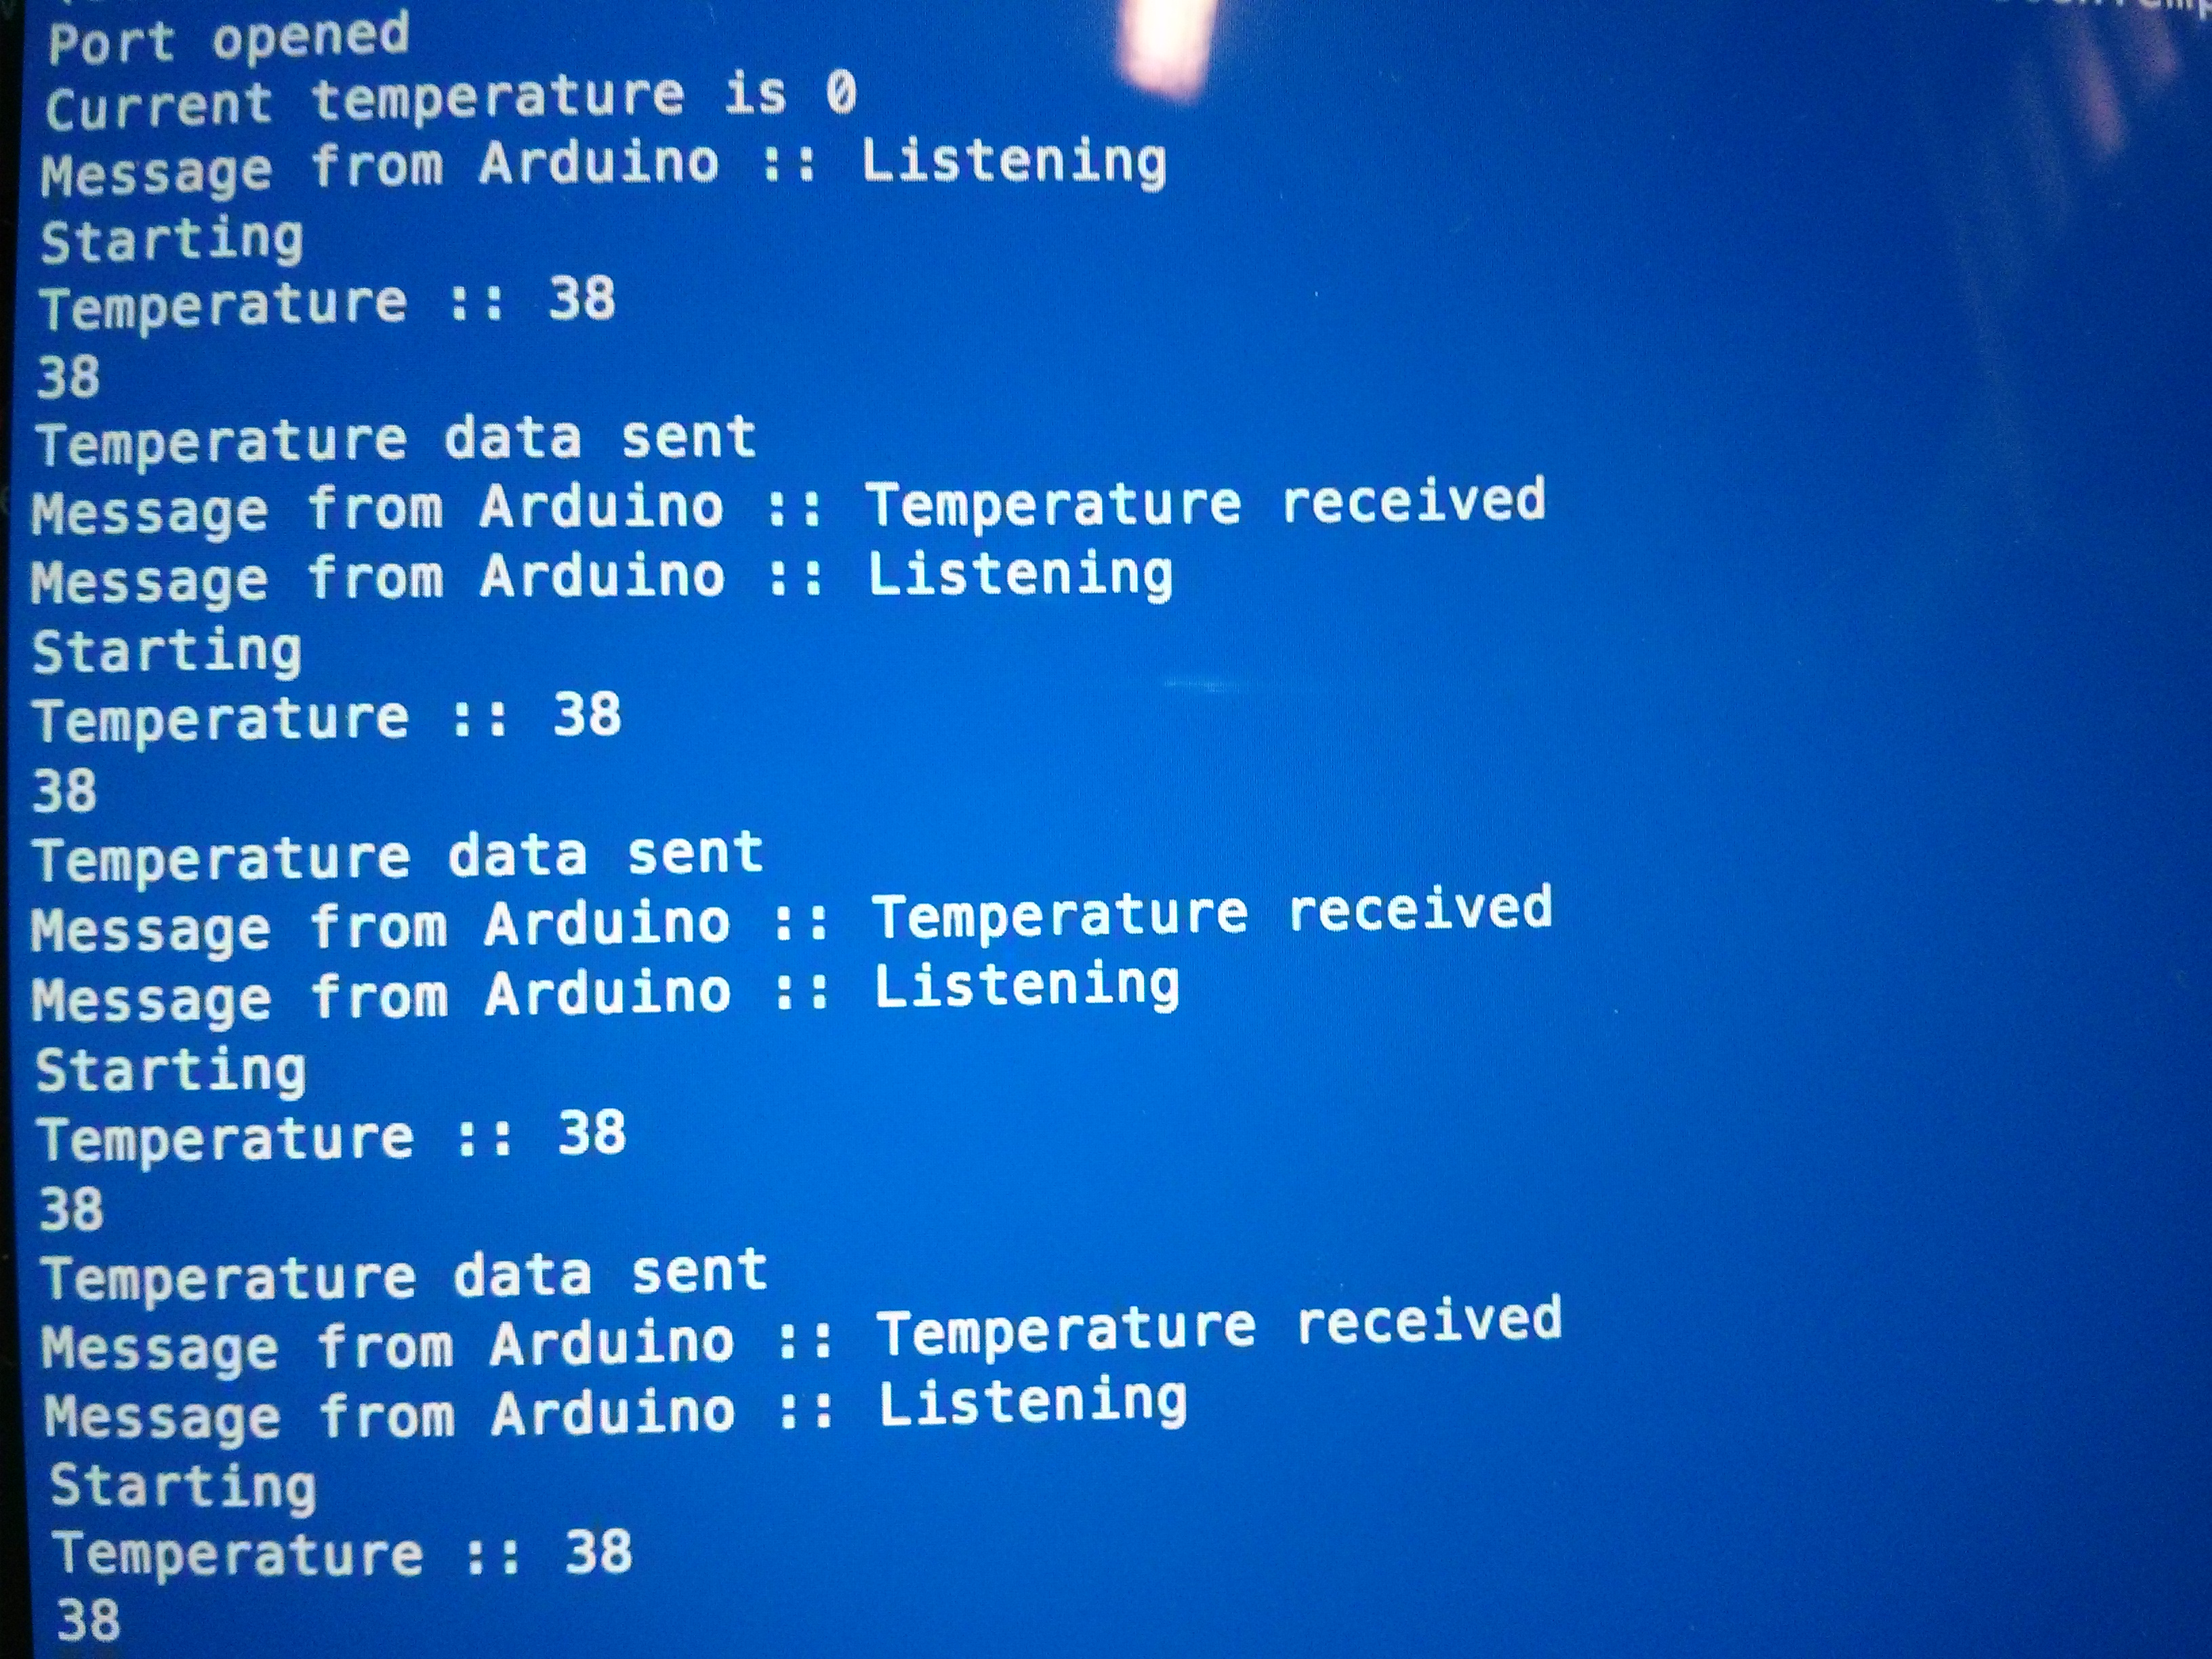
The code for the Arduino includes an instance of a HTTP client, which uses GET to send different data values to the Exactum Greenhouse web page. The sensor values are read using corresponding libraries, which are also available on GitHub. The hardest part for me in this project must have been understanding these libraries and how they function.

I learned a lot about Arduino and using different sensors on this course, and I plan to continue developing using this platform. My knowledge of electronics in general has also improved significantly. I will also continue working on my hydroponics system in the autumn. Plans are to hack a commercial product by integrating my system seamlessly with it, but we’ll see what happens in the future. 😉

Internet of Things: Think Visual

My target for this course is to create a system where it is possible to track measurements from multiple sensors in real-time, and to do this in a scalable way. What I mean by scalable is that it should be possible to add at least dozens of sensors to the network, and the results should be easily monitored and understood. The emphasis is thus not so much on the code that is written for the devices, such as arduino, but more on the whole architecture. The code in individual arduino board should not be dependent of the way the results are shown for the end-user, only a URI where the data is sent is needed.

The system is push-based in the sense that data is pushed from the sensors to a database, from which it can be processed or used as wanted. Here, a Firebase database is used to be able to update a web-client immediately when a new reading is received. Otherwise the web-client would have to poll for new values.

The results

I created a web application where users can registrate and login and create their own channels for receiving and showing data. Each channel has its own chart-view and can have multiple time-series’ of data. Chart-view was chosen so that historical changes can be easily noticed from the view. The data in each series in a channel updates in real-time, so that data that is send from a remote device immediately shows in the chart without polling for server or doing a page load.

The arduino part that I made consists of an Arduino duemiliano board, an Ethernet-shield and a DHT11-sensor. DHT11-sensor can measure temperature and humidity, which were used to calculate also the dew point. All the three values are sent to a proxy-server (because Firebase can only handle SLL-connections, which is a bit too much for arduino), which sends them to Firebase. The web-application has a connection to the user’s Firebase-channel and updates the chart.

A great majority of my time went to building the web-app. The arduino code was pretty trivial, as I only needed to be able to send data out and not do any processing on incoming data. All in all, I am very happy of the result, and will probably continue to develop the web-client.

egh_bb

Schema of the arduino board, Ethernet shield and DHT11 sensor


screenshot

Example view of the app with three series in one channel


Automatic Air Flow Regulation System for Exactum Greenhouse

The greenhouse is a glass container with very little openings. In summer when it is really hot inside, we need to blow cold air. A fan would be the best possible tool for that purpose. Nobody really has time to switch the fan on and off time to time, in the morning and at night, at sudden rise or fall of temperature. Therefore it is required to have a fan that switches on /off and also regulates automatically. Thanks to the Magical Flower Pot that already has a DS18B20 1-Wire temperature sensor which sends temperature readings to our Firebase database at regular intervals. I am reading those values after ten seconds and sending the temperature to Arduino, which controls the fan. When the temperature is below 20 degree centigrade the fan stays off. Above 20 degree centigrade it switches on and regulates upto three levels up.

The idea is to install two fans on two opposite side walls of the greenhouse so that air can flow properly. We will connect two fans with the same circuit. There will be a computer with the system which will run the Node Js code to fetch json data from Firebase and send to Arduino.

Components

  • 12+ V DC Fan
  • TIP 122 NPN Transistor (Datasheet)
  • Arduino UNO
  • USB Connector
  • Breadboard
  • Transistor, Capacitor (According to requirements)

Diagrams

Circuit Running FanCommunicationCircuit_diagram


Code

The code written for this is at

https://github.com/sayantanhore/Airflow-Regulator.git

Node js and npm package “serialport” is needed to run this code.

Problems Faced

I had a serious problem regarding communication from Arduino and Node Js frontend. The messages coming from Arduino appeared to be improper and I (with Samu) found out that the transfer is so fast that two subsequent messages were always colliding and spoiling both of them. We introduced a small delay from Arduino and that solved the problem.

Second thing is initially I made an incorrect circuit and “SUCCESSFULLY” fused the power source.

Conclusion

It was a great learning experience and I am looking forward for mode IOT courses in near future. THANK YOU ALL.