A monitoring system based on Light Blue Bean, node.js/Johnny-Five and d3.js
Overview
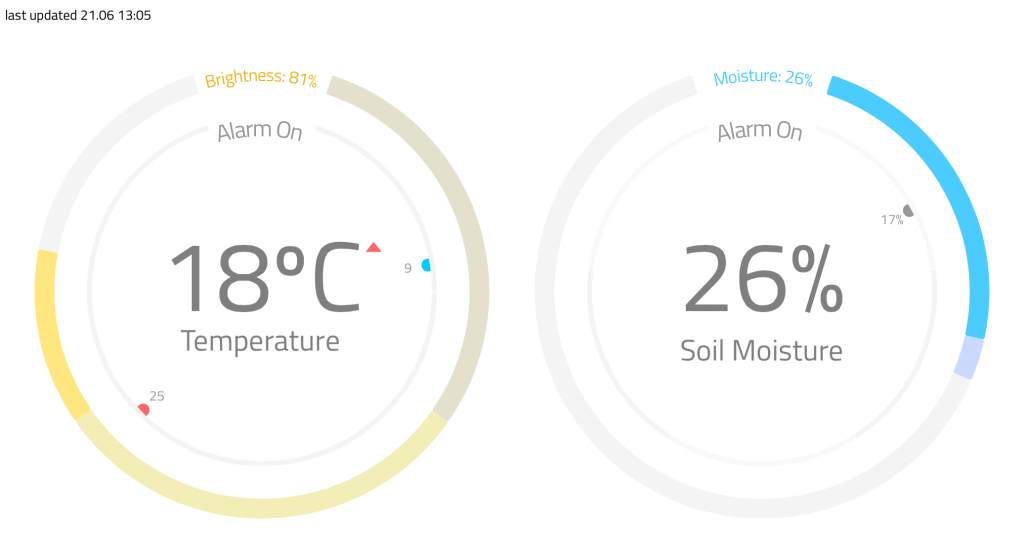
IoT is a huge trend nowadays but it doesn’t necessarily guarantee real value for users. This project is basically a simple system for monitoring plants well-being. Main focus was to present collected data in clear and readable format and offer real value (usefulness) to users. One design aspect was to offer user interaction instead of just presenting monitoring data.
- Features of the system:
- Current temperature
- Temperature trend
- Current light level
- Current soil moisture value
- Previous soil moisture value
- Alarms:
- Temperature – Adjustable low and high limit values
- Soil Moisture – Adjustable low limit value
- E-mail notifications based on user defined alarms and measurement data.
Light Blue Bean and sensors
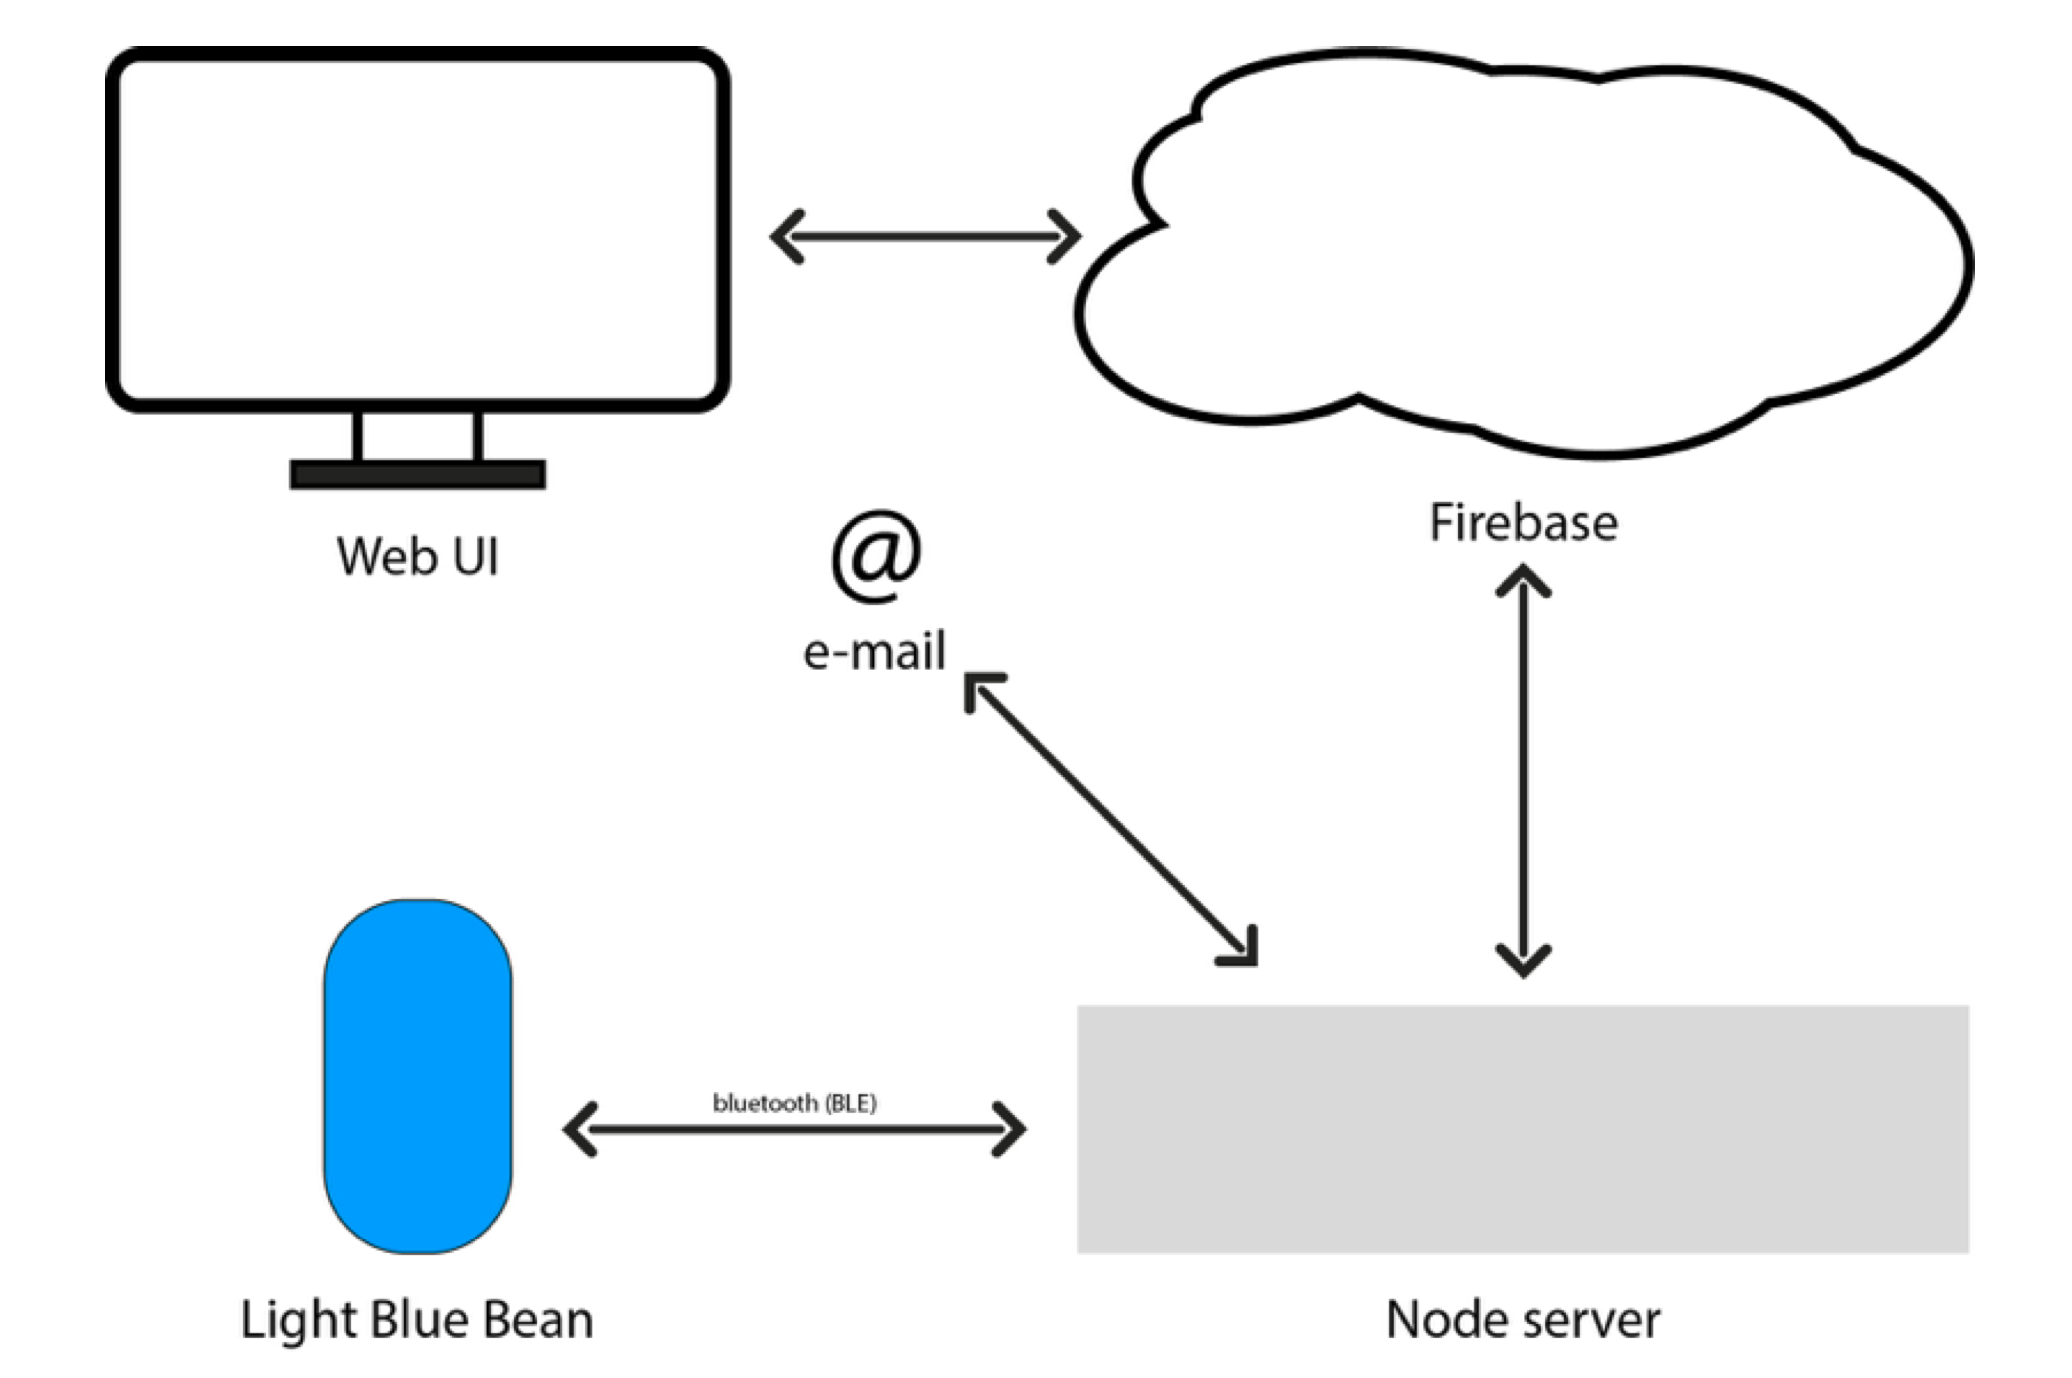
Light Blue Bean is Arduino compatible micro controller board that uses Bluetooth Low Energy for communication. Bean has 5 digital pins and two analog pins that can be used also as digital pins. The Bean has also a built-in temperature sensor, a three-axis movement sensor and a RGB led.
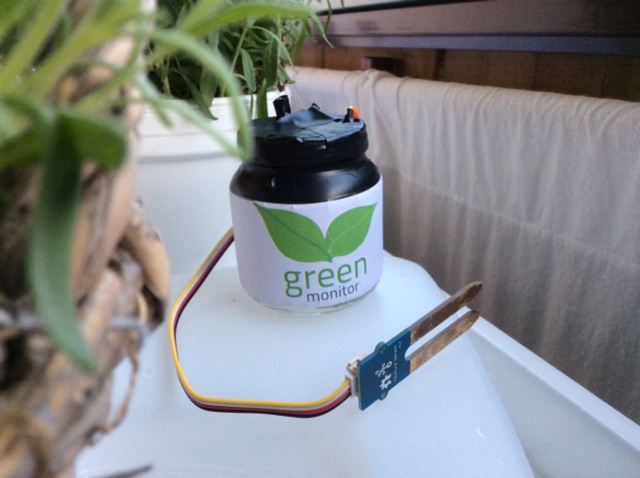
Bean includes a small prototyping board where you can solder your sensors etc. I soldered photo resistor and wires for soil moisture sensor (basic conductor sensor). I soldered also external power supply wires for small battery back. Power source for Bean needs to between somewhere between 2.6v and 3.6v. Nominal voltage for Bean is 3.3v. I used old battery case with two 1.5v AA batteries which gave me around 3.2v when batteries were full. Bean was running several days with this setup.
I installer the Bean into a small glass jar. One great advantage of the Light Blue Bean is it’s relatively small size and independence of wires (if you don’t need external sensors or power).
For starting to use the Bean you need first upload your program (sketch) to the Bean. First a sketch is loaded with Arduino IDE to the Bean Loader. Open Arduino IDE and Bean Loader programs. Select Bean from the board list in Arduino IDE. Then you can upload sketches to the Bean Loader. After that In the Bean Loader app simply connect to your Bean and upload the program. You might need to update your Bean firmware also, depending on the version your device is running.
I found out that loading sketch (firmata-bean in my case) to the Bean was unreliable. Sometimes it succeeded and sometimes not. I didn’t do any serious testing but I started to think that bluetooth signal strength might have something to do with it.
Back-end
Johnny Five framework is a JavaScript framework for controlling micro controllers / bots. Johnny five works (almost) straight out the box with common Arduino boards and you can use also other boards with dedicated IO-classes.
Light Blue Bean is plain BLE connection device so you can’t connect it with usb wire. Fortunately there is an easy way to connect the Bean to the Johnny Five with Bean-io class.
Bean’s built-in sensors are independent from the Arduino side. For polling these sensors Ble-Bean is a convenient solution.
You need to include all these plug-ins to your Node.js script. It is also mandatory to load firmata-bean sketch to the Bean. After that it is pretty straight-forward to use the Bean with Johnny-five.
One thing that is needed to take into account when programming Arduino side of the Bean is different mapping of the pins, e.g. when using analog pins A0 and A1 you need to call pins 4 and 5.
All the data was stored to Firebase. I used simple user account authentication. The data from the Bean was read and stored every two hours. When the Bean data is read script also checks if the values are within the user defined alarm limits stored in the Firebase. If the read sensor value isn’t within the user defined limits node script sends notification e-mail to the user with NodeMailer.
Sensor readings and scaling the values
I used old soil moisture sensor which was already pretty heavily corroded. I needed to adjust the value range to suit the sensor readings which were approximately half of the theoretical maximum. I scaled the values before I stored the data to the Firebase.
Light level sensor was simple photo resistor that came with the Arduino Starter Kit. I needed to adjust the scaling of the sensor readings. The readings might be linear but I decided to cut the floor limit to around the 45% of the max value which was already very dim level. This way the shown values were more in line with how humans perceive brightness. Probably plants needs also some light before anything happens.
Front-end
Front-end was made with D3.js and Angular.js. I first looked ready made re-usable charts, but I soon came to conclusion that I needed to do all the graphical presentations from the scratch with D3.js. If you want to use easily customisable charts with Angular for your data, check Angular-nvD3 or NVD3.js. I also included Ionic for easy platform conversations (iOS and Android). Ionic made it easy to run the app at certain IP so I could test the layout and usability with touchscreen devices such as iPad.
D3 part is implemented as an angular directives. Angular controller and directives listens changes in Firebase and data is updated in real time. When user changes alarm seting angular code changes Firebase database values that are also monitored by back-end.
Detected problems / difficulties
I already mentioned that there was occasional problems when I was tried to load sketches to the Bean.
I also noticed that polling data from the Beans Arduino part didn’t work well when polling frequency was high. Average time the data updated reliable seemed to be around two minutes. If the polling time was below two minutes there were usually duplicated values from previous readings even the readings should have been something else. This problem didn’t concern the Beans built-in sensors controlled by Ble-Bean which worked just fine. There’s might be an easy fix for this problem but I didn’t found out the solution. Anyhow in my final version the data was read every two hours and the data seemed to be reliable with this frequency.
Future possibilites and reflections
The user adjustable threshold values could be used for new hardware implementations such as watering the plants or controlling ventilation / shading actions. Back-end (Node.js) could easily run in Raspberry or some other low cost device.
This project was clearly a prototype. The hardware installation could be done better. I thought about using 3.5mm jacks for the power and moisture sensor connection but I just didn’t buy those. However the glass jar worked well with the photo resistor. At code level there is also room for structural improvement but considering the scope of this course I’m pretty happy for the results as a whole.
Code examples can be found here.