Overview
Phototropism, basically, causes plants to grow towards the Sun, or other source of light. In many situations, such as with the casual home gardener who grows his/her plants on a window sill, plants only get light from one general direction. As the home gardener turns his/her back to gardening duties just for a few moments (weeks), the plants might have already found their way out of the pot and, without support, creeping around their surroundings and robbing the gardener of their initial visual delight.
There is an easy solution to the problem posed by phototropism: turning the plants every now and then. However, such daunting, repetitive tasks are not for the great minds to trouble themselves with, so, a more automated solution is in order, and that is what we set to build.
Our solution forms around a very simple design using a microcontroller, servo and light sensor. The design has the plant sitting on a rotating platter that can be, ideally, turned to any angle driven by a servo. A light sensor serves to gather information on the amount of light received by the plant during a given period. A simple algorithm in the microcontroller will then rotate the plant so that in a given time frame each side of the plant will receive a similar amount of light.

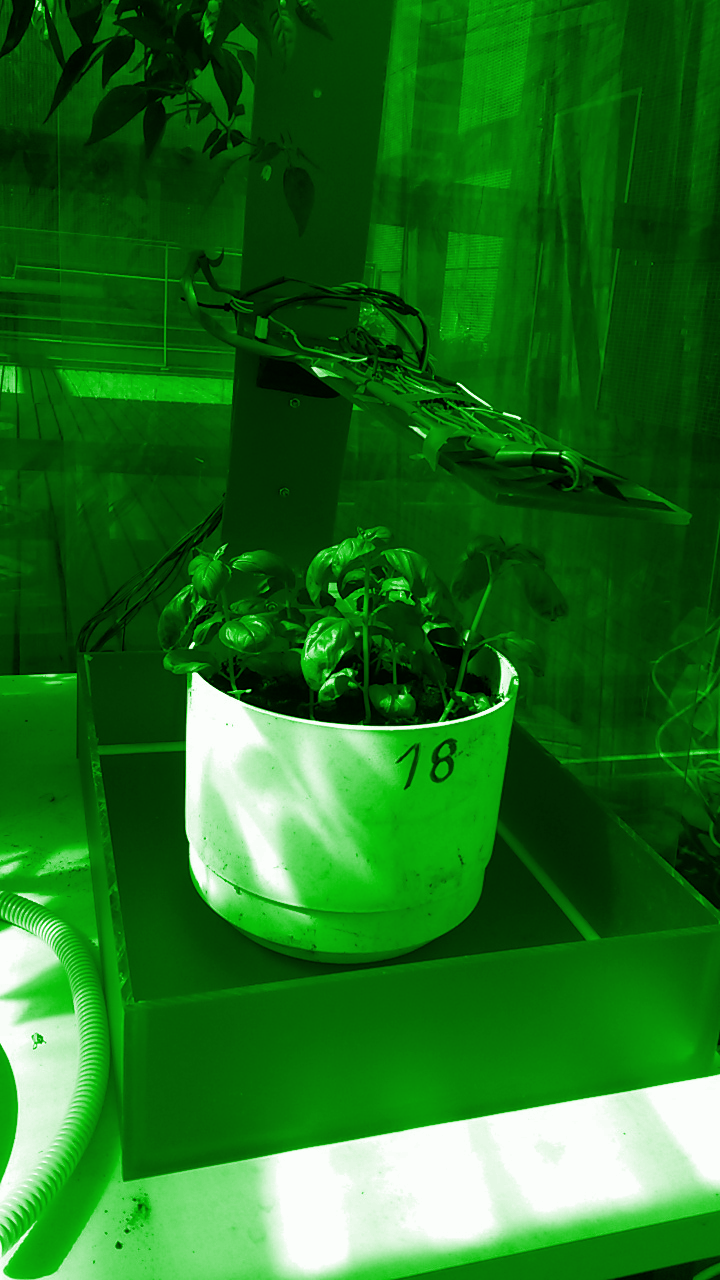
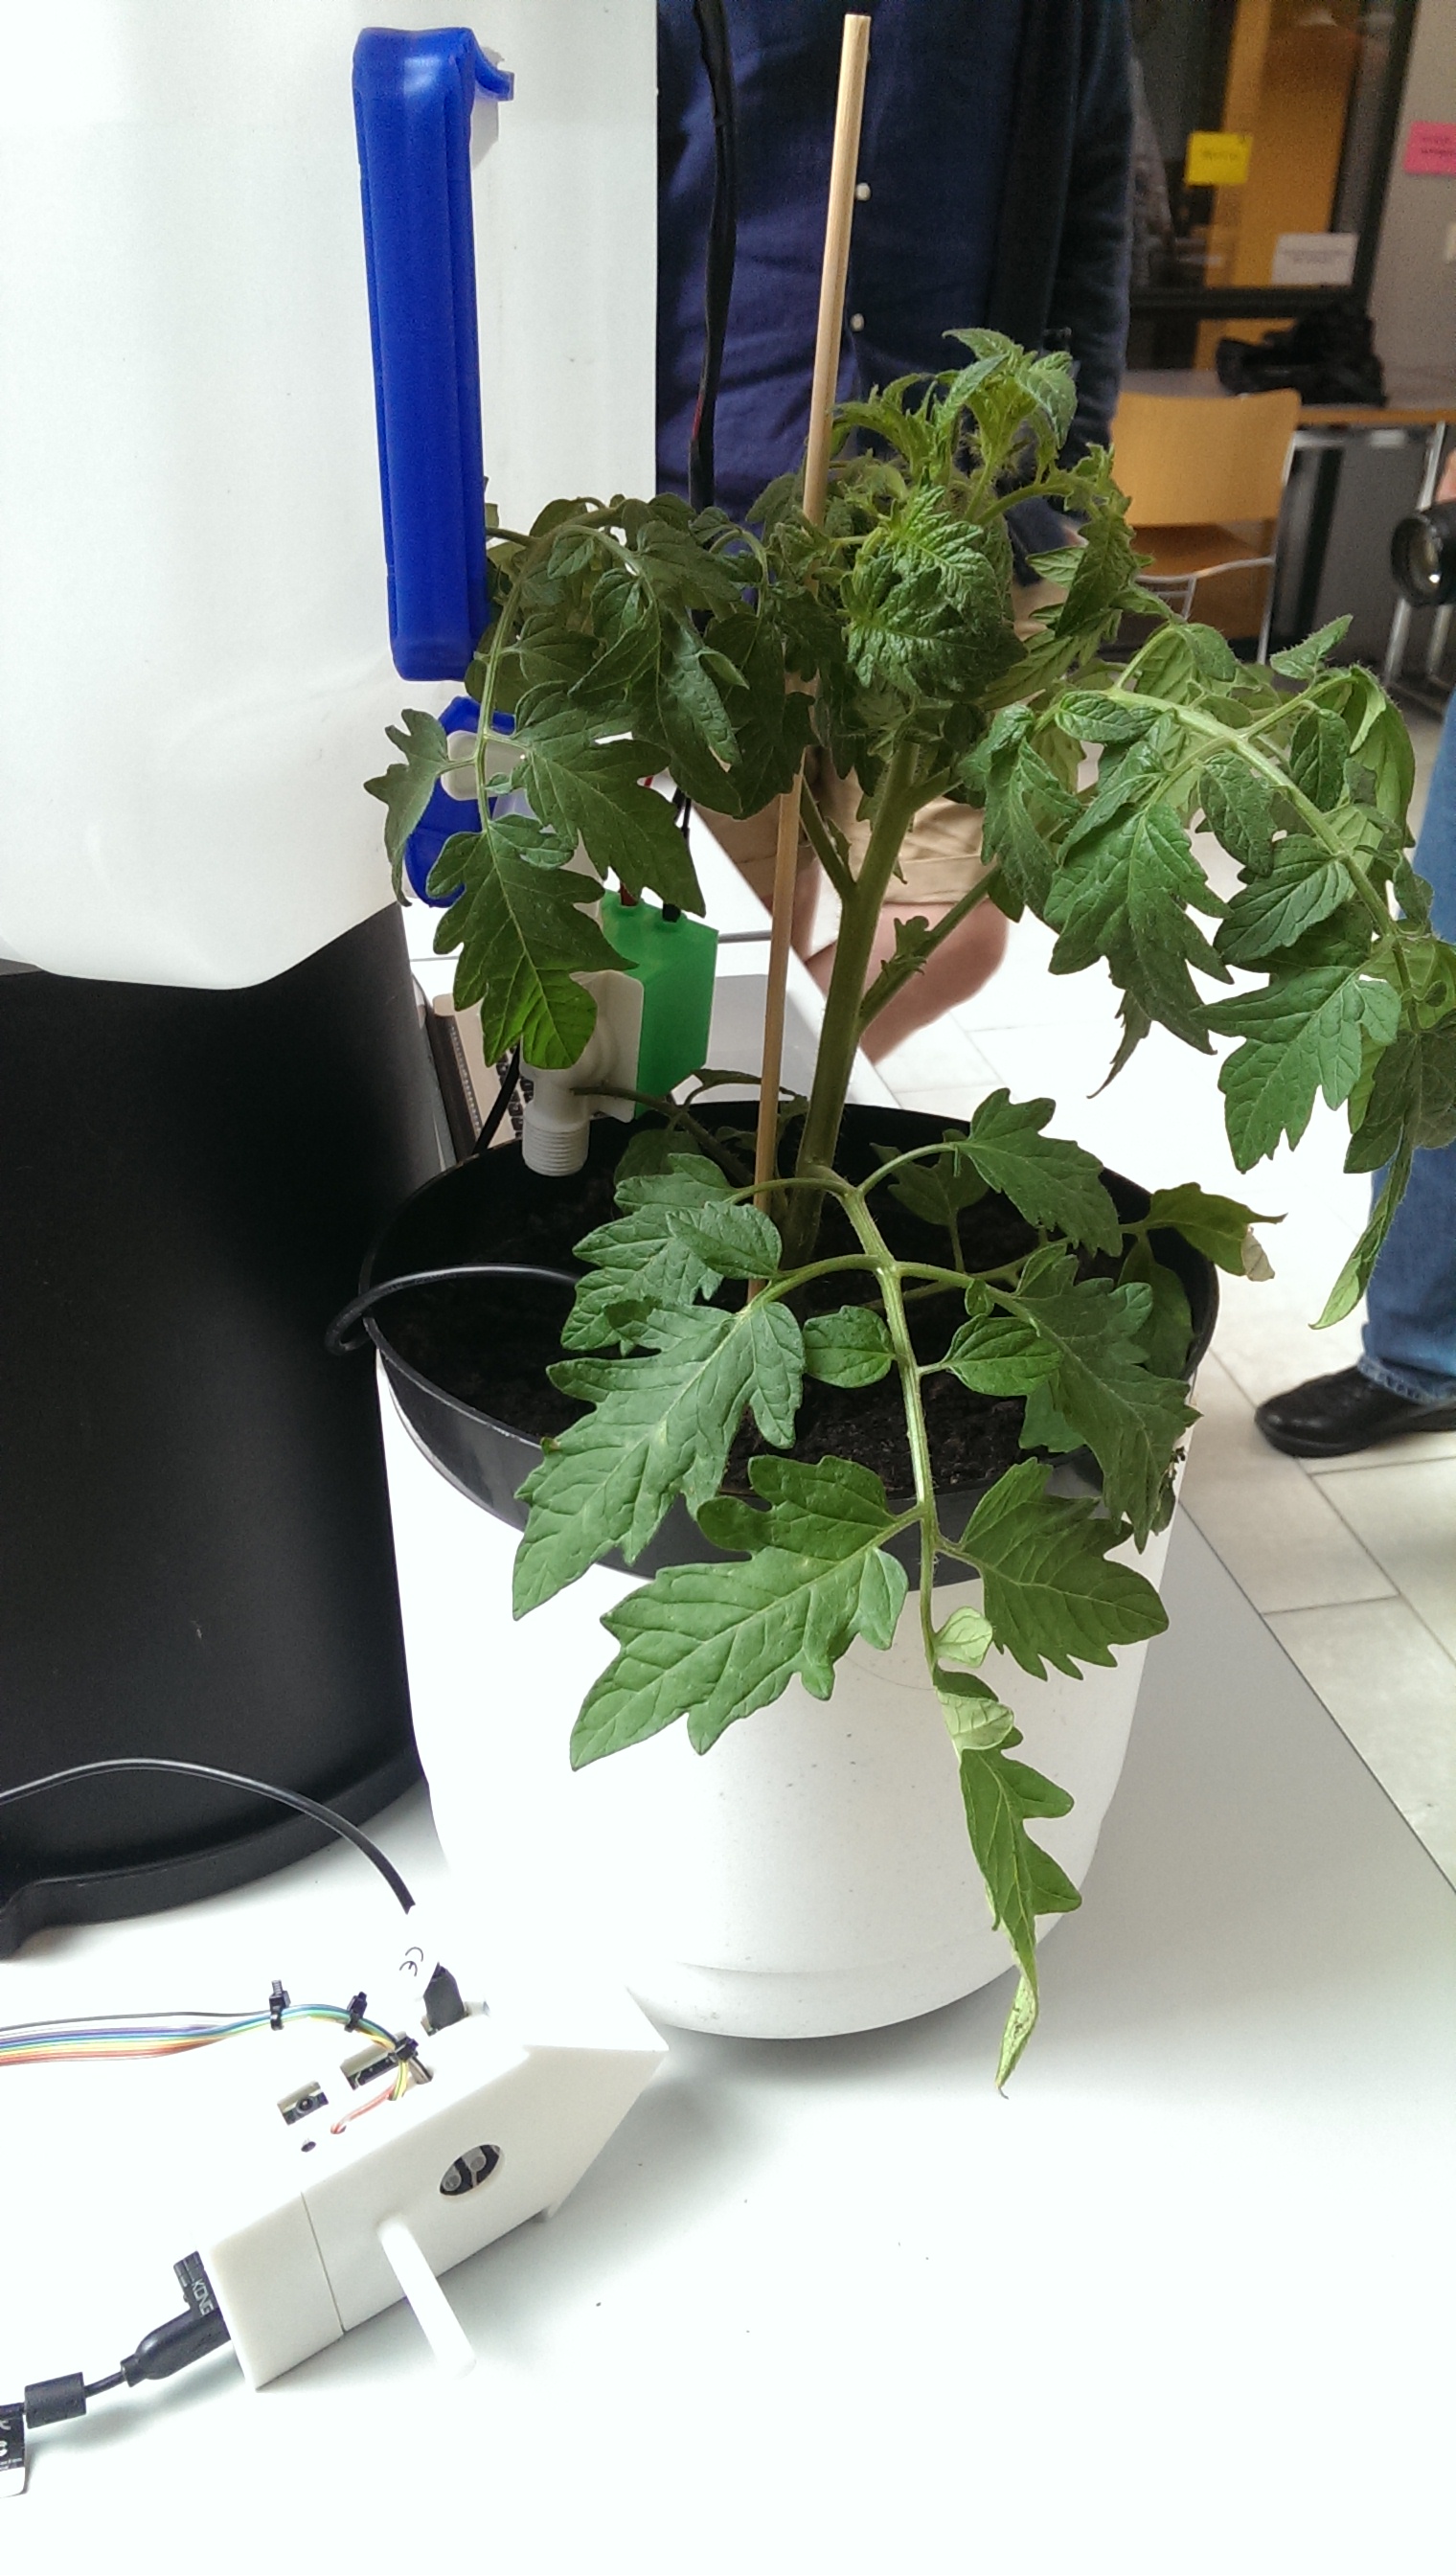
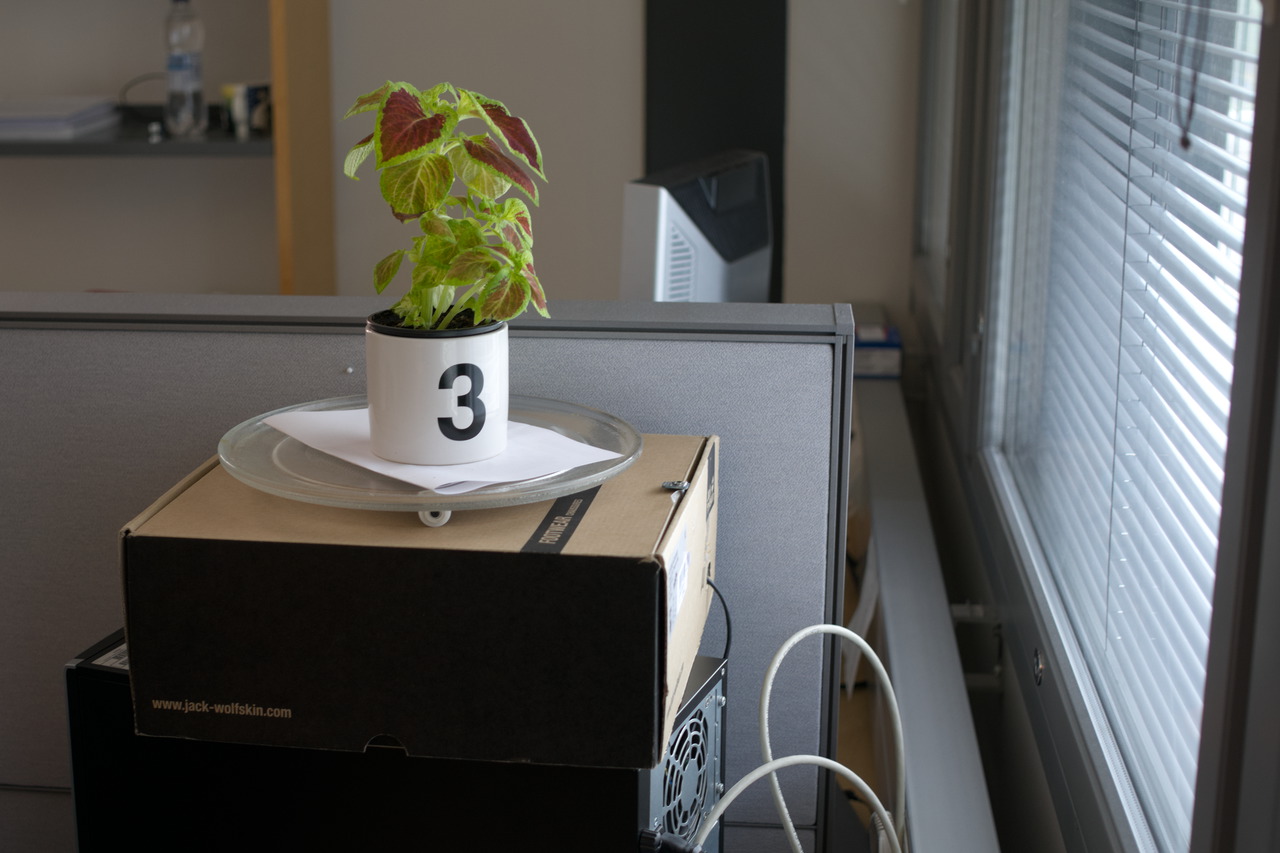
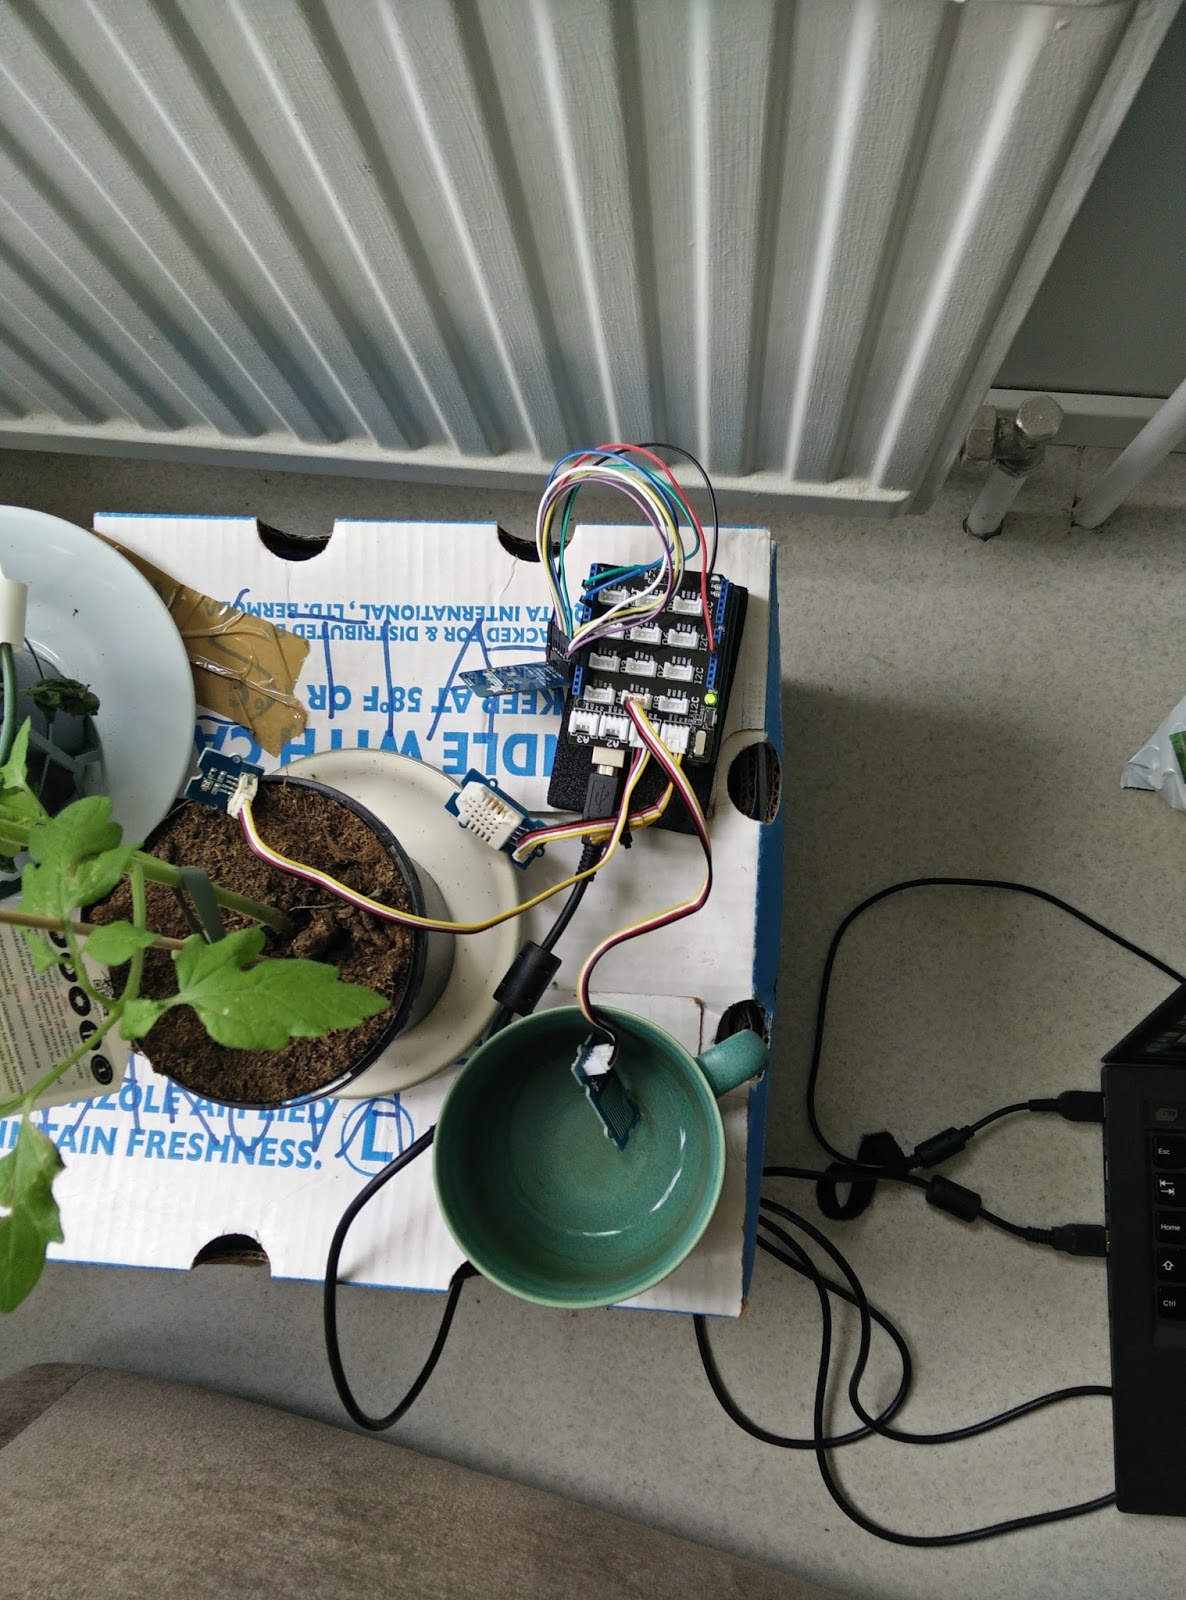
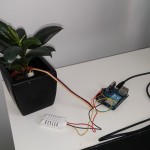
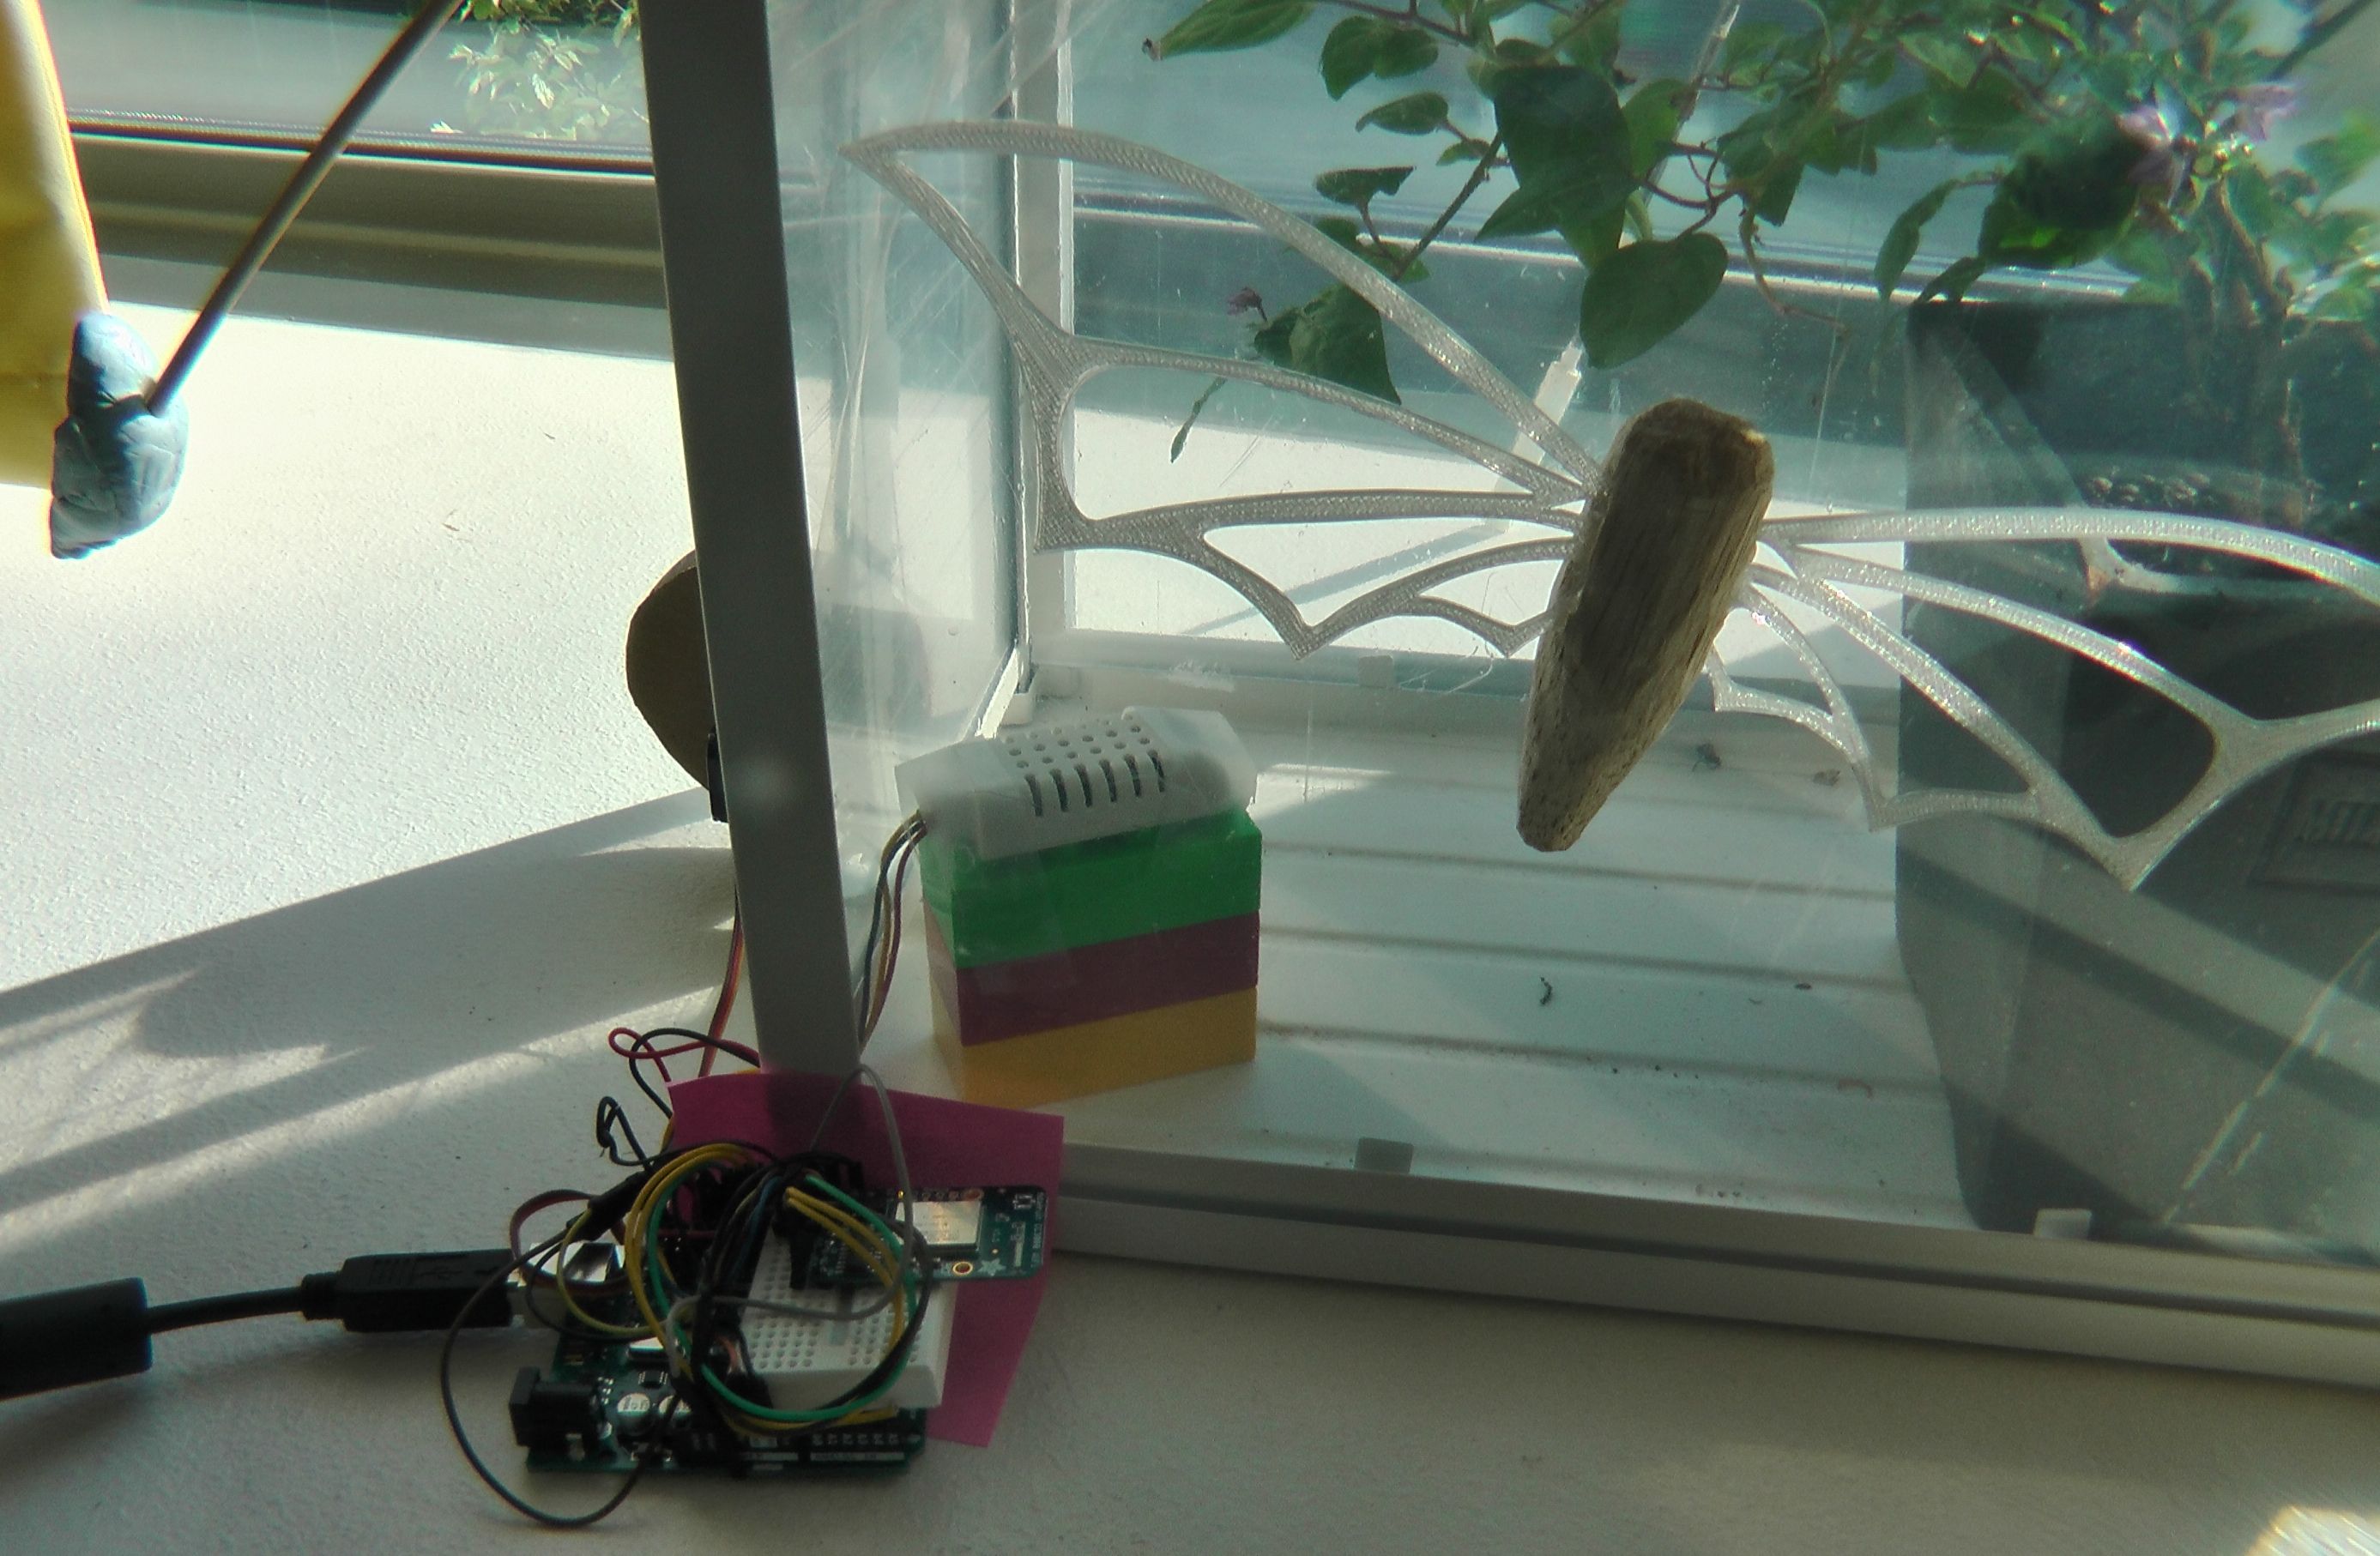
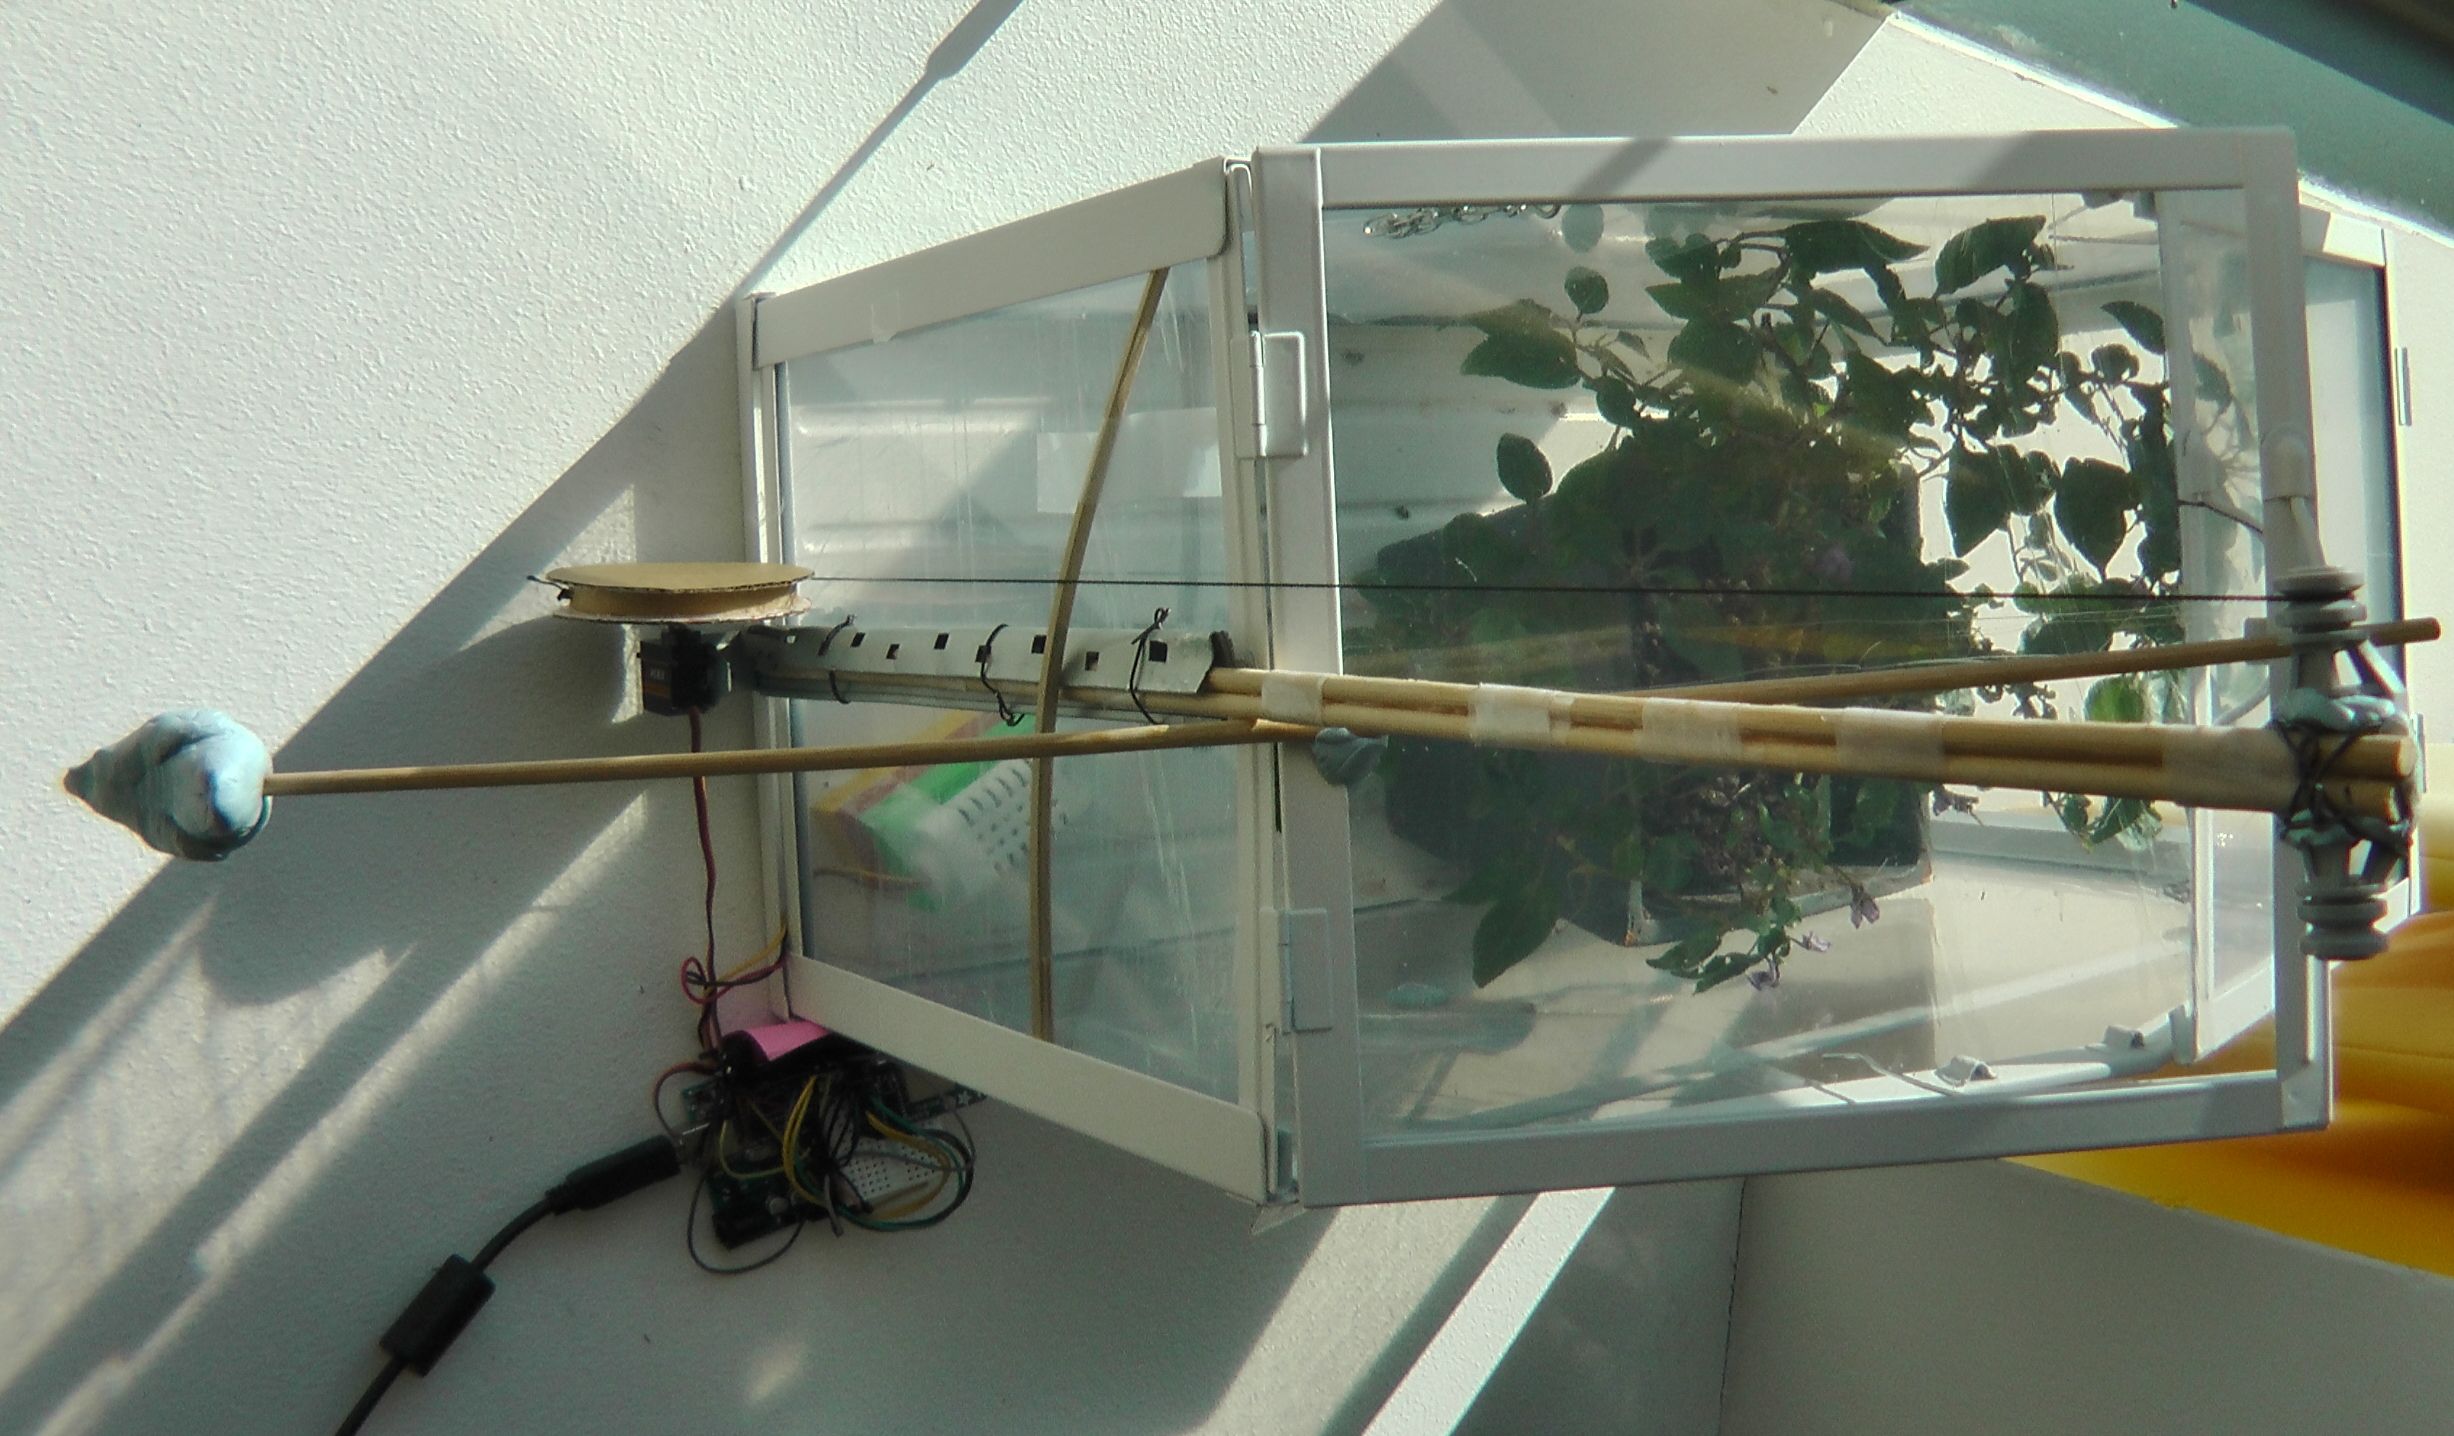
Plantspinner in action during testing
Hardware Implementation
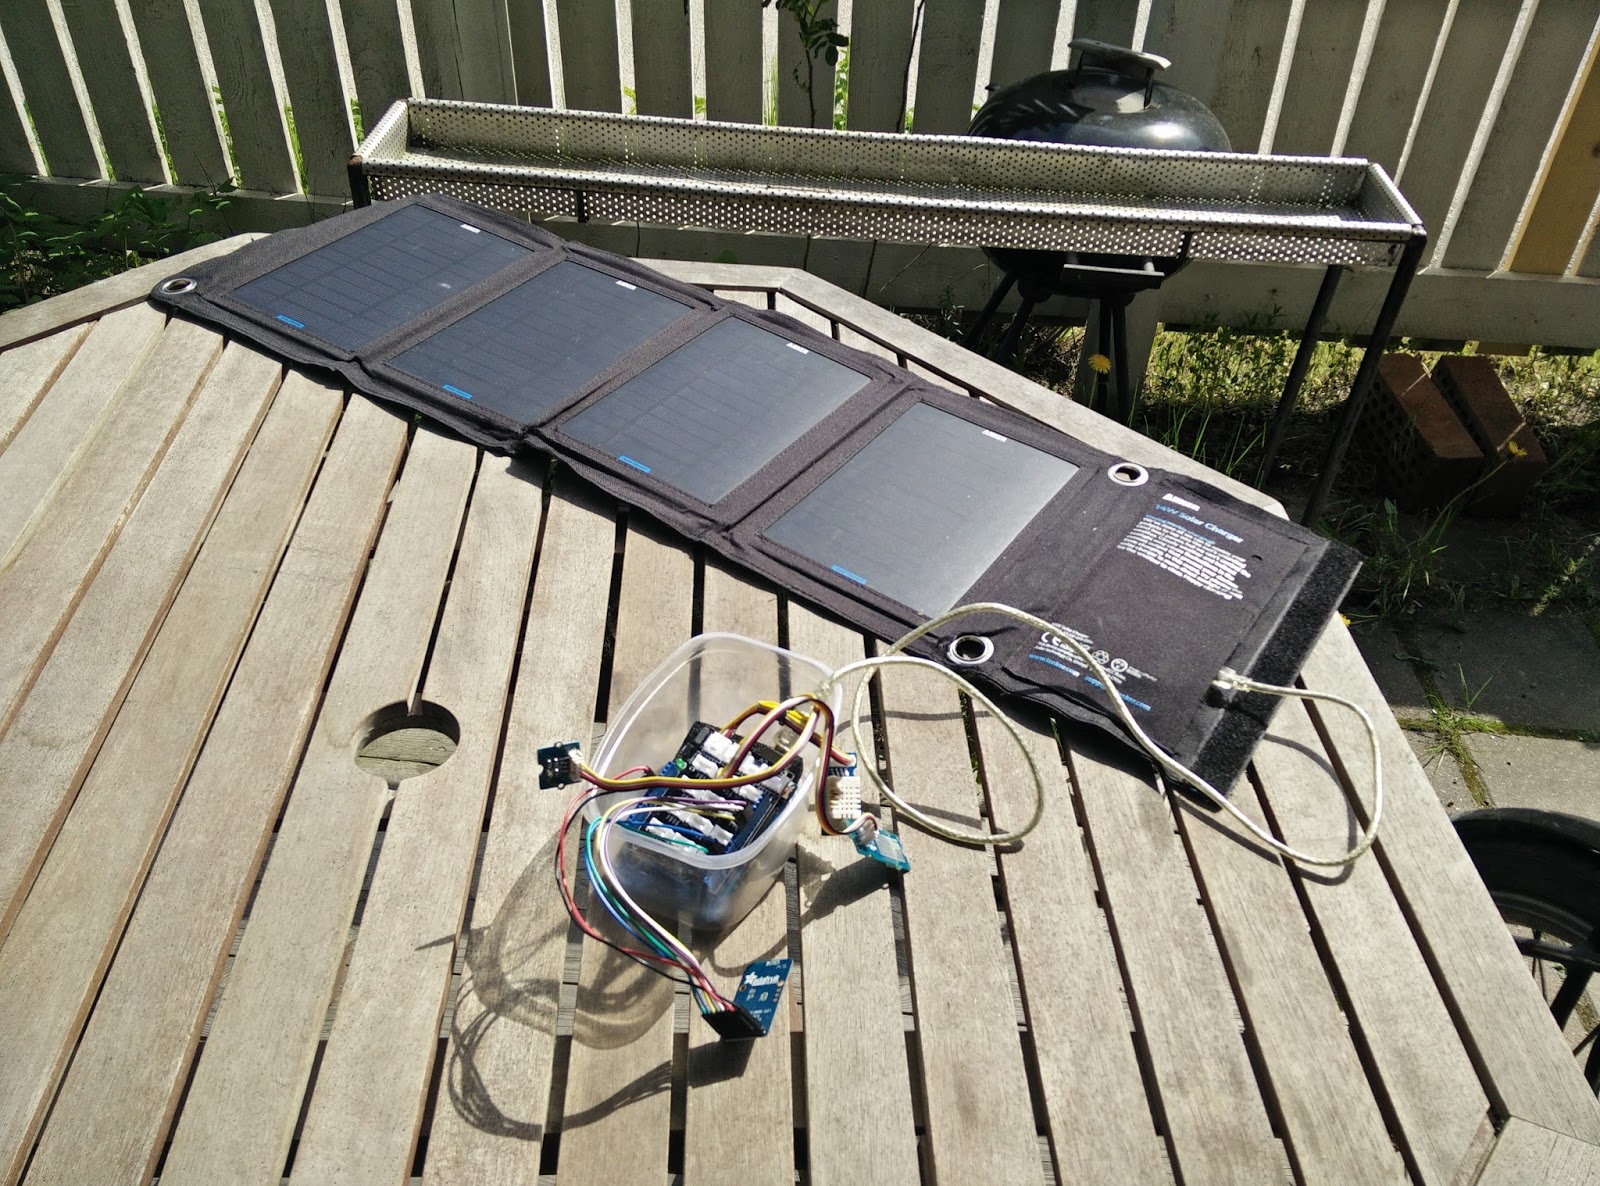
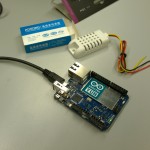
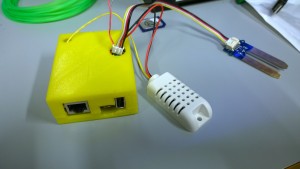
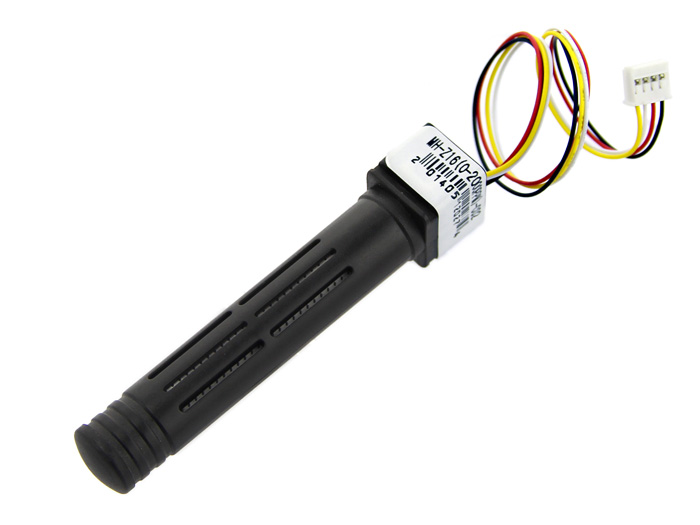
We used Arduino Yún as the microcontroller of choice, mostly because it happened to be the only microcontroller available; we did not want to use a “real computer” such as Raspberry Pi or one of the similar Intel creations. For learning, a limited platform sounded more interesting. The light sensor we got was a digital one, namely, Adafruit’s TSL2561 and the servo an AAS-752MG High Performance Race Servo (High Speed). The Yún version of Arduino is really nice for the IoT purpose, because it has an integrated WiFi board, meaning much less hassle with getting the project online.
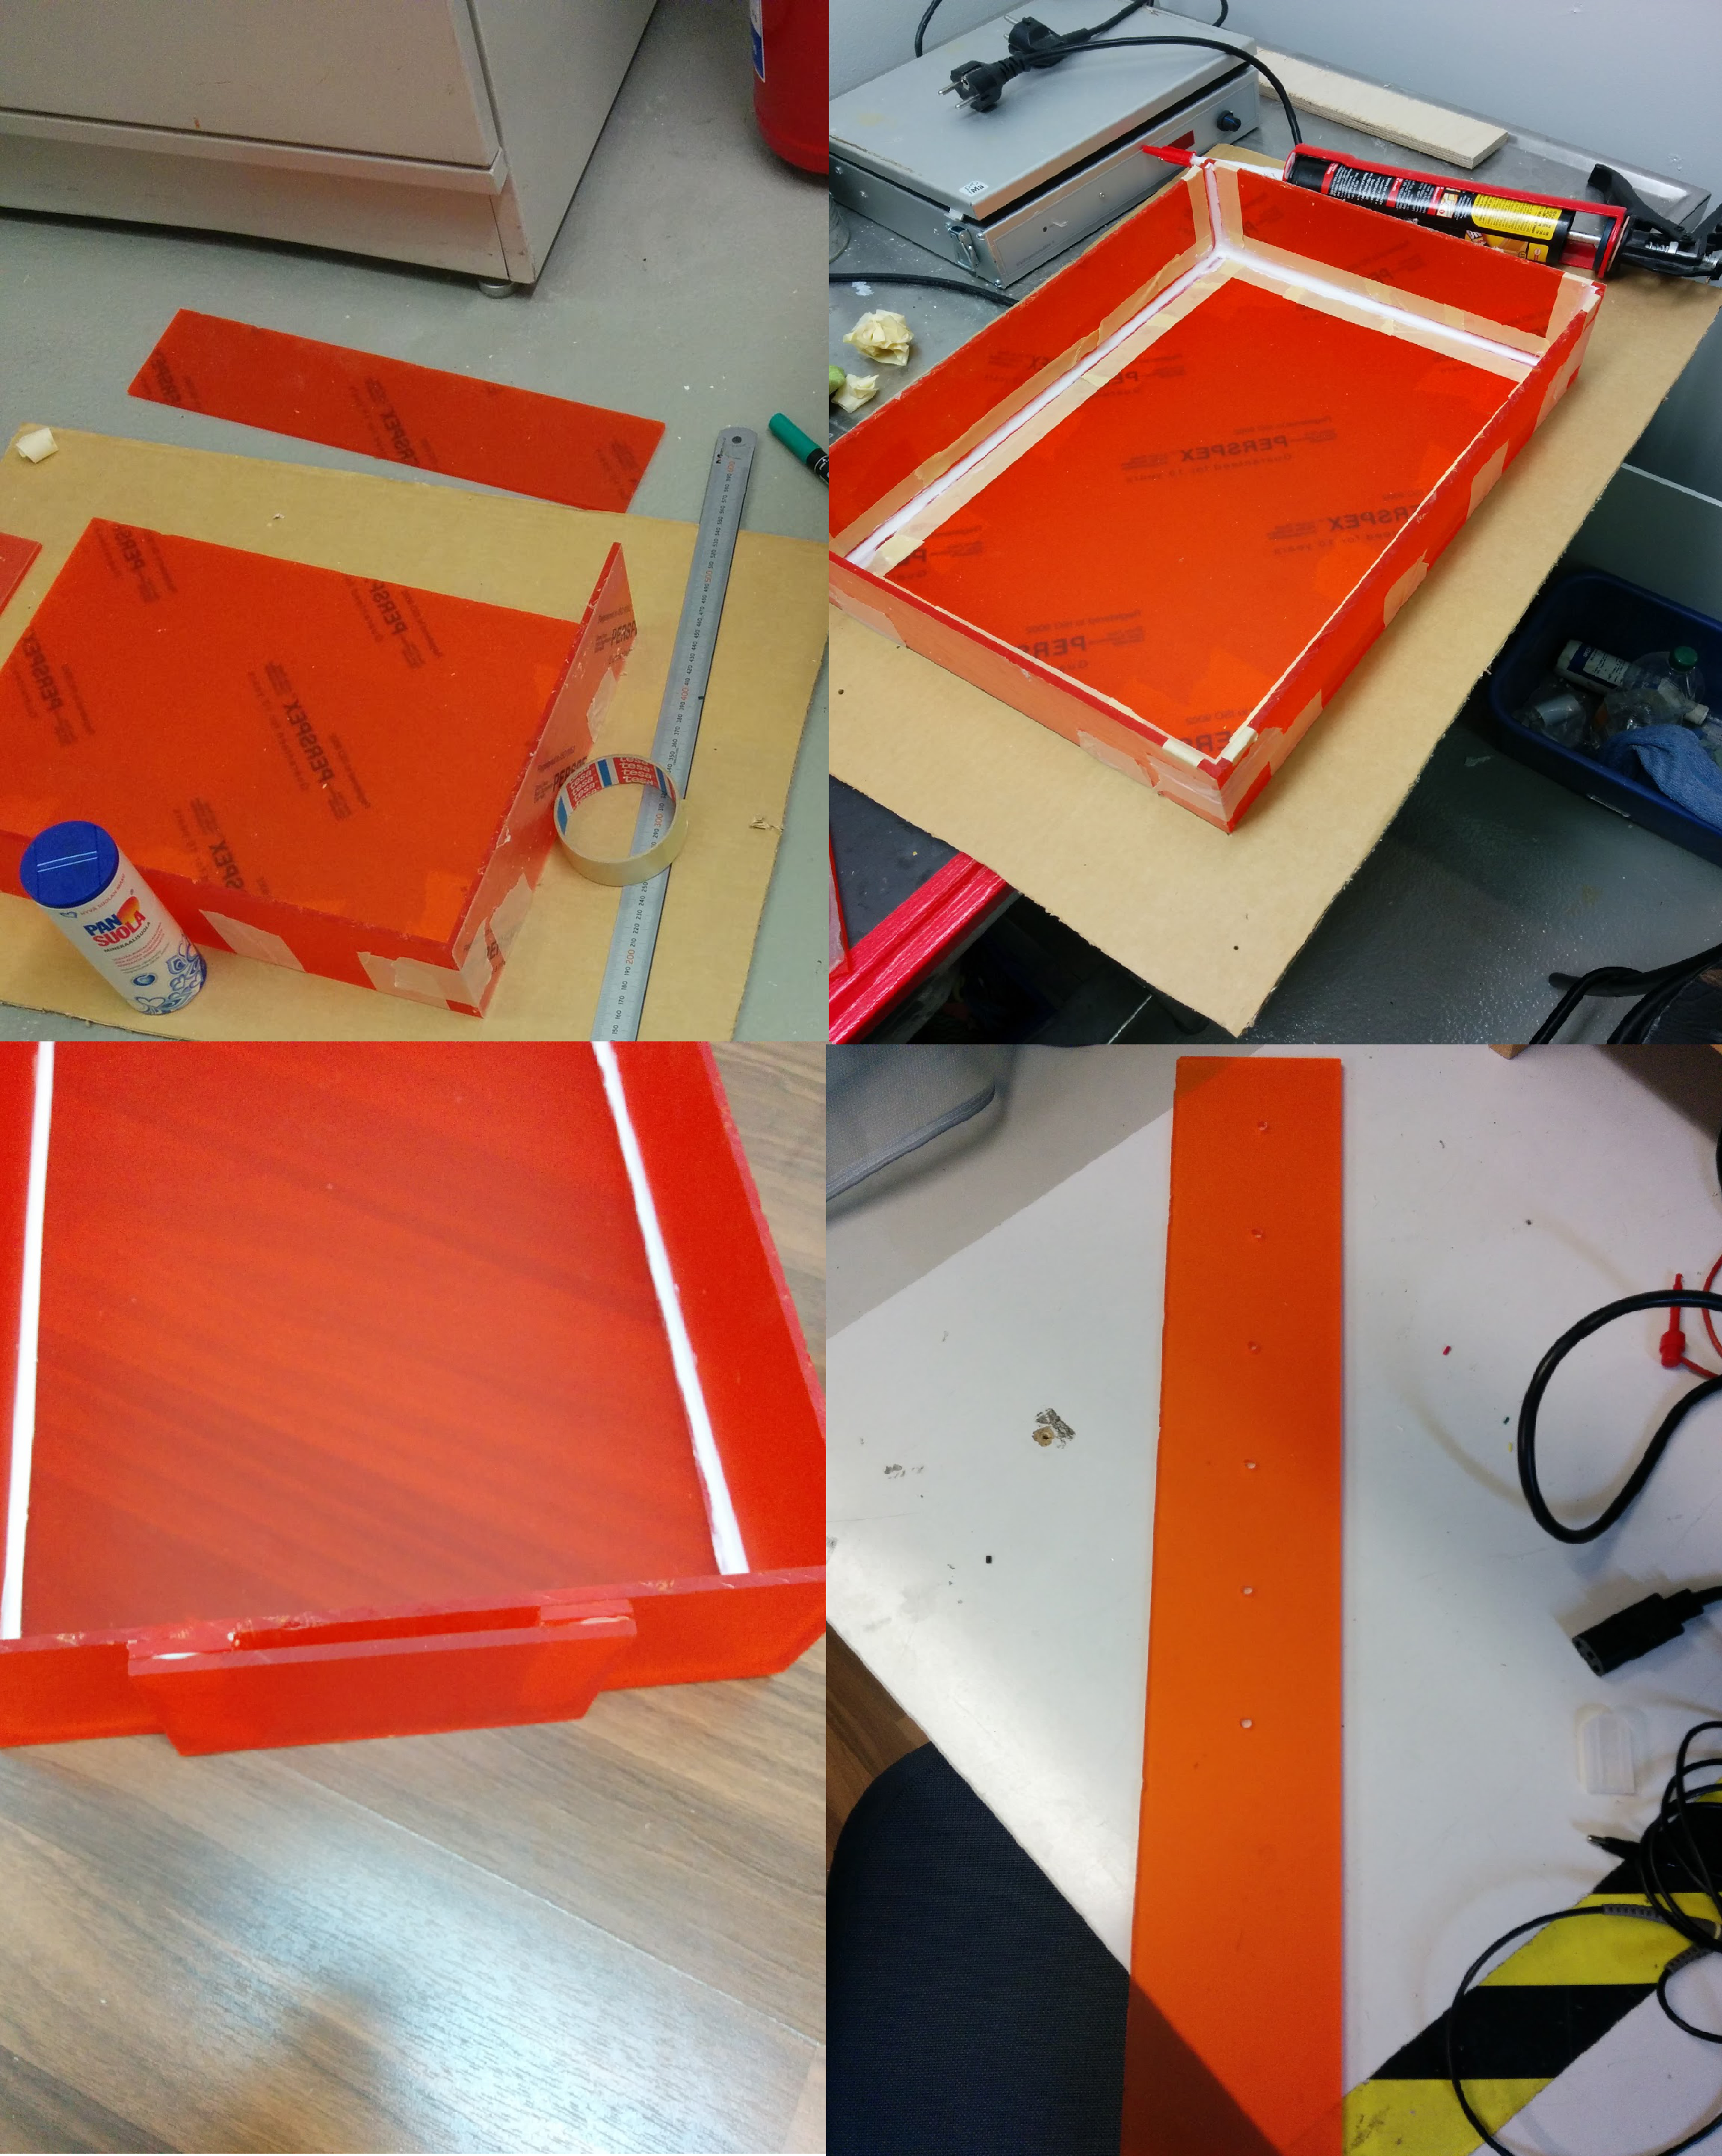
Our prototype (which later ended up being the final version as well) was built inside a shoe box made of cardboard and as such not really suitable for applications involving water – at least,
not for extended periods of time or large amounts of water.
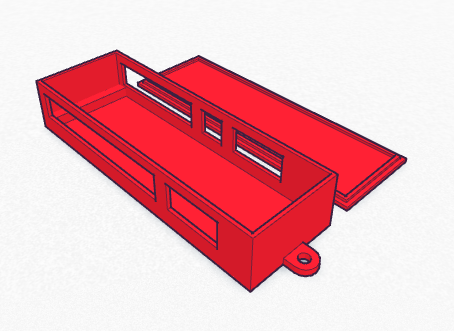
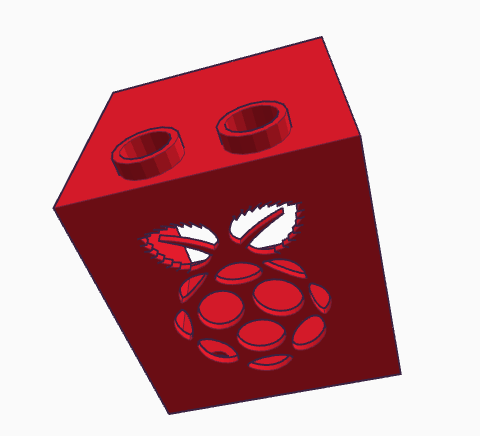
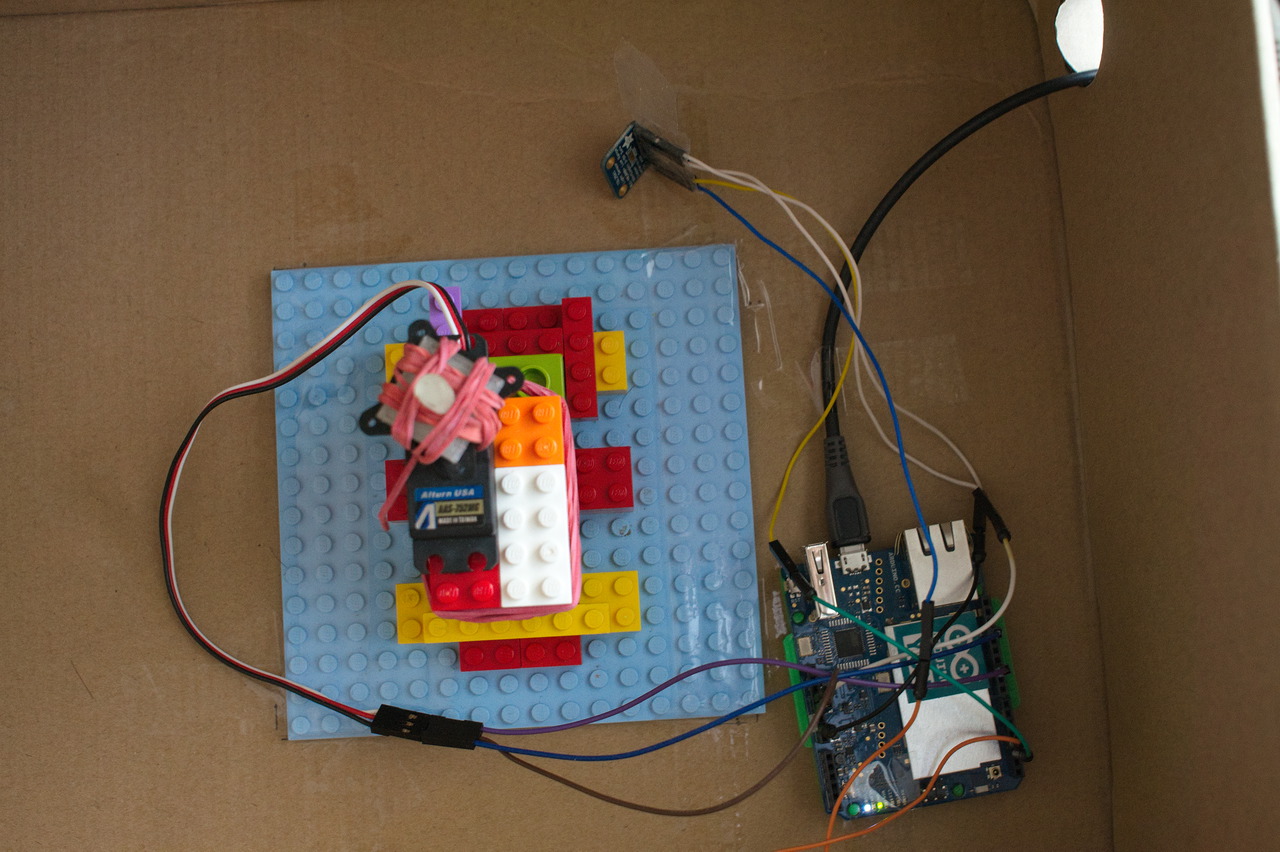
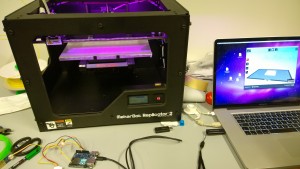
The first problem we faced with the design was that a servo usually only turns 180 degrees whereas we needed close to 360 degrees of movement. The problem was ingeniously solved by using a microwave platter and the wheel system below it to amplify the servo’s amount of rotation. A proper gear system would have been better, but we never got around to building that. A follow-up problem was connecting the servo to the microwave platter’s drive system, and that we solved by 3D printing a suitably sized shaft part and attaching that to the servo with rubber bands – a somewhat crude solution, but the 3D printer’s resolution didn’t seem to suffice for a proper toothed servo attachment. Although, we never got the highest resolution printing to actually work with the PLA filament.
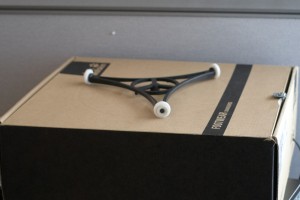
Microwave platter and a shoe box
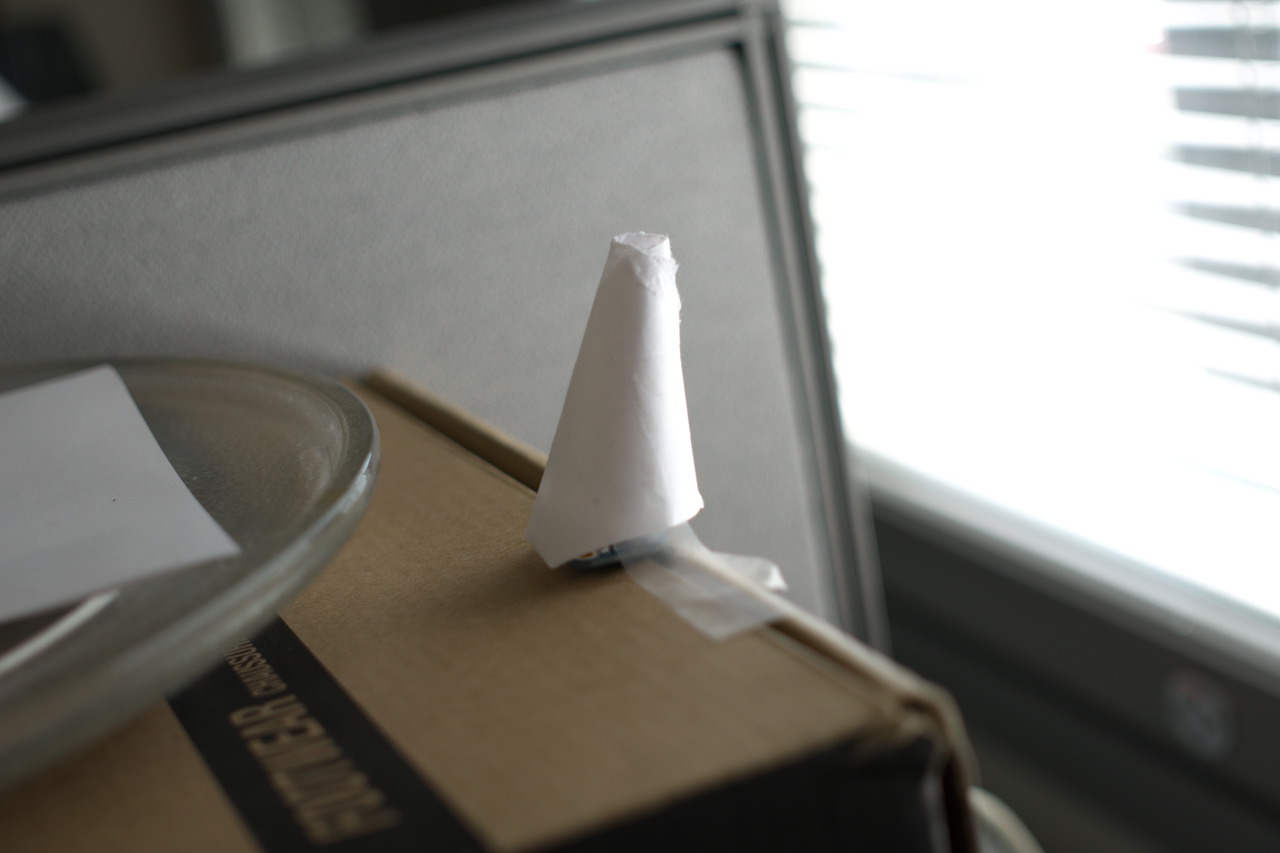
The light sensor was taped to a side of the shoe box that faced the light source. The light sensor, being digital, appeared to work fine out-of-the-box, but…on a sunny day the thing decided to overload after all. So, as we only needed relative light readings instead of absolute ones, we fashioned a small shade out of paper for the sensor to limit the incoming light.
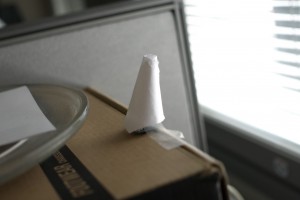
Light sensor “filter”
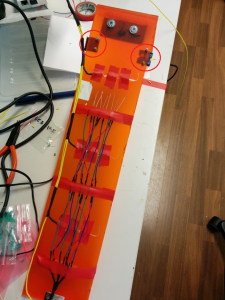
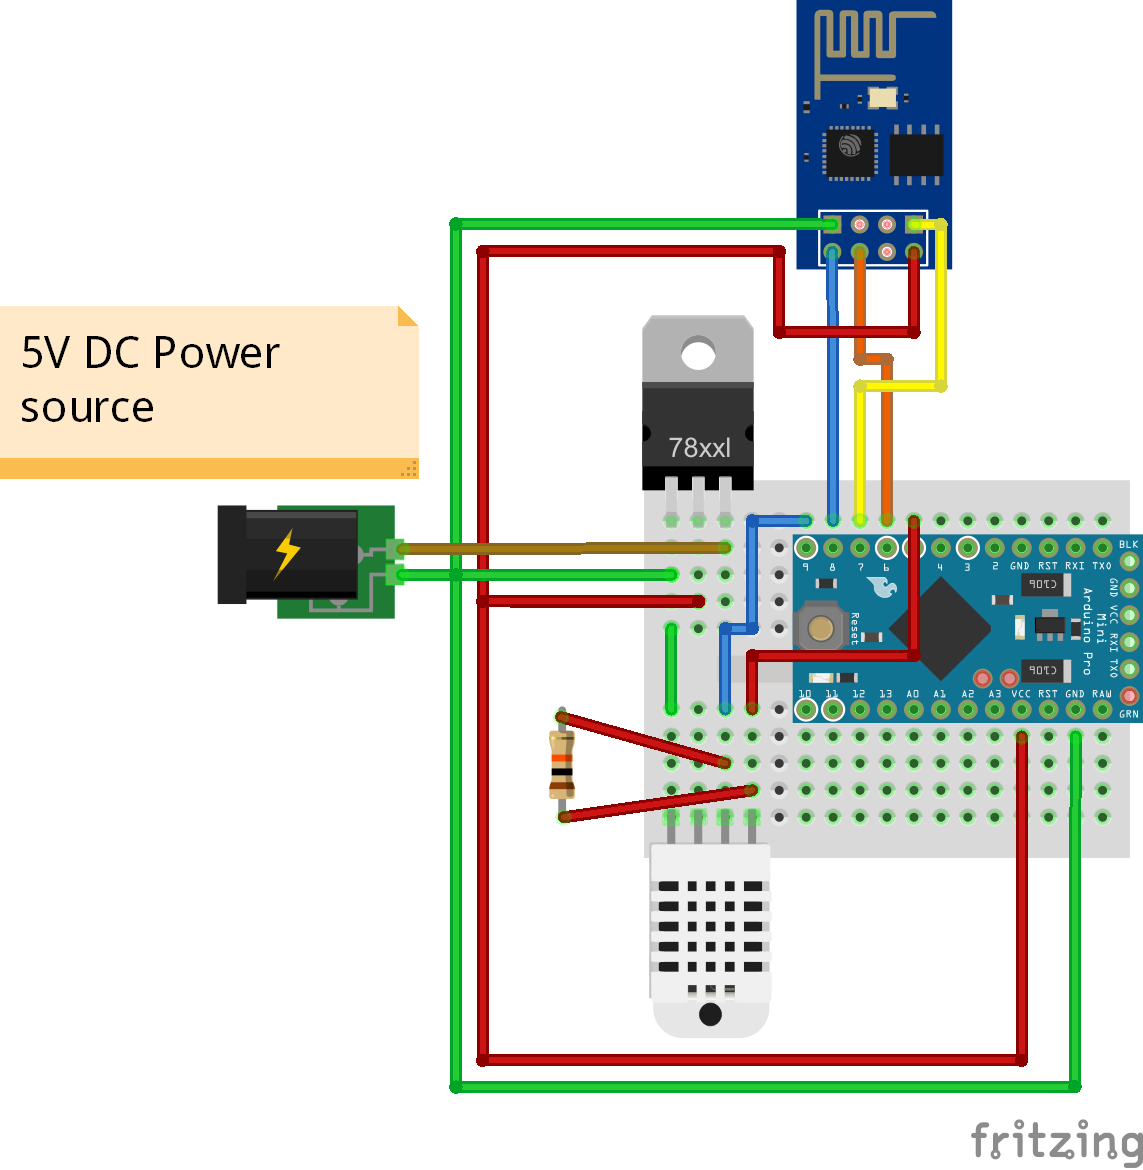
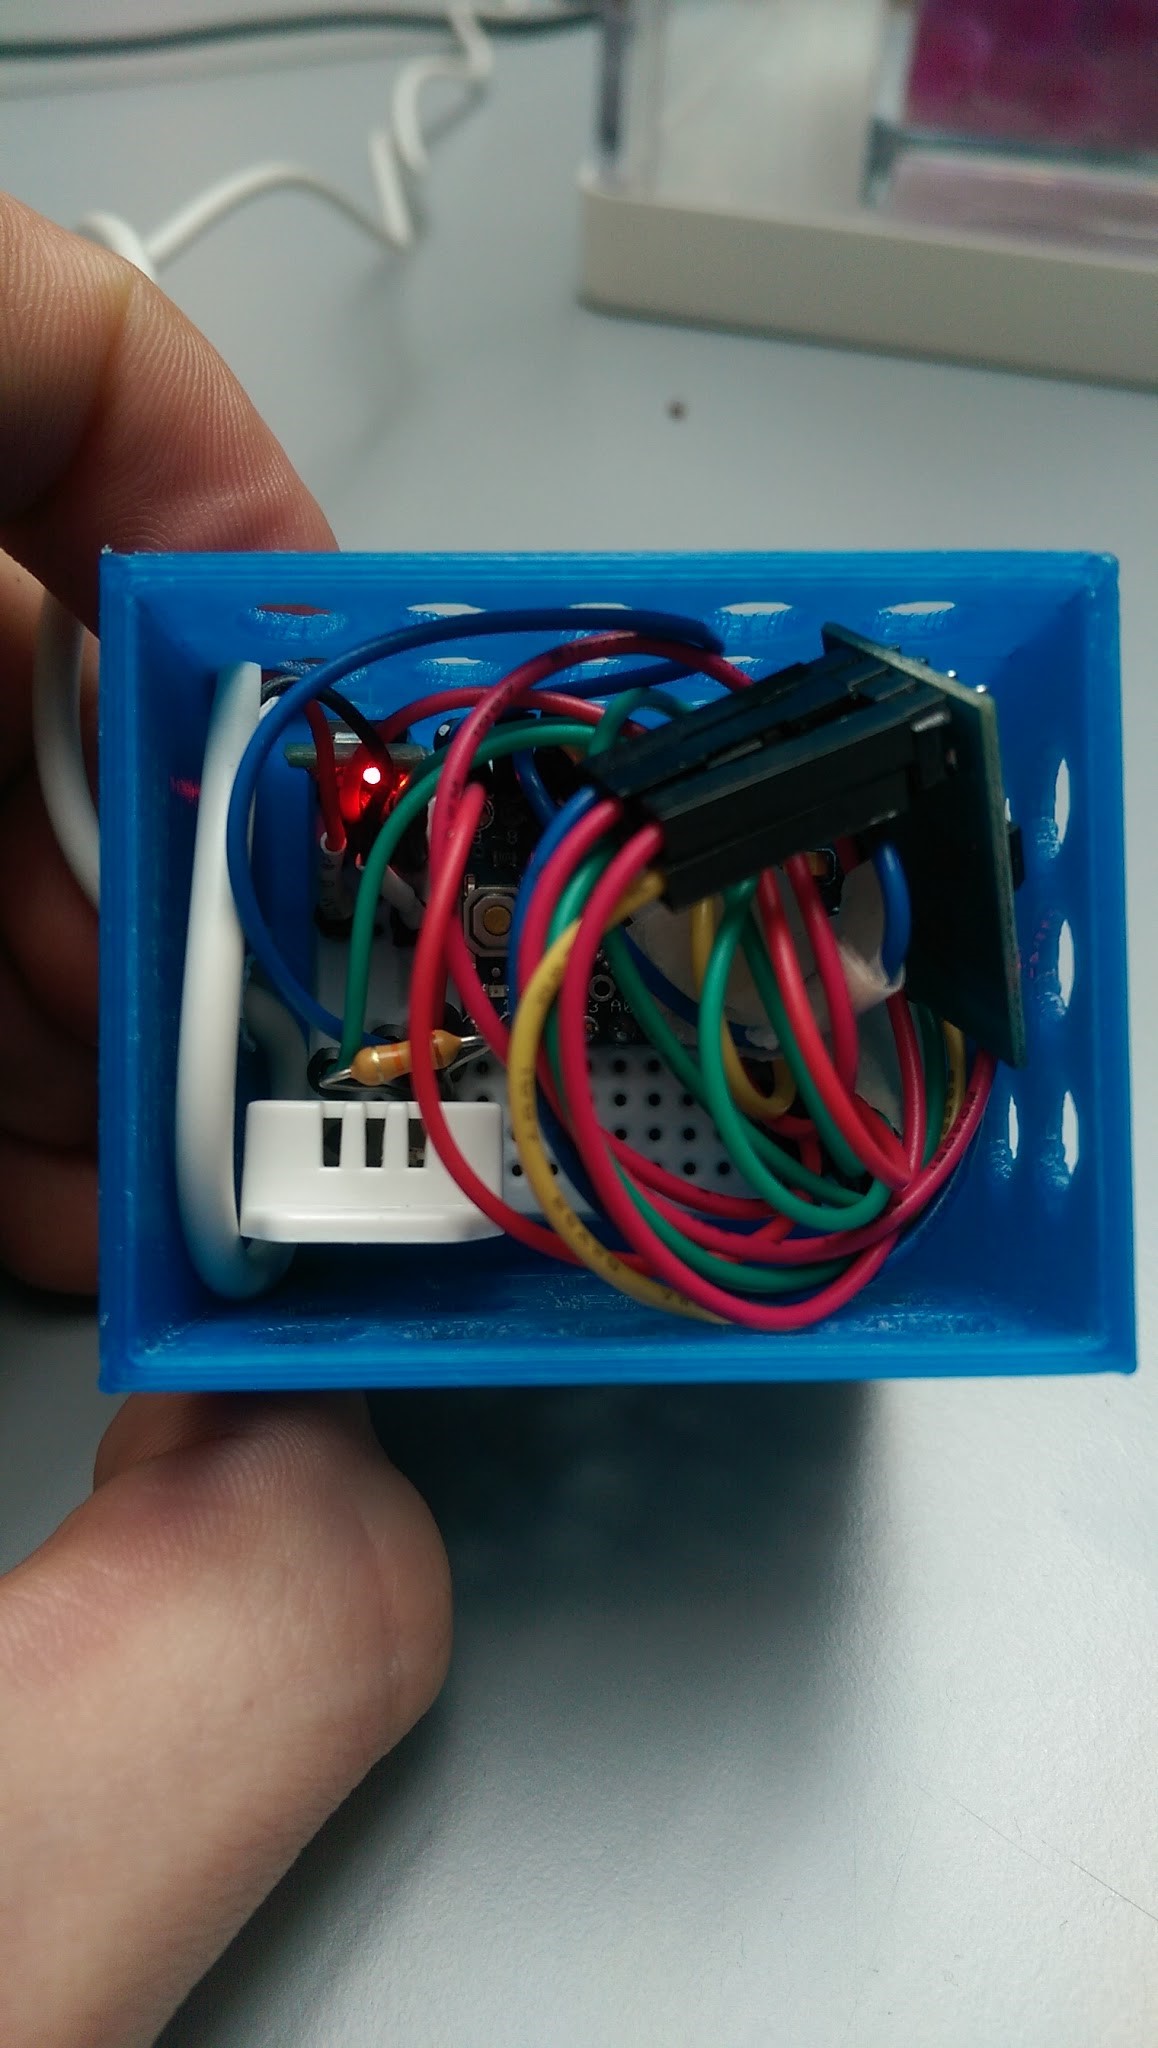
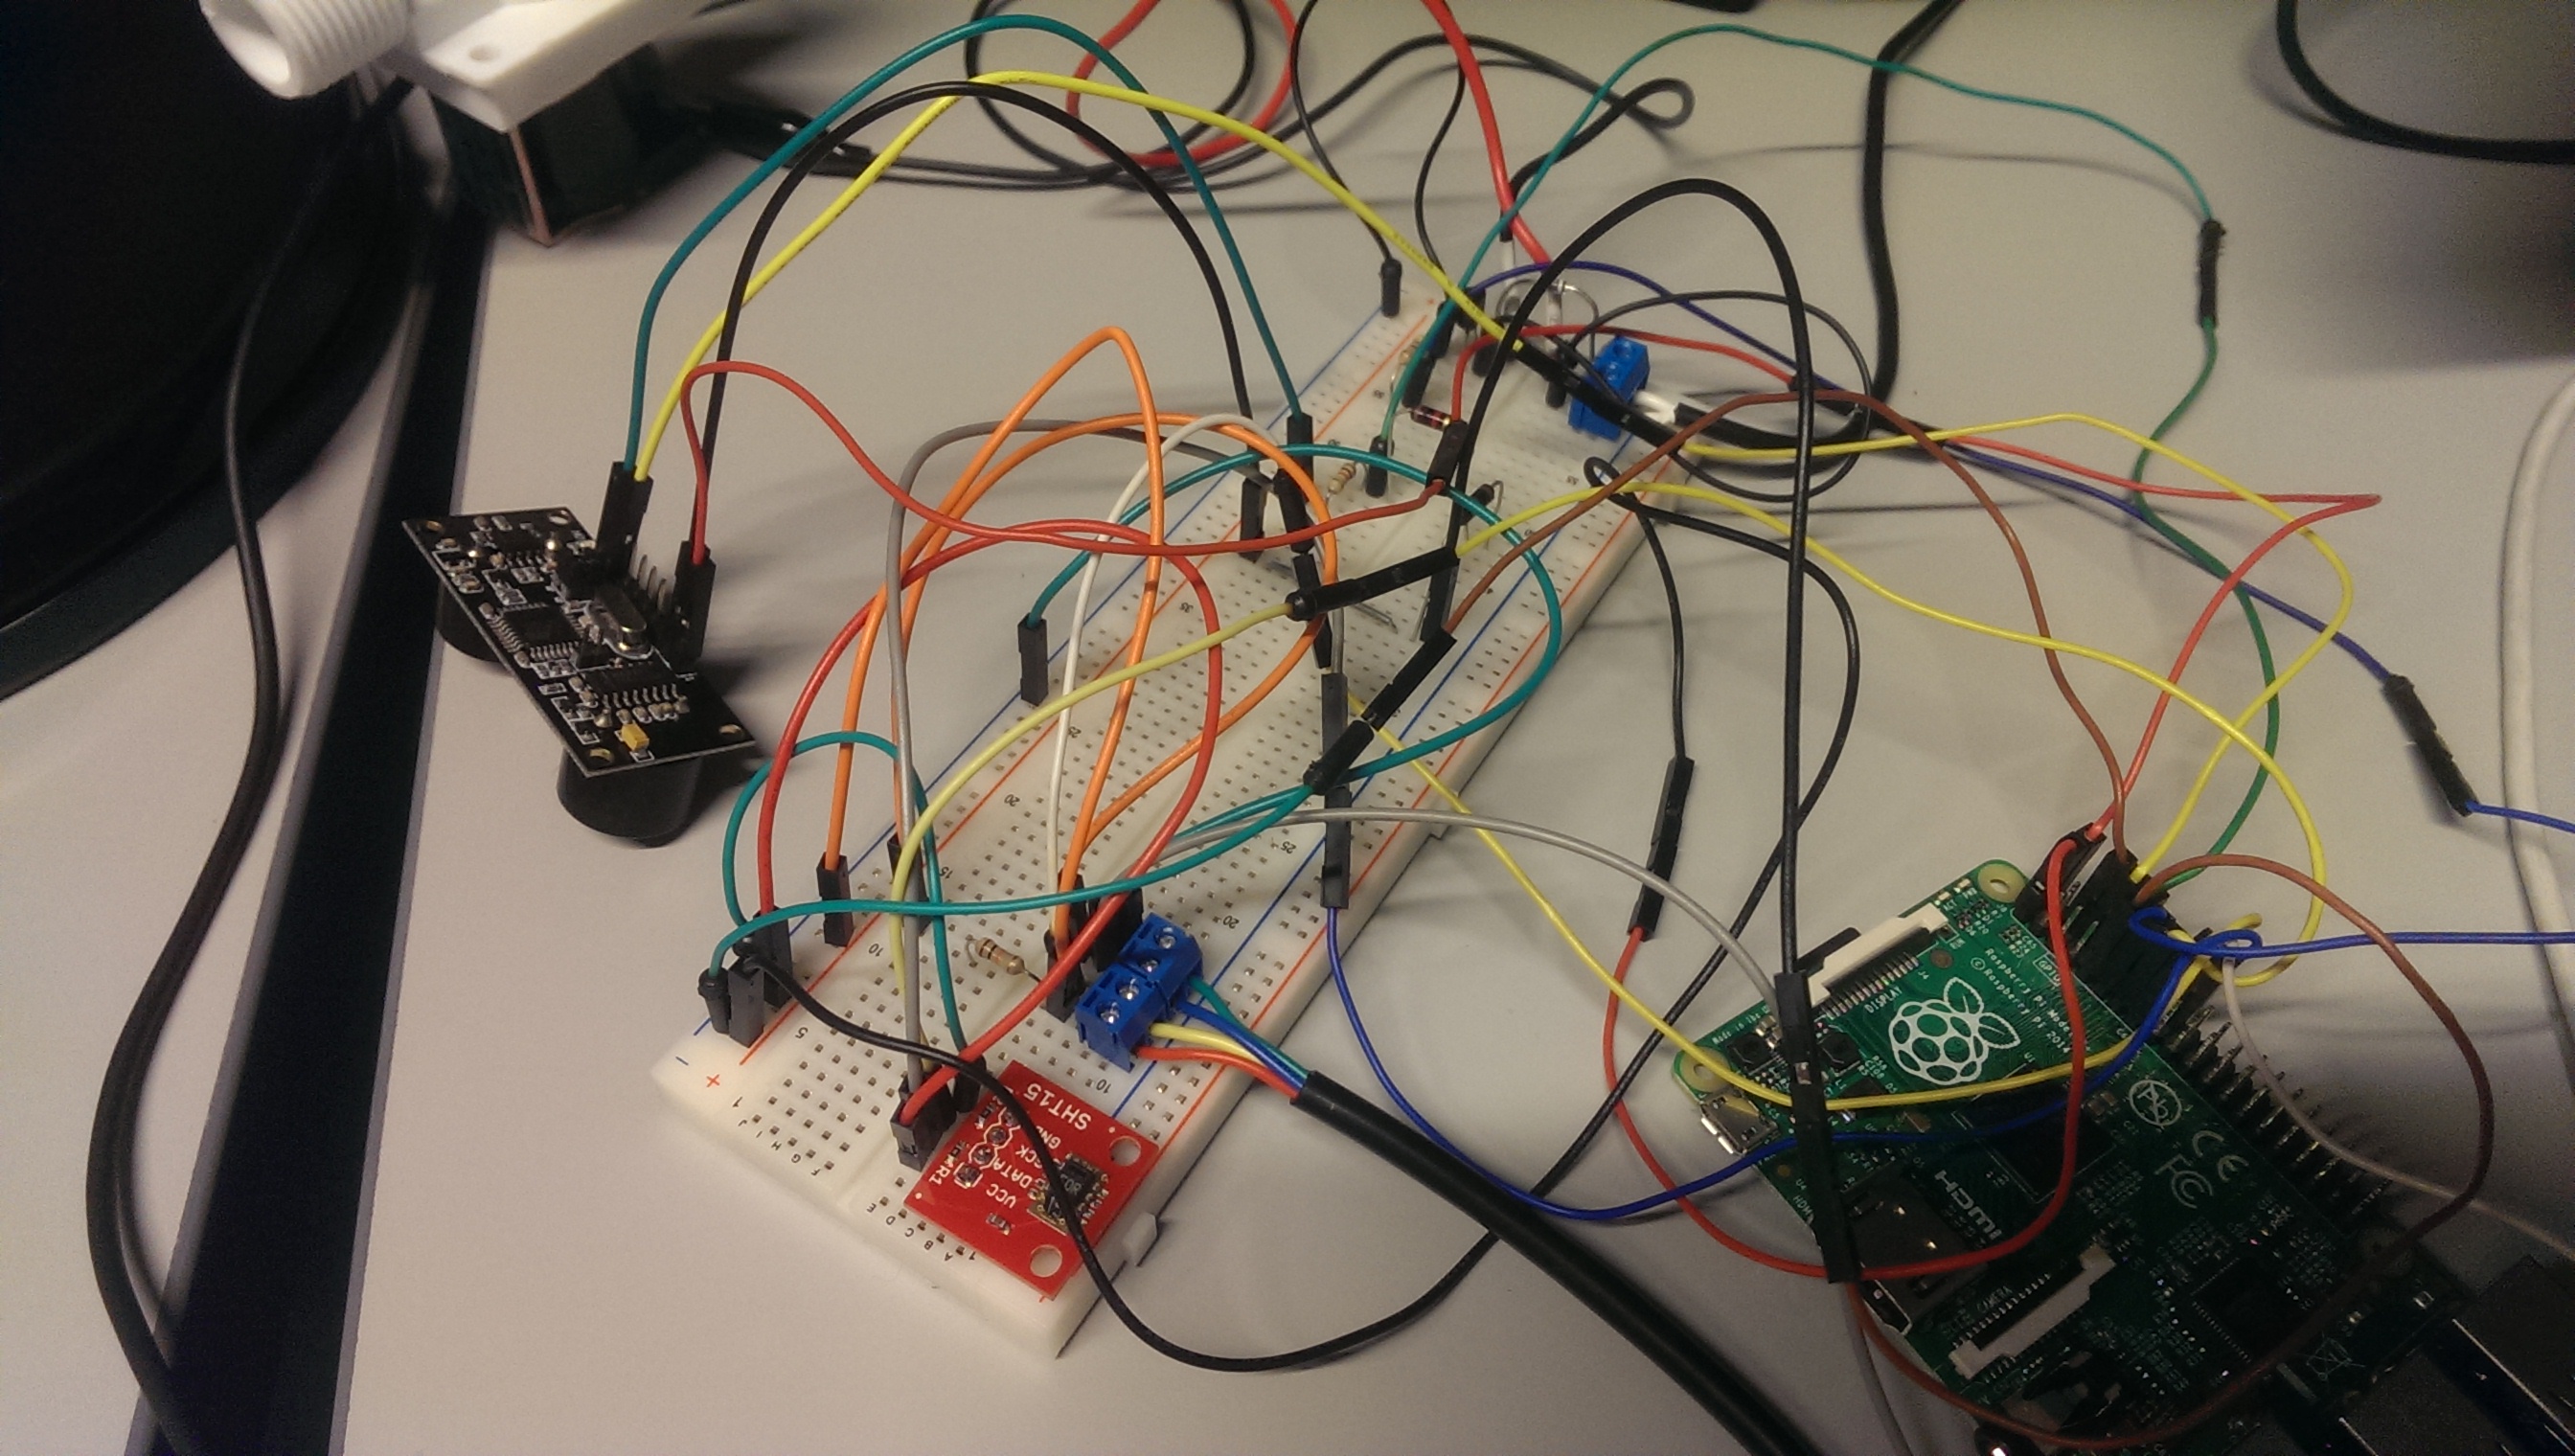
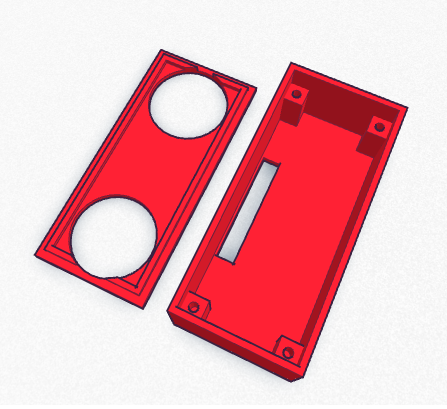
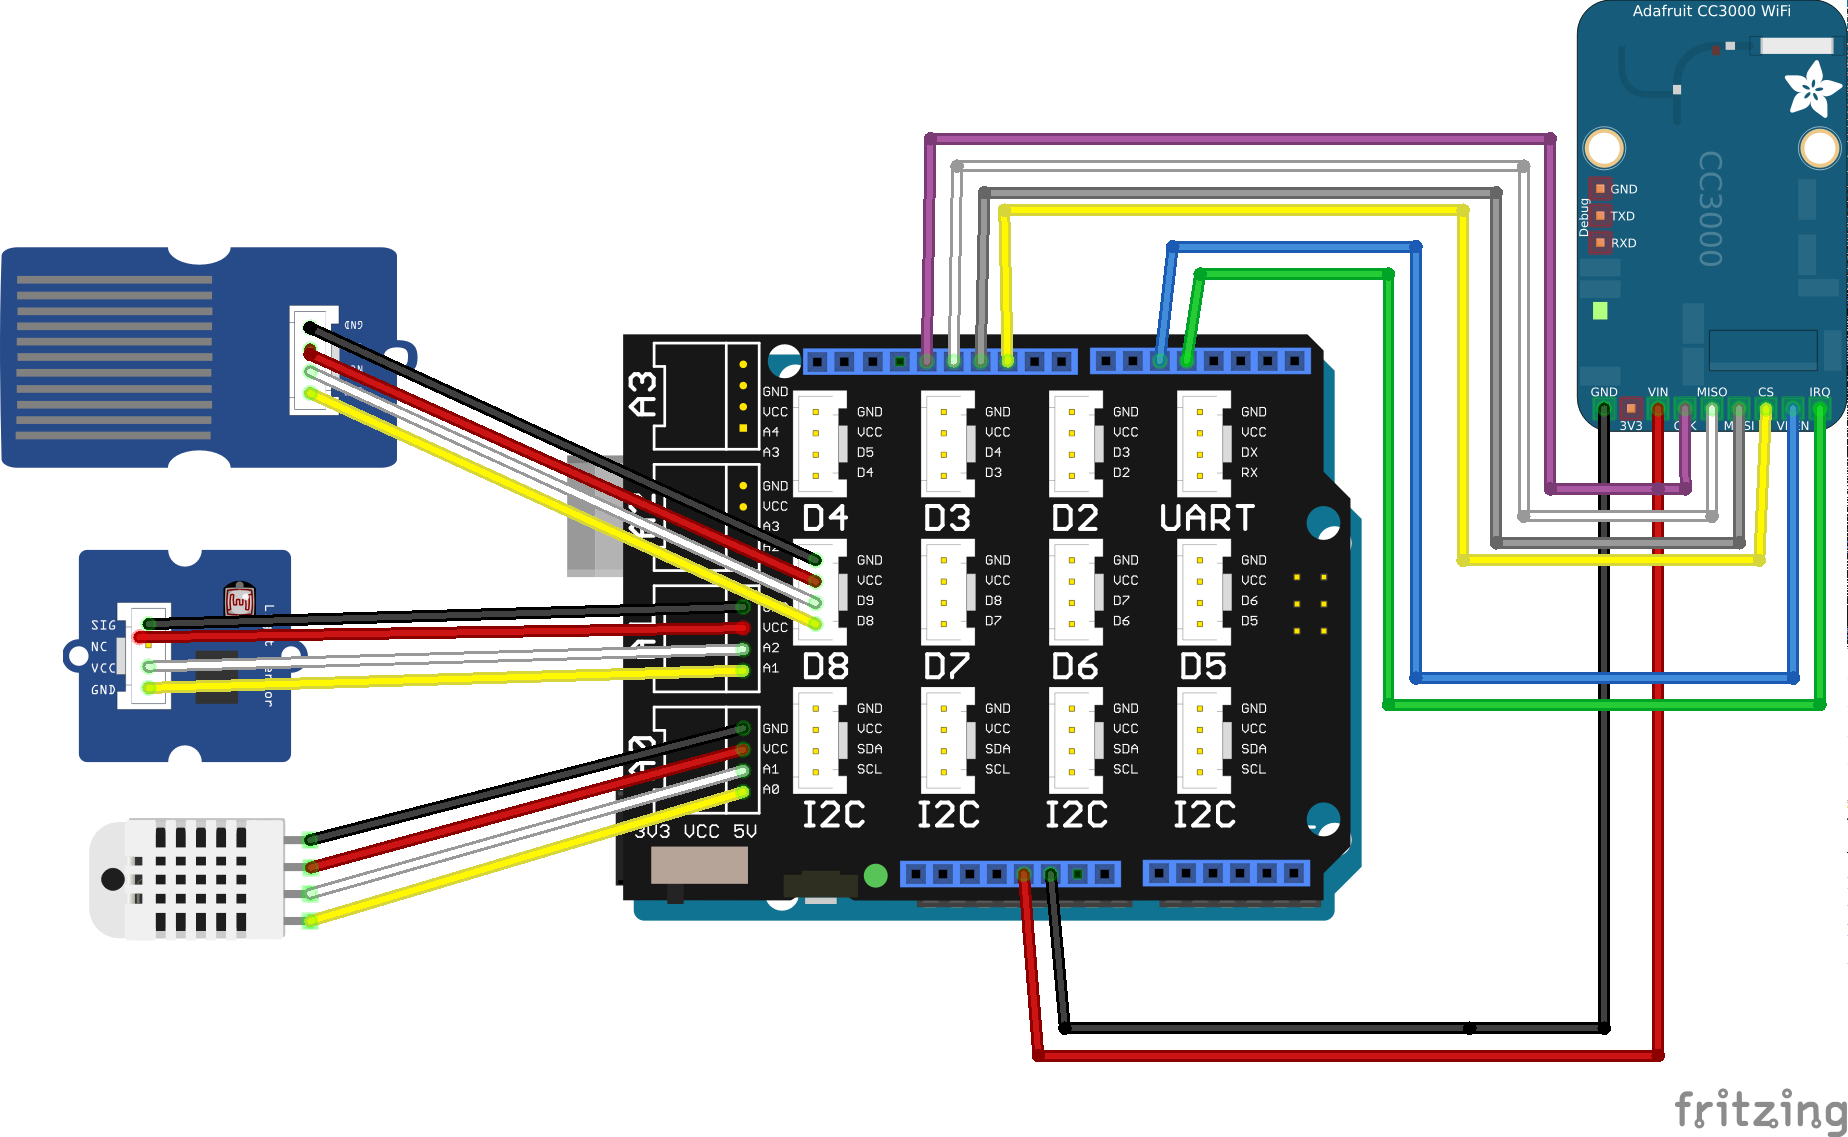
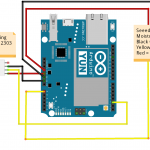
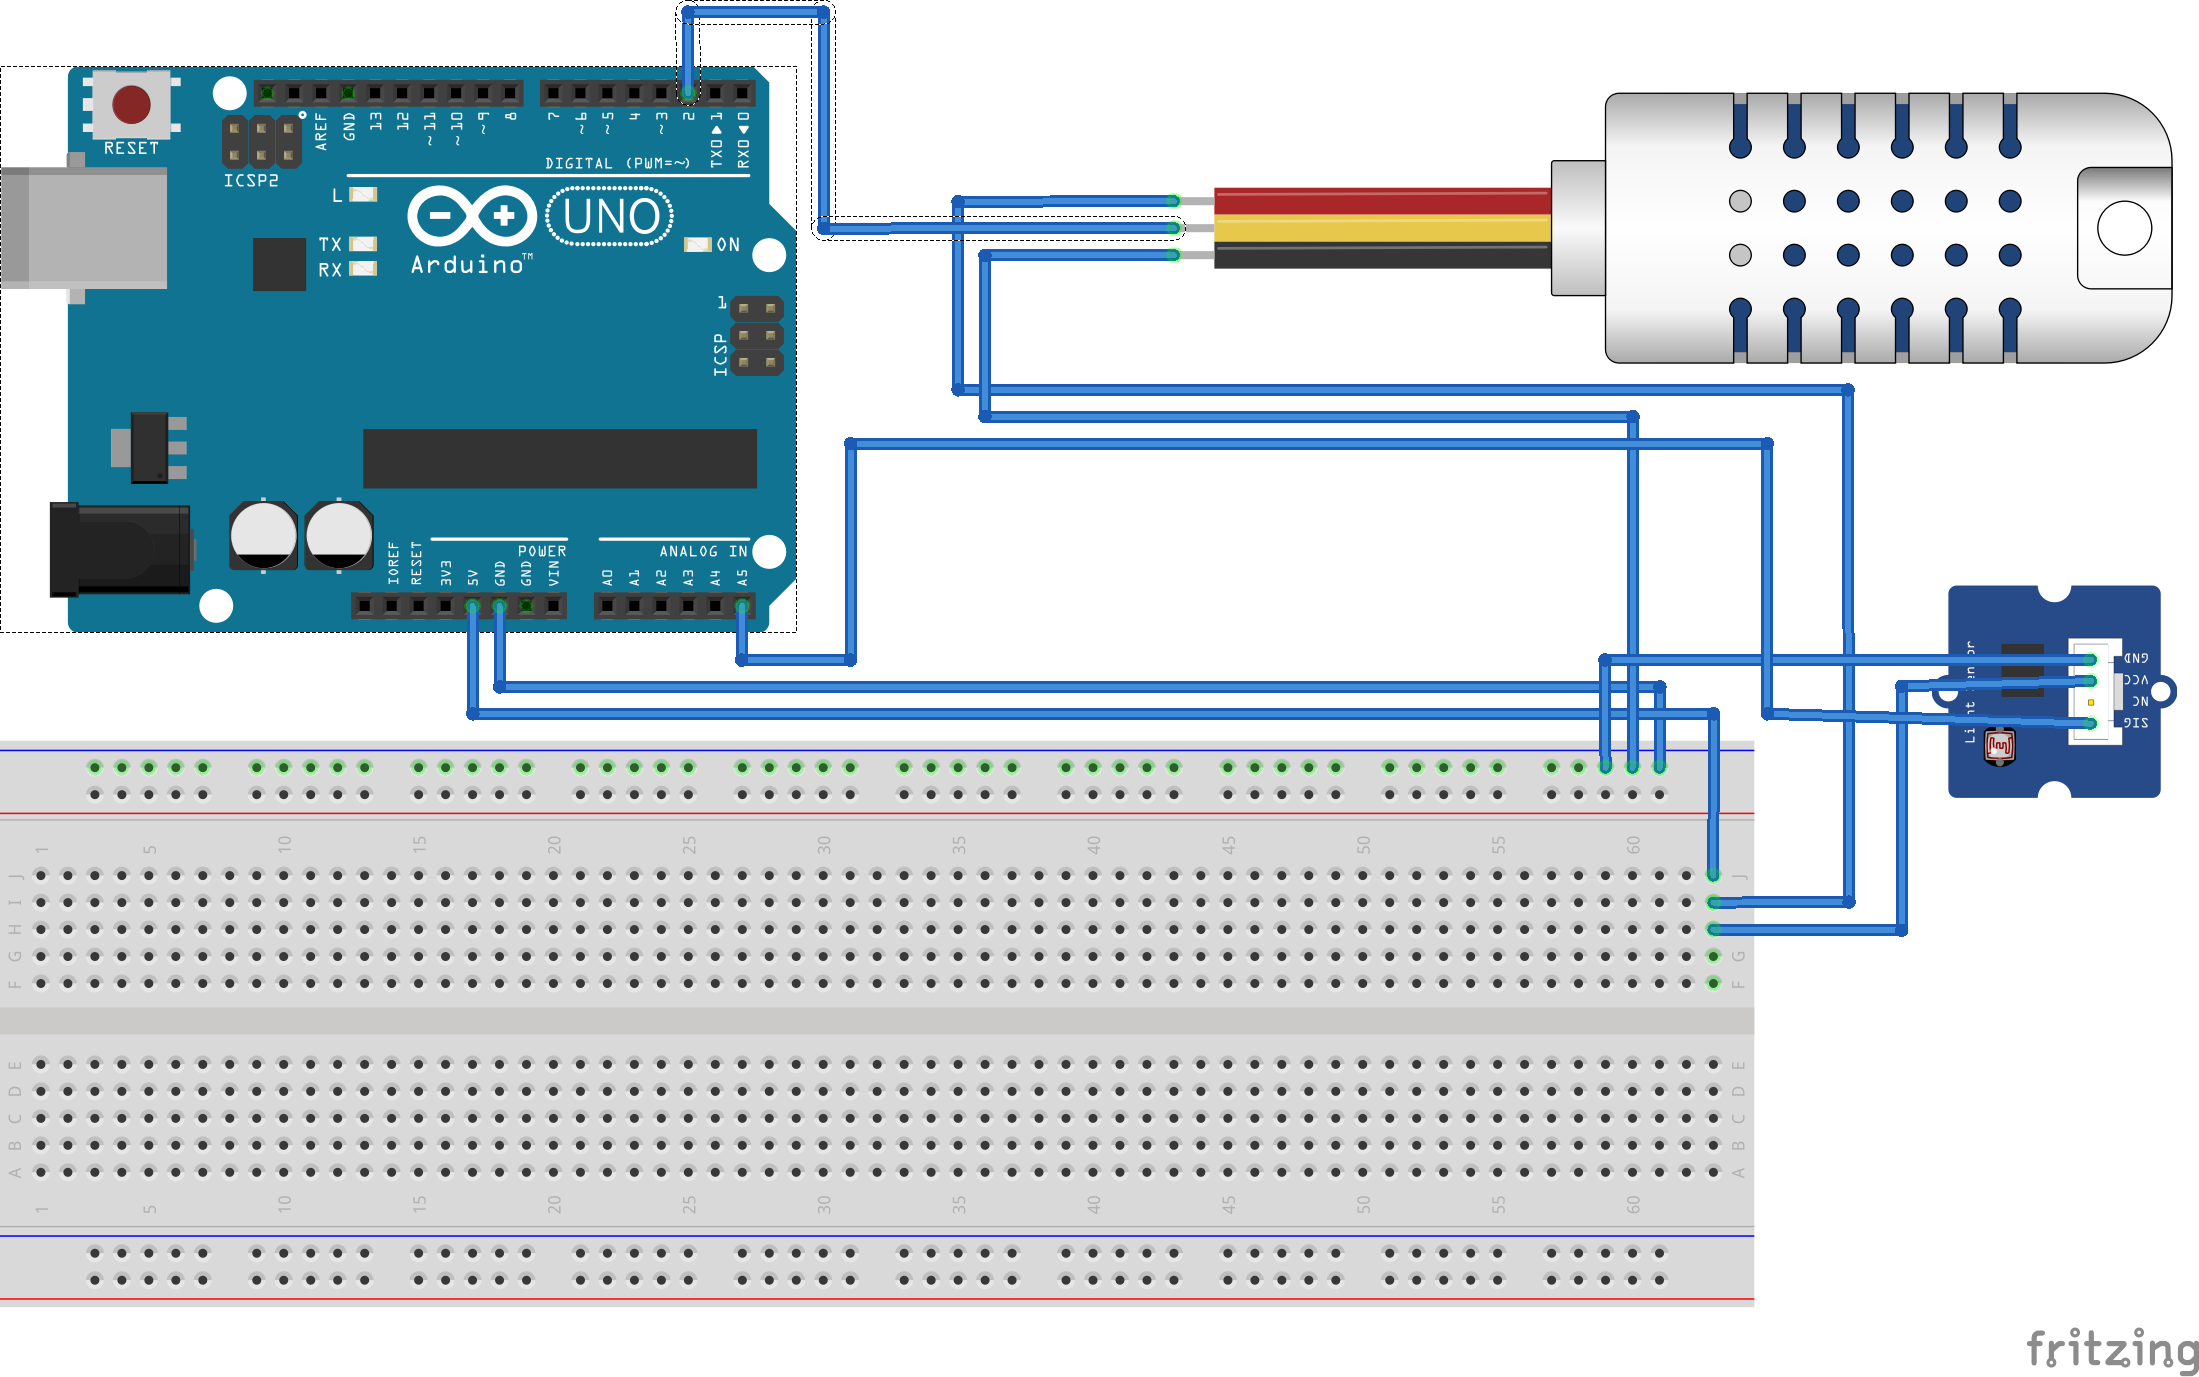
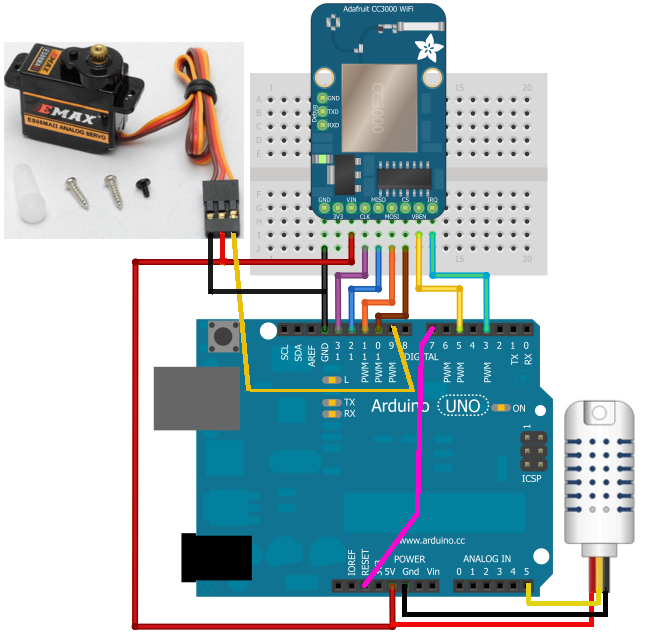
The servo and the light sensor were both connected to the Arduino board as shown in some examples. So, no fancy electronics skills required.
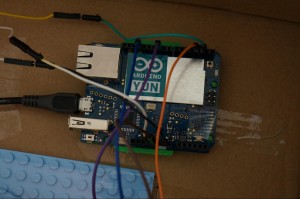
Arduino wiring
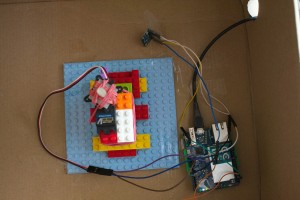
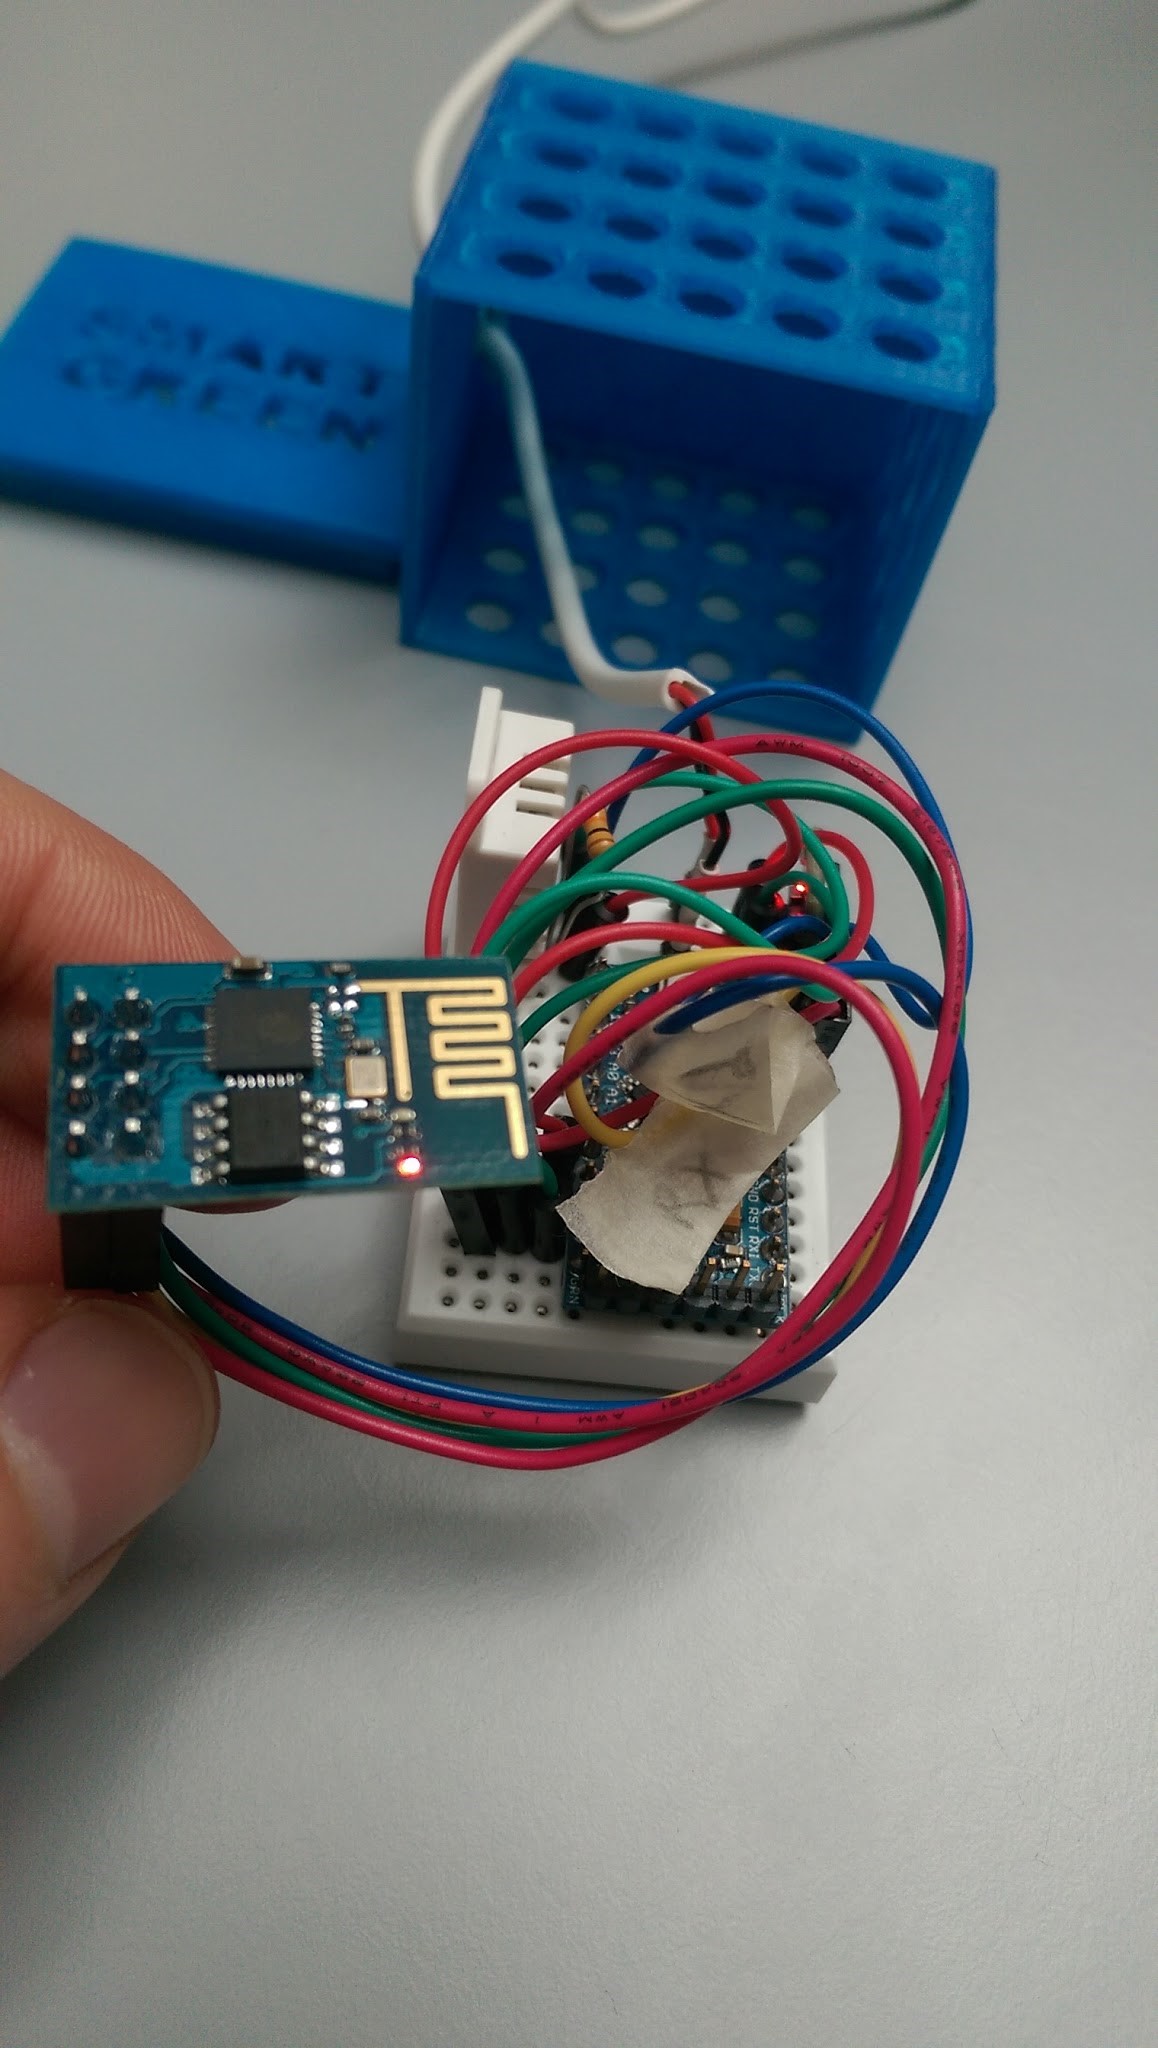
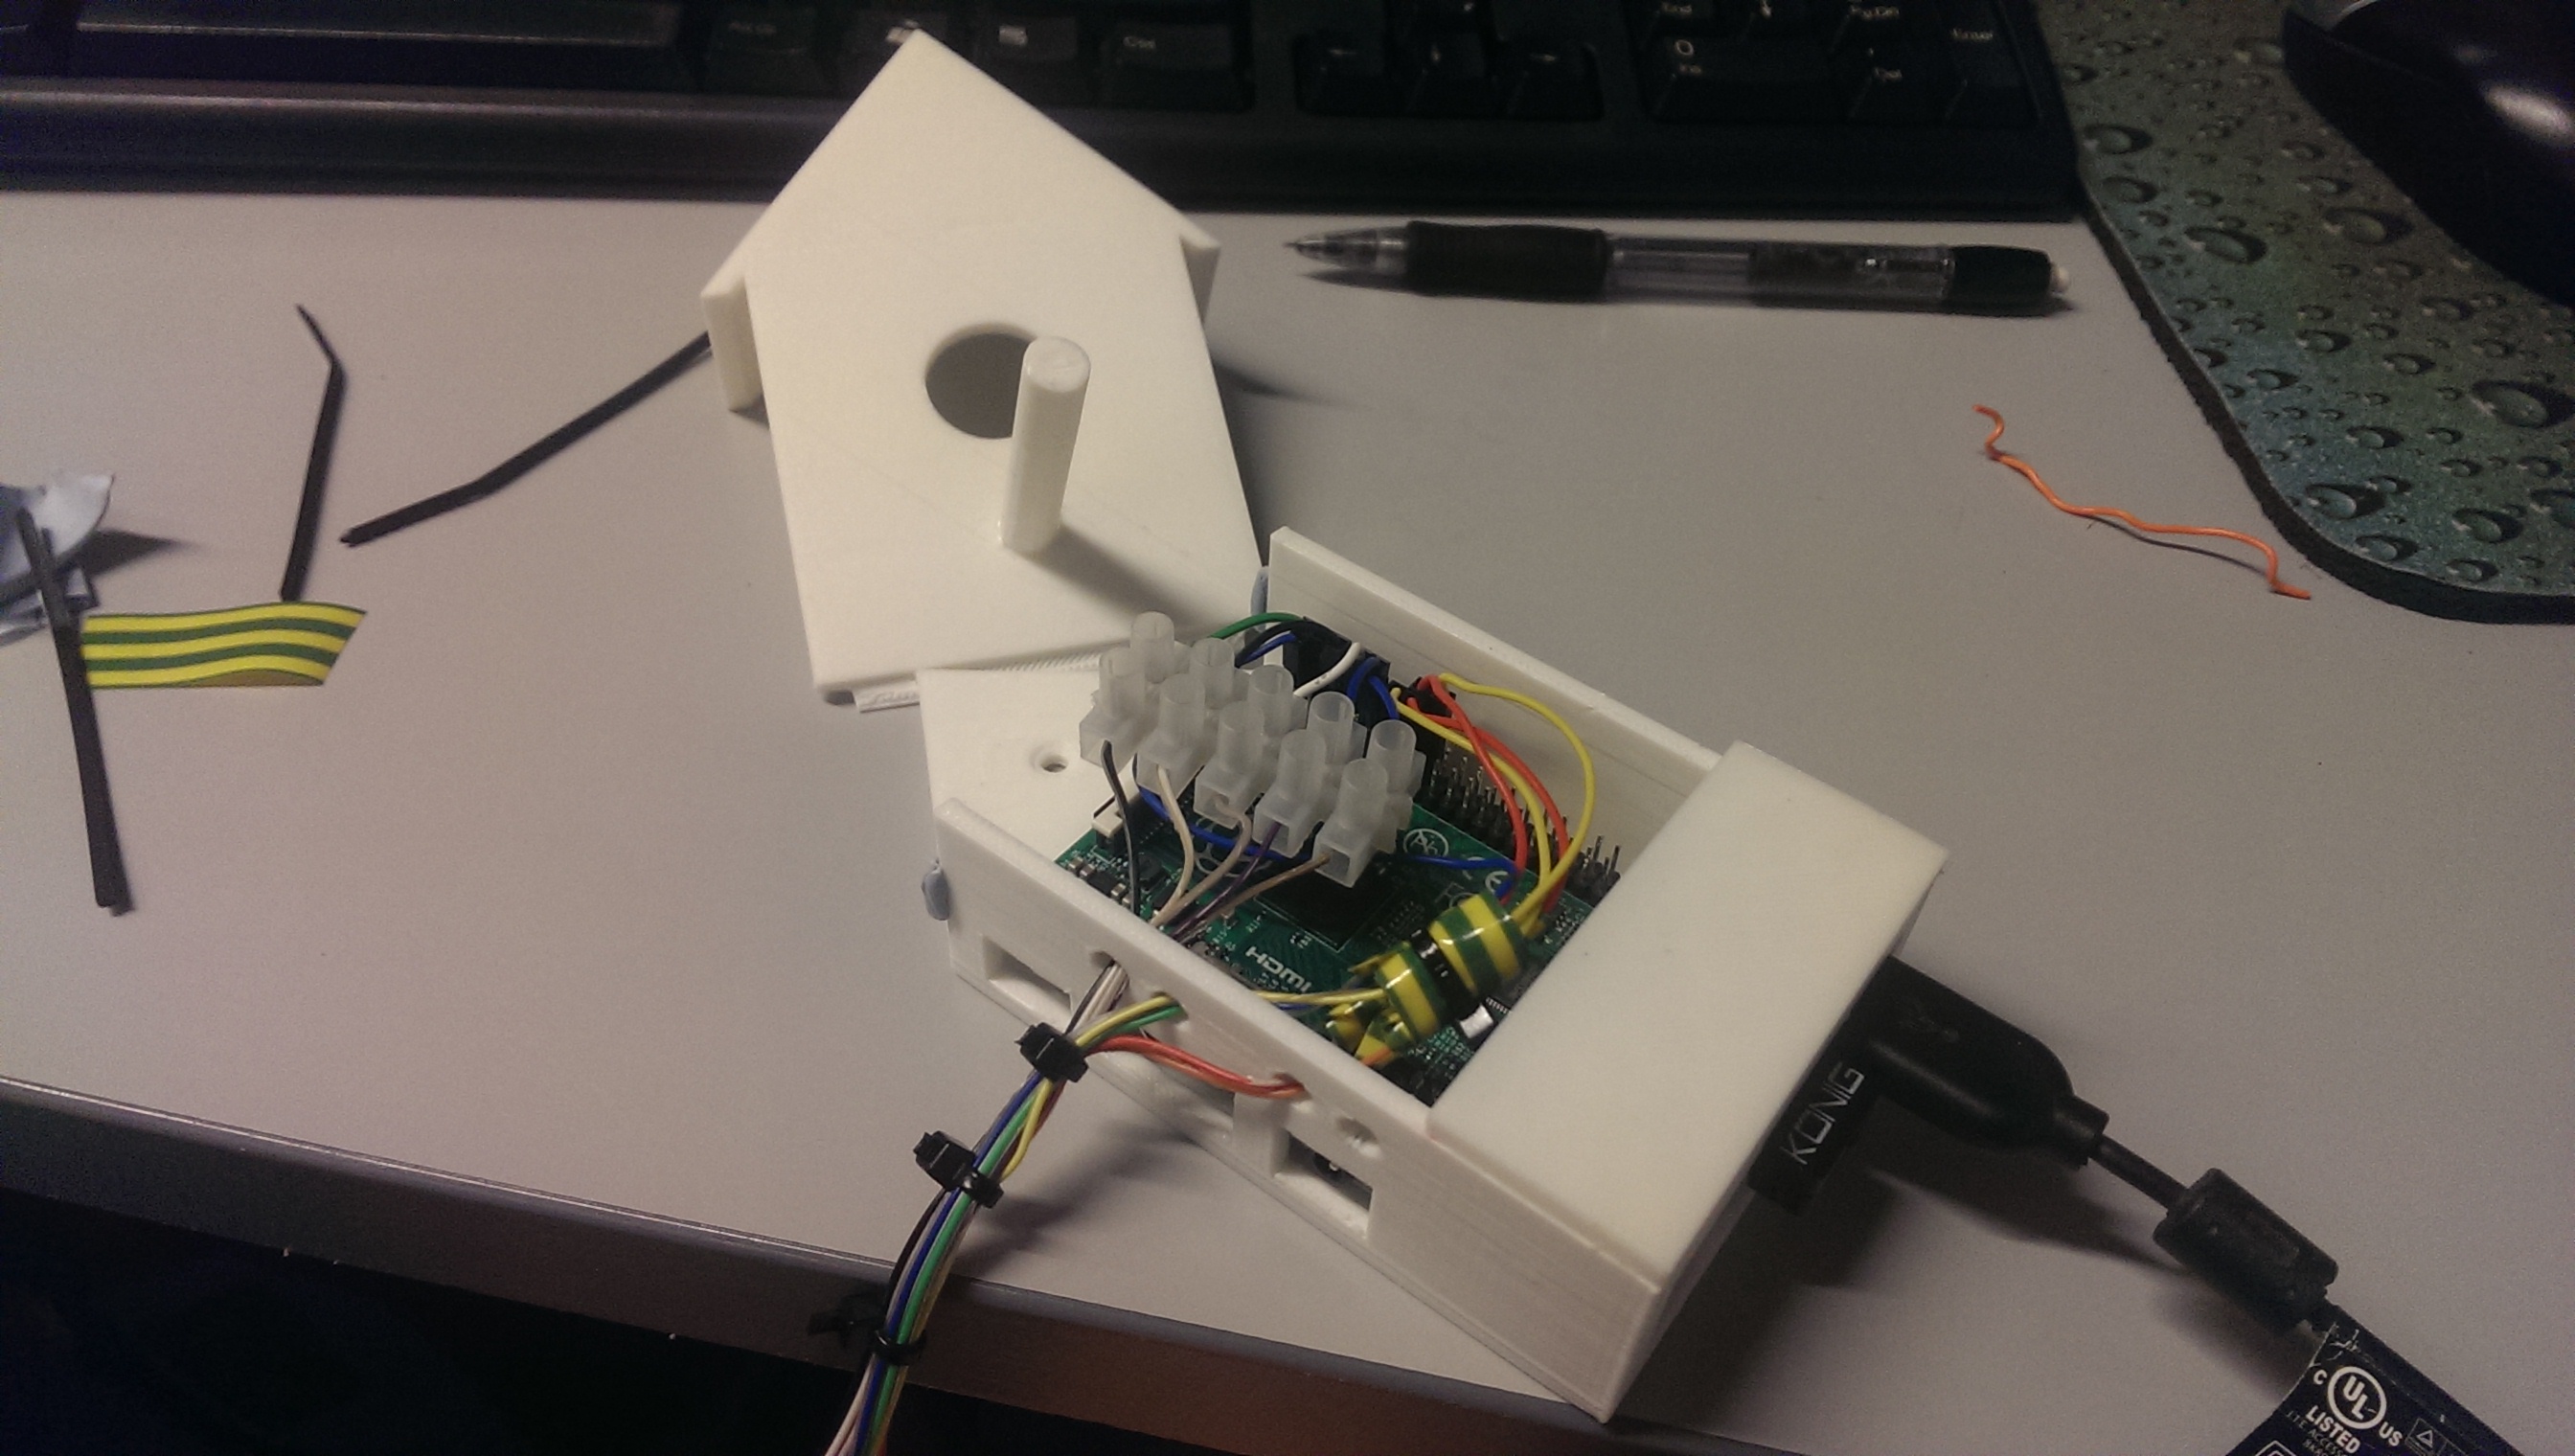
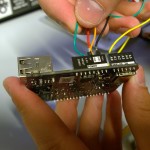
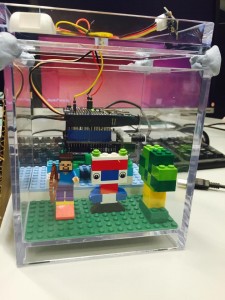
Organization inside the shoe box
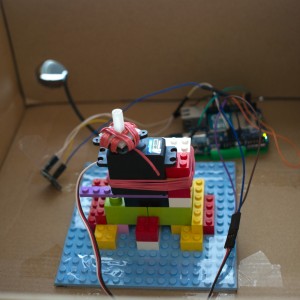
Inside the shoe box: 3D printed servo shaft
Software Implementation
We started the Arduino part of the implementation by playing around with example code for the servo and light sensor libraries. Much of the heavy lifting is hidden in the libraries, so driving the servo and reading the light sensor is really easy on the Arduino.
The control logic was created on a less-than-rigorously-scientific basis. The platter was given three possible positions at 0, 120 and 240 degrees – remember that a servo turns to absolute values. The microwave platter system seemed to amplify a turn by approximately 1.6 times, so, the corresponding servo values were 0, 75 and 150 degrees. A day (24 hours) seemed like a sensible period between rotations. Rotating the plant too often would probably disturb the plant as well anyone in the same room as the plant.
The luminosity values are averaged for a short period (20 secs) and then the averages are summed up to get an accumulated value for a day. The accumulated luminosity values as well as the servo positions are saved in a history queue (ten days) and a decision to rotate or not the rotate the platter is made based on the history data: choose the position that has received the least light according to the history – a typical scheduling algorithm in essence.
When the Arduino has connectivity, luminosity and servo position data is uploaded to a database every minute. As a smaller task, the Arduino code also updates its idea of date from the WiFi component once a day. Otherwise there would be clock shift between the microcontroller and the WiFi board (and the real world), which would ultimately prevent database uploads.
We chose to use Amazon DynamoDB as the database backend for this project. There is an example project with source code (googlable) that uses DynamoDB, but after creating the accounts and setting up the DynamoDB database, we found out that the code to do the required hash calculations for Amazon authentication takes so much space on the Arduino that there is very little left for anything else. The Arduino also seems to start getting unstable when the dynamic memory runs low – so heed the warning given by the Arduino IDE.
We stuck with our choice.
Fortunately, Arduino Yún’s WiFi component has an OpenWrt Linux environment with Python and all that stuff. So, the Amazon hashing and upload was implemented as a Python script and called from the microcontroller side using the Arduino “bridge” interface, leaving proper space for actual program logic in the microcontroller.
Lesson learned: mixing microcontrollers with authenticated REST APIs is plain stupid.
One additional problem faced with the servo was that it was just too fast. An off-center plant might be thrown off the platter. As a solution, the servo control was slowed down by turning the servo one degree at a time towards the chosen next position and inserting a delay of 100 ms in between.
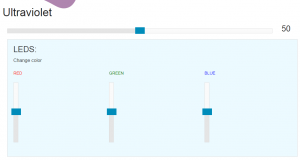
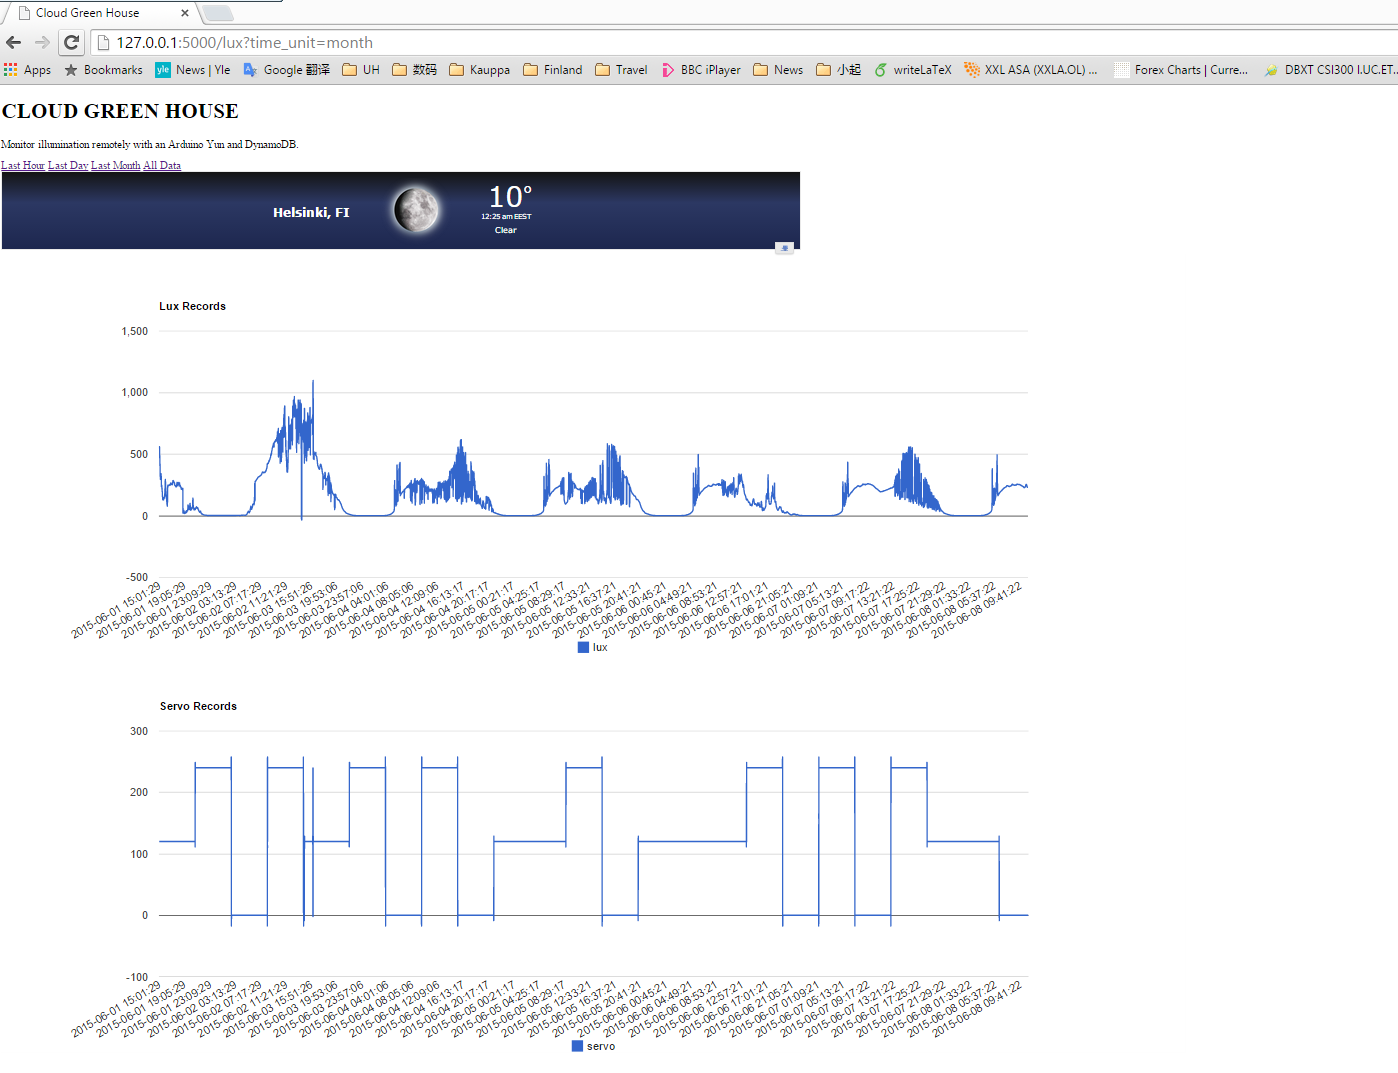
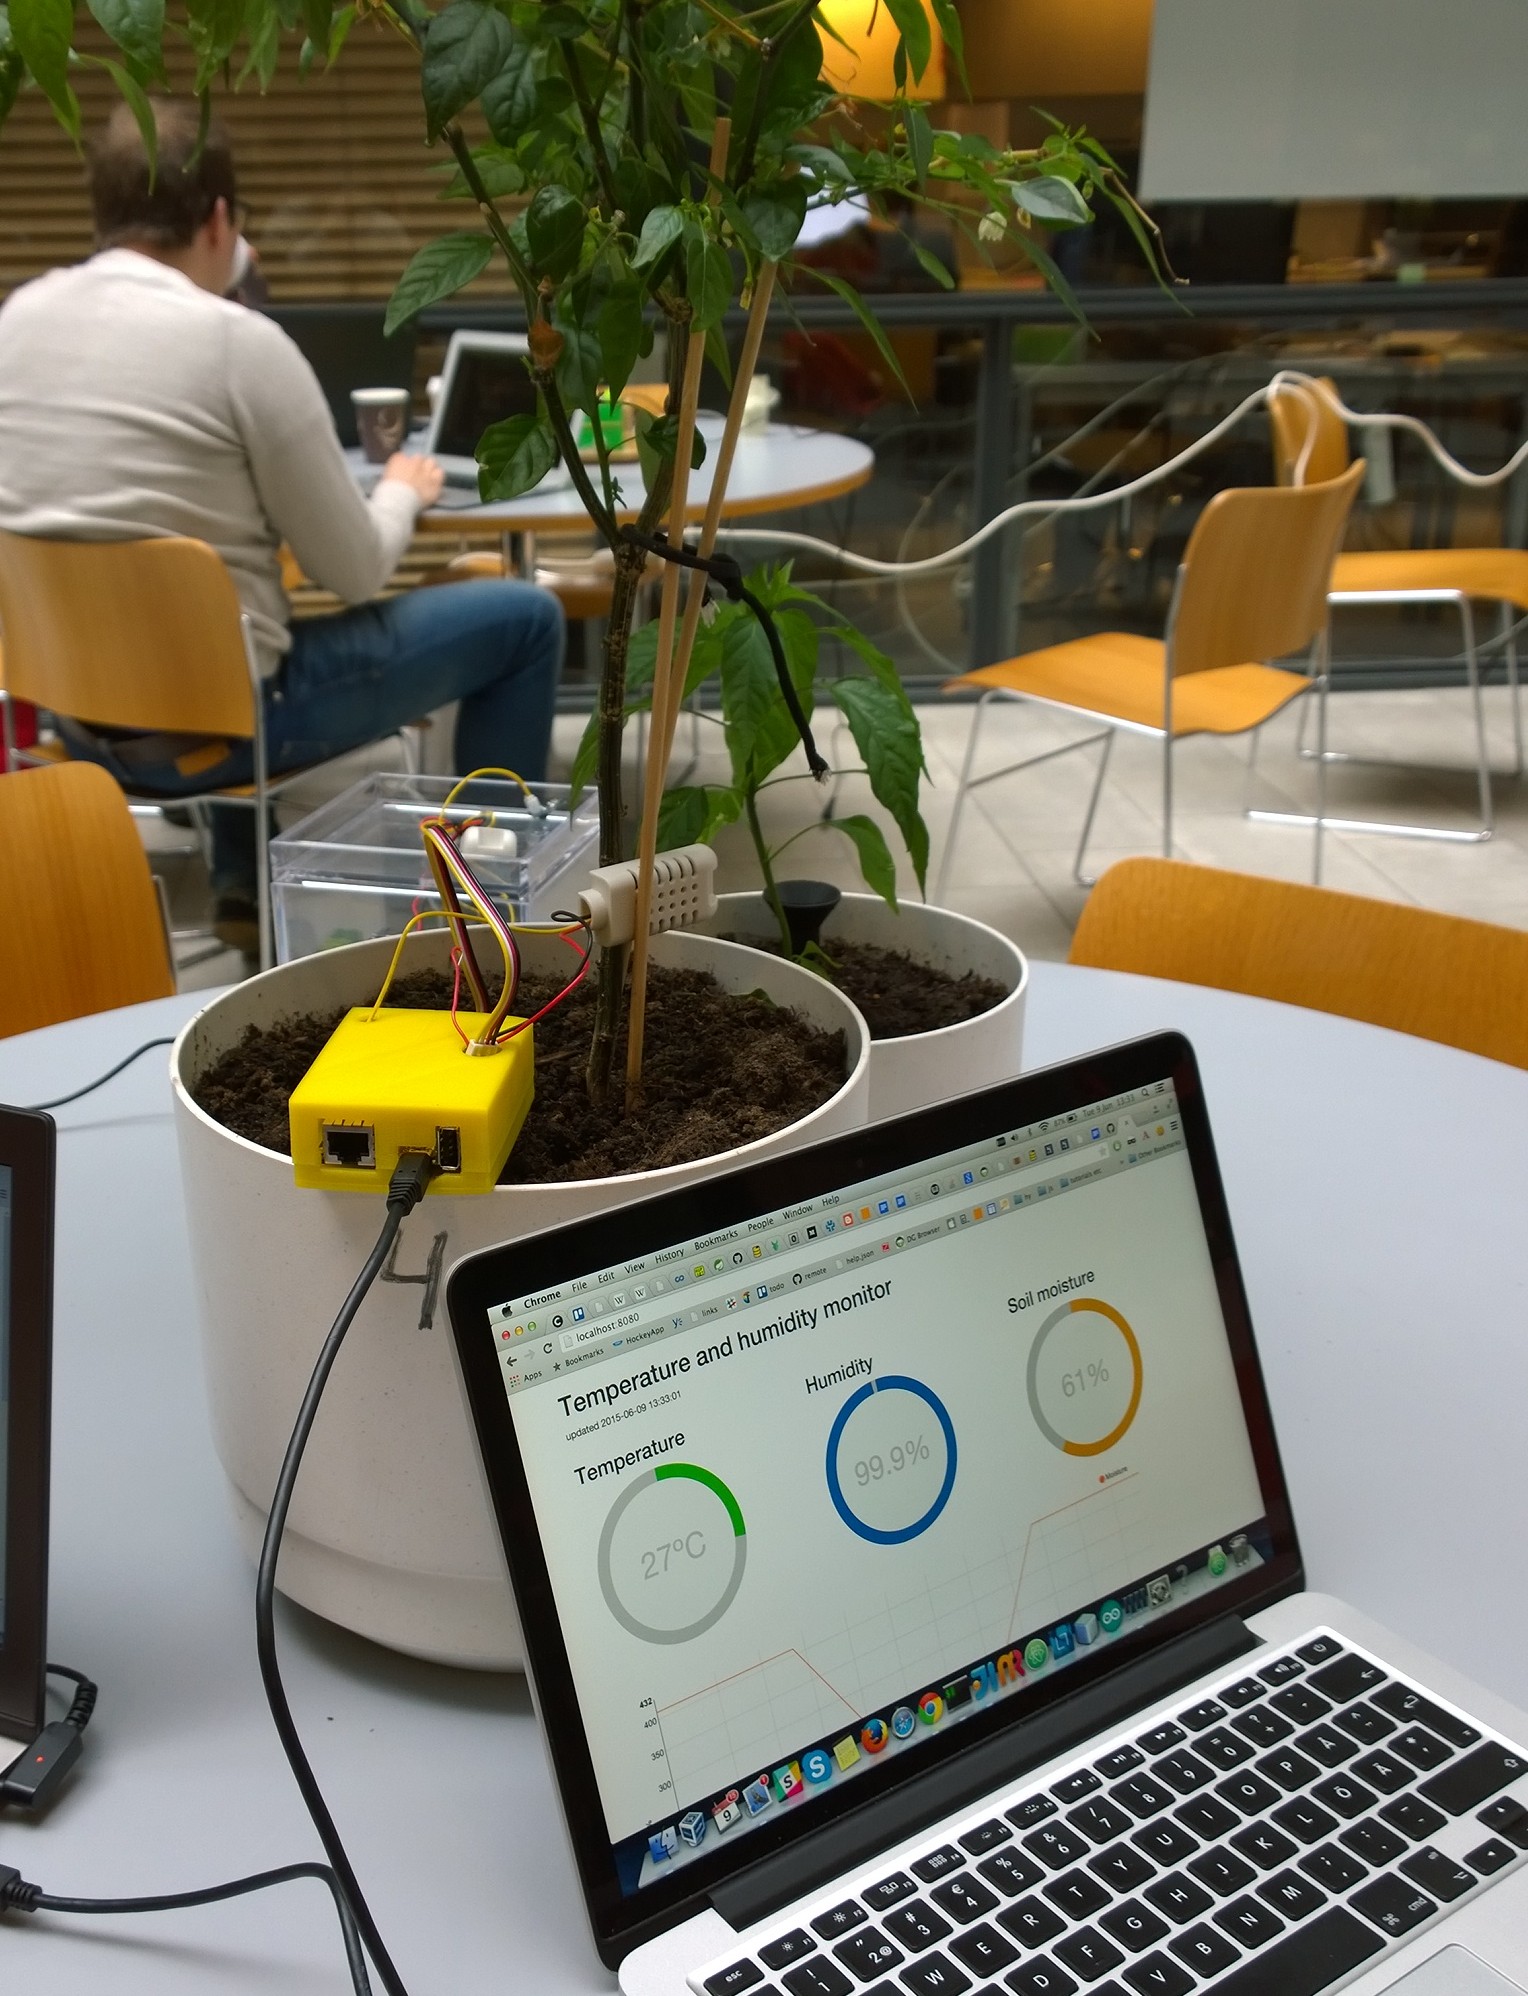
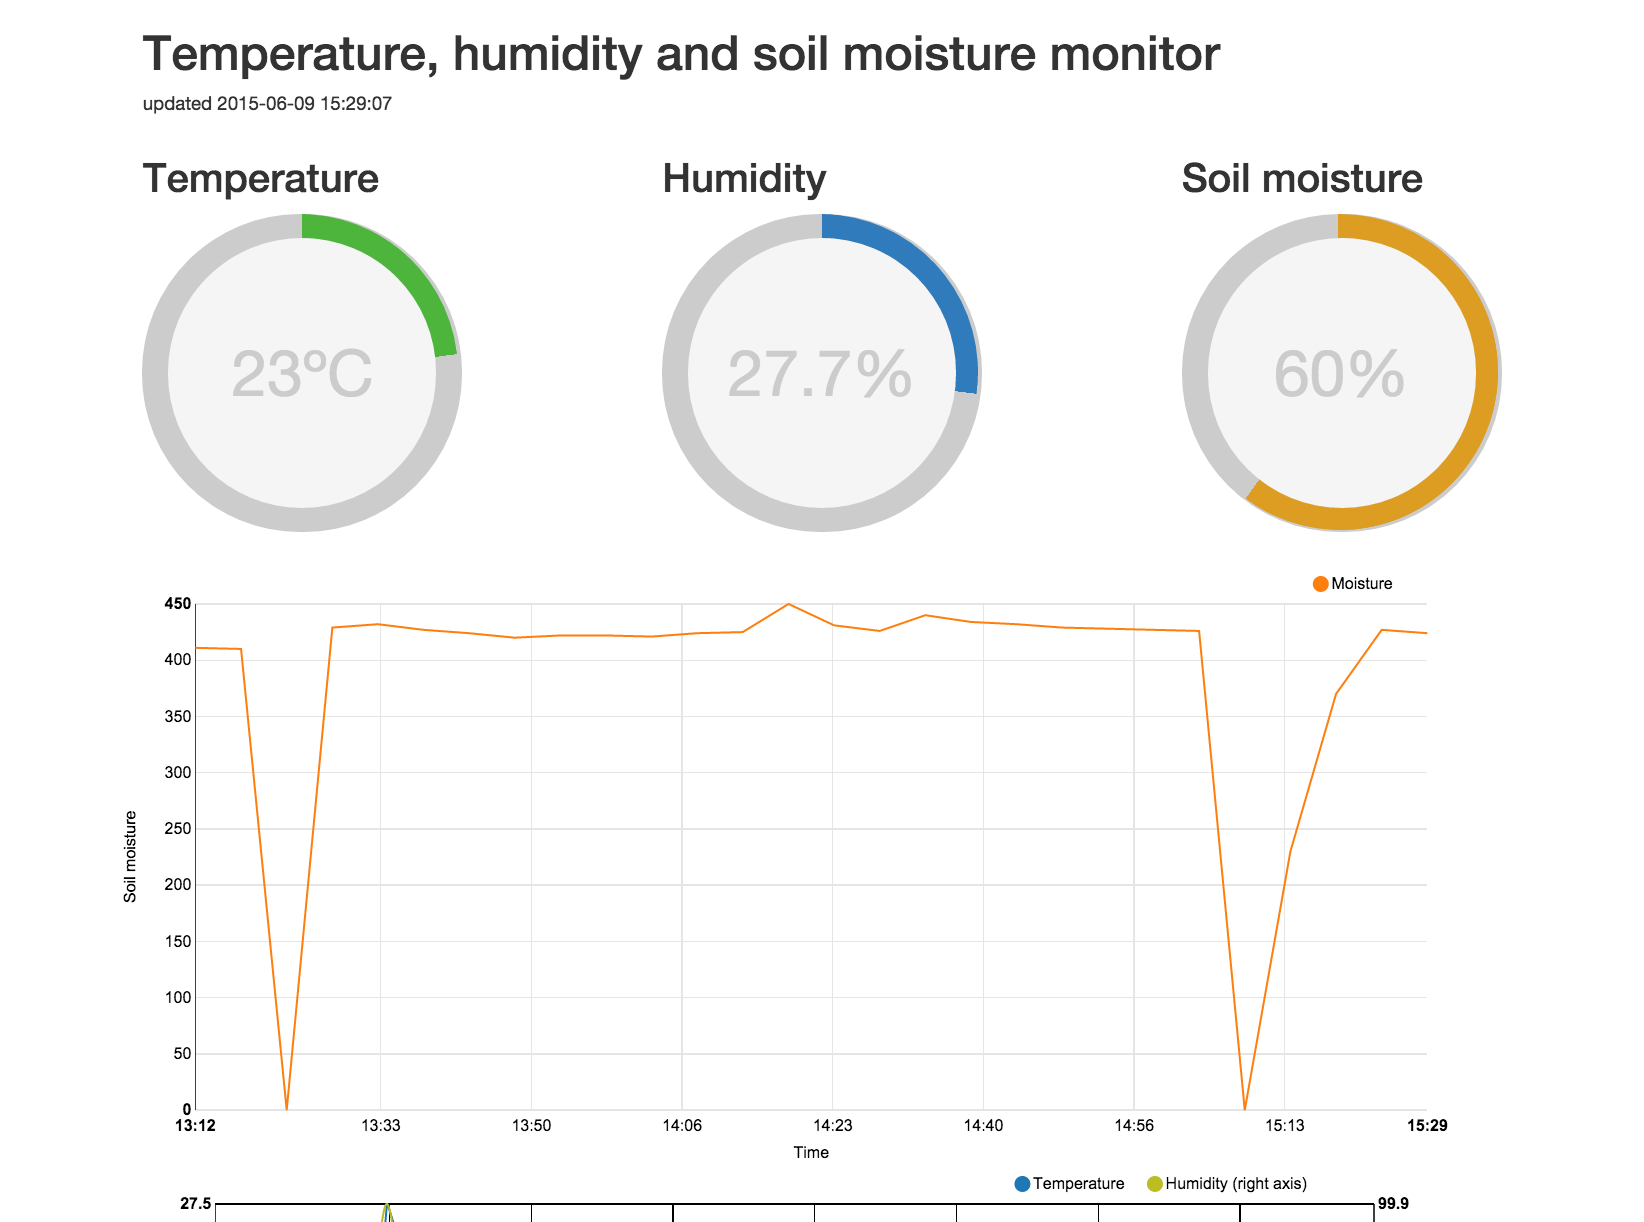
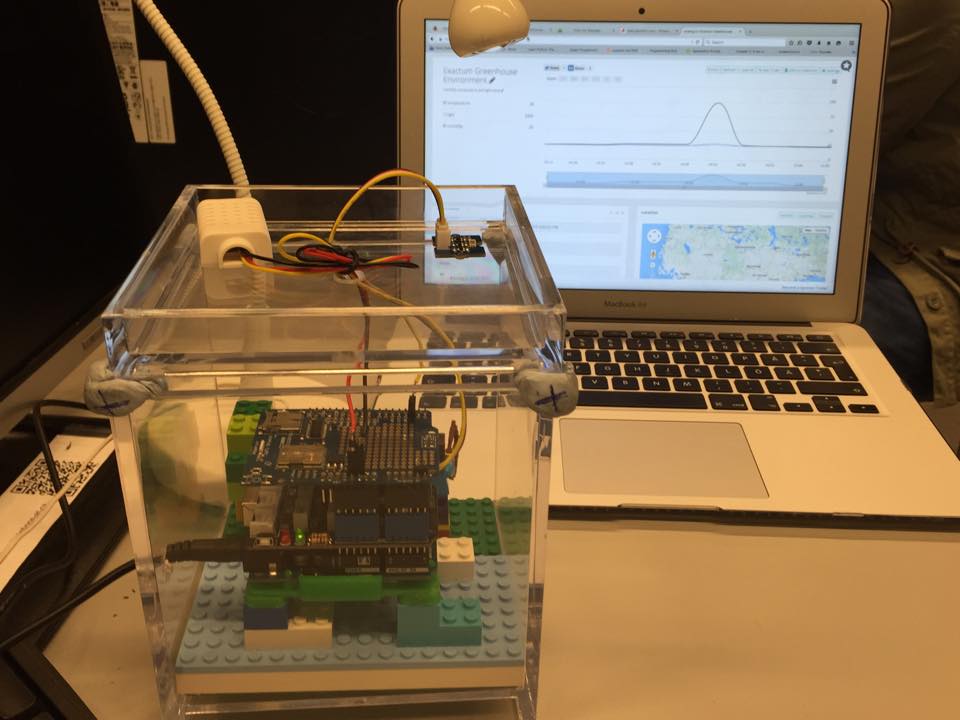
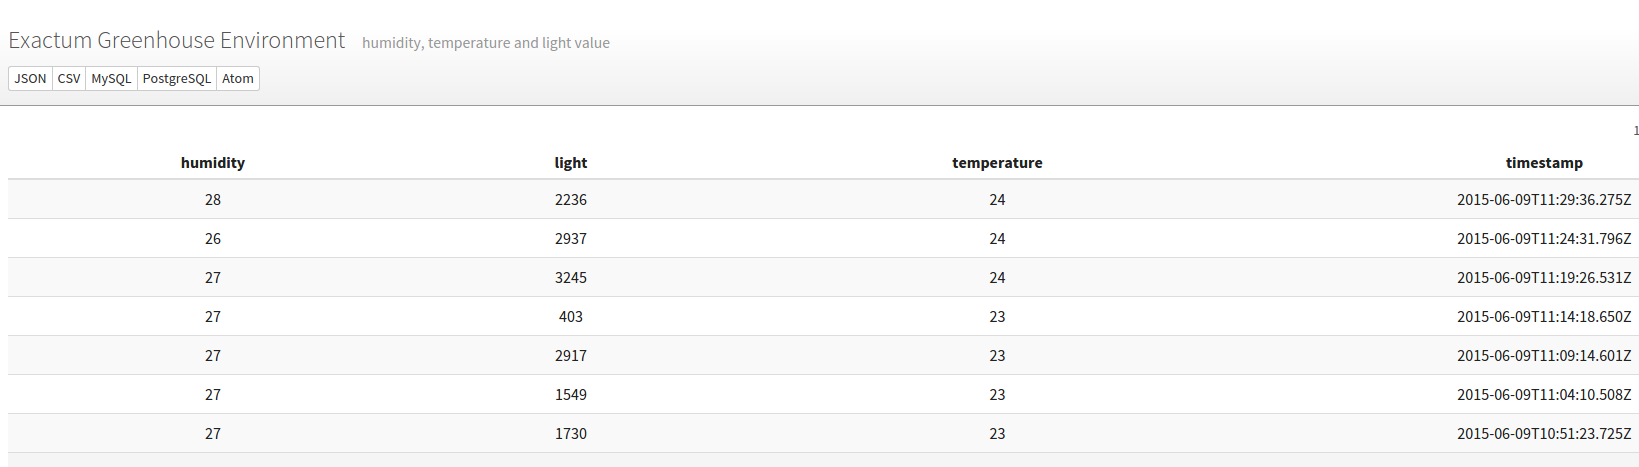
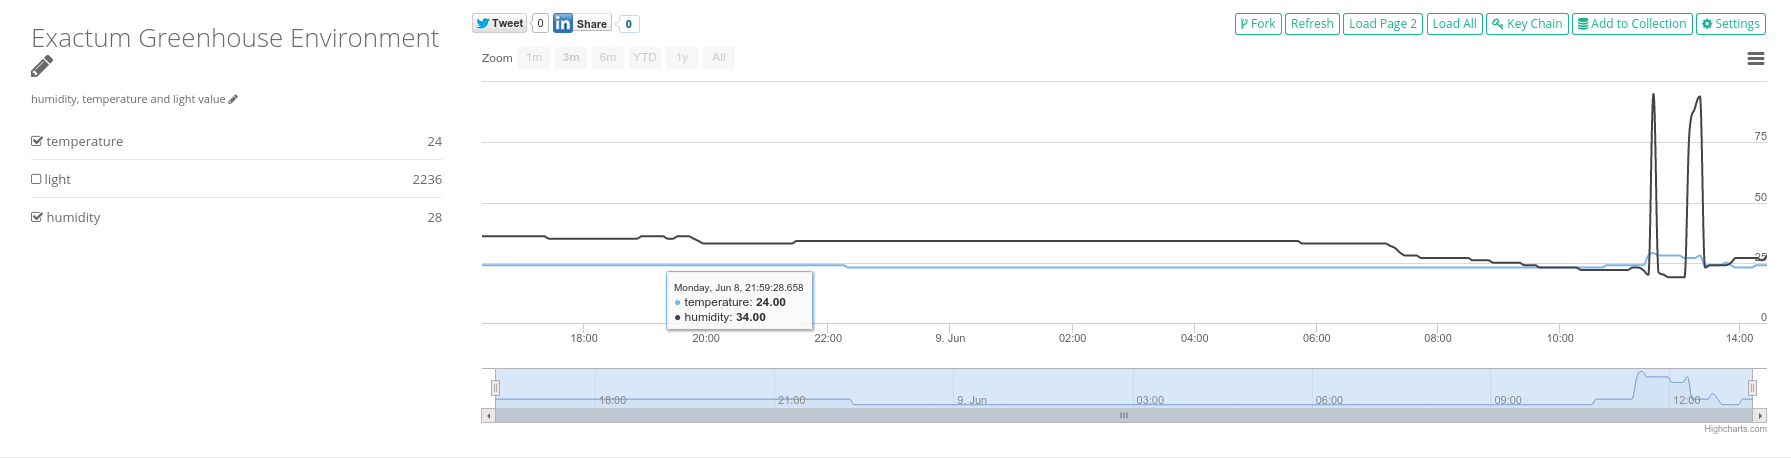
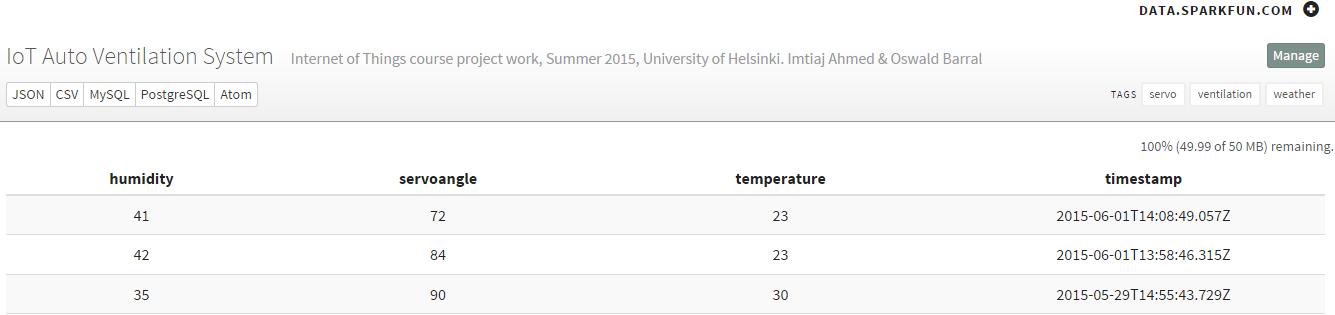
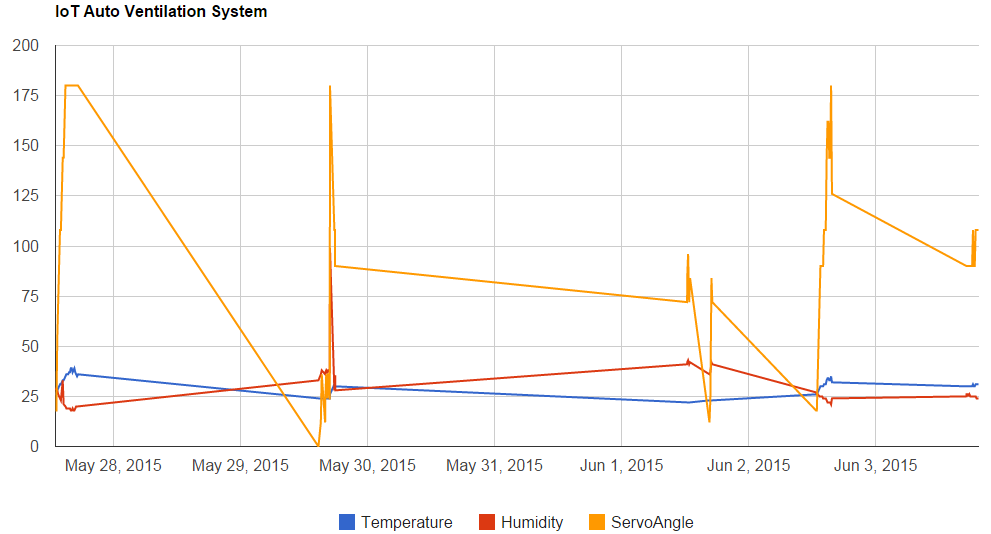
The database frontend was written in python and a Google API was used to draw graphs from the data. Lacking a suitable hosting provider, we ran the prototype web server locally on a laptop.
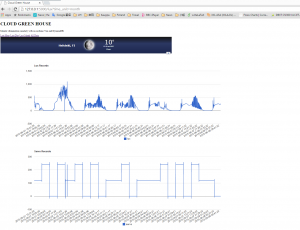
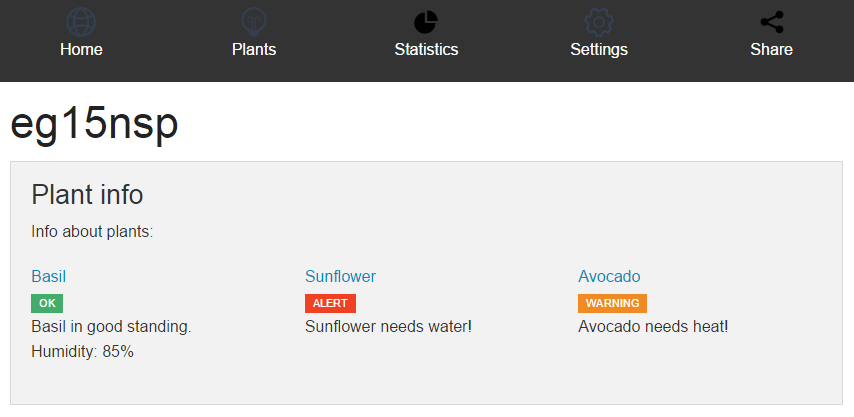
Web frontend: monthly view
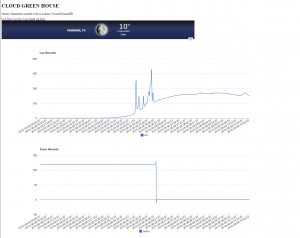
Web frontend: daily view
Testing
The light sensor was tested separately on a sunny week. As the weather has been mostly grey-ish this far, it was lucky to have a few sunny days during the testing period. Testing revealed that the sensor by itself overloaded (producing zero measurement result) when in direct bright sunlight. Therefore, we needed to insert a filter.
The whole system was left running with a plant on it for a week. However, such a short testing period did not really reveal much since plants do not grow that fast. Proper testing would have had a control plant with no rotation sitting near the system and done for at least a month to see the results.
In conclusion
Just before the demonstration, the WiFi password had changed at the department, which we didn’t know, and spent half a day wondering what had gone wrong the Arduino. (The experience did teach something new, though: you can log into the Arduino WiFi component with a Serial console sketch and configure the WiFi with an OpenWrt commandline tool called uci.) Also, at the demonstration, the upload naturally did not work as changed electrical outlets seem to affect WiFi connections or configurations. Just something to consider..
At the demonstration someone remarked that using the microwave platter was the mechanical innovation of the day. Generalising from that remark, the whole project consisted of a rather tight schedule to put together a working system out of some proper parts and lots of duct tape, and as such, coming up with the “duct tape” to bind everything together was the interesting bit.
In a whole system that spans from a light sensor to a cloud-based database, there are lots of technologies involved. One might have to learn from microcontroller programming to REST APIs and from soldering and using mechanical tools to 3D CAD design and 3D printing.
The team:
Yu Zhang – Hardware/mechanical design and implementation, DynamoDB setup, Web frontend
Heikki Lindholm – Arduino programming, 3D design
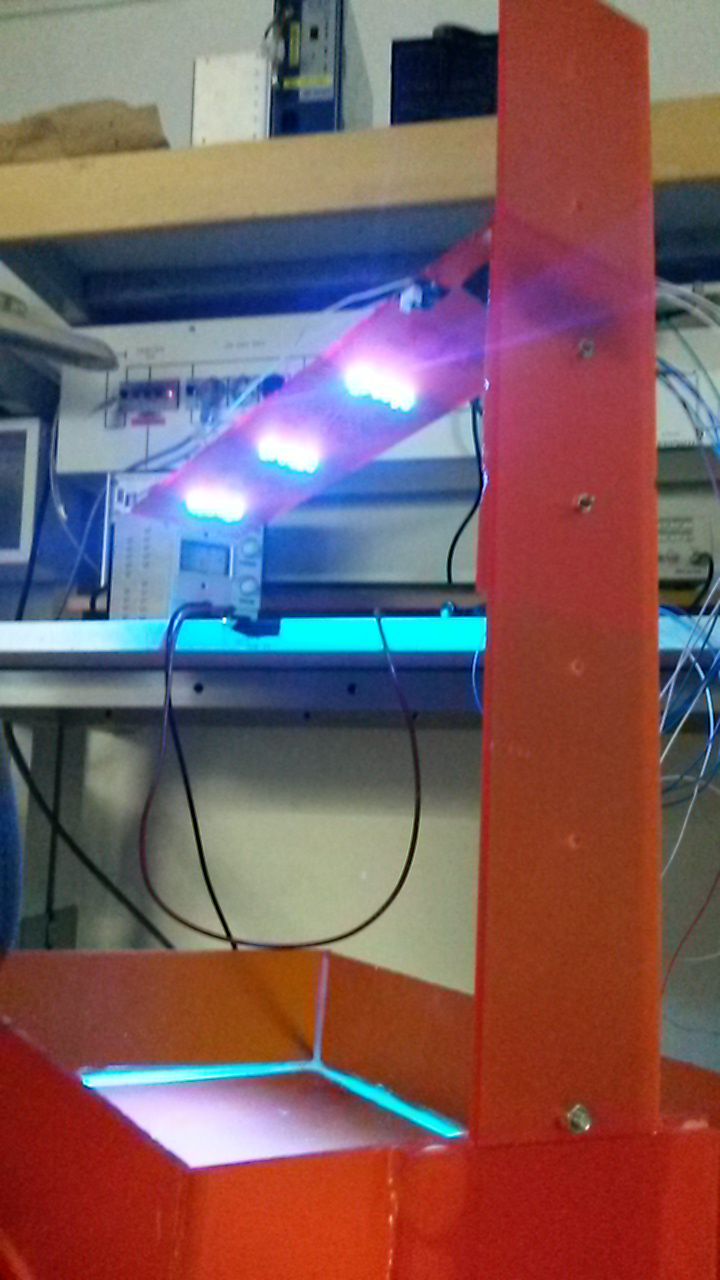
Video: testing the rotating platter
Video: prototype in action/testing
Source code: database upload (Arduino OpenWrt)
Source code: Arduino sketch
Source code: web page generator script