Category Archives: Yleinen

Welcome to the green lab!


We arranged seven week “Exact Greenhouse” courses at the Department of Computer Science of the University of Helsinki between 2014 and 2016. This course attracted a total of 47 students with different skill sets which were interested in building a greenhouse that was maintained by microcontroller-based devices. There were no other requirements for attendance except for that students should have completed a BSc degree in any of the specialisation lines of computer sciences. This requirement was set because participants would benefit from knowledge that typically develop during their BSc thesis work.

Greenhouse technology was chosen as the topic for the abundance of creative ideas and tutorials that could be found online. As industrial systems for agricultural automation have existed for decades, a wide range of small scale consumer goods were available. Many of them integrated mobile interfaces and social aspects into gardening, providing rich inspiration for innovative product design. As for the numerous online tutorials for do-it-yourself prototyping, evaluation of possible technical architectures was easy already at a very early stage. 
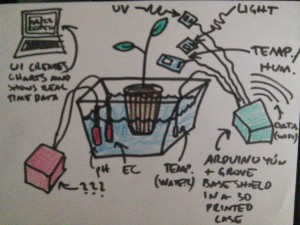
A Facebook course page was established and inspiring ideas with instructions for completing first milestones were communicated through it. For those students that did not use Facebook, the same information was delivered through email. This blog post summarises learning outcomes of the courses throughout the three years.

You can find the story of the research lab facility here.
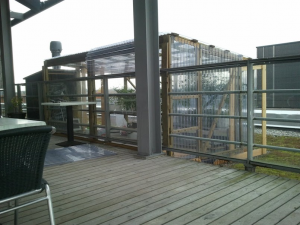
The first course in 2014 attracted 12 students.
Course page.

Problem Solution Microcontroller Members
Maintainers want to view the status of the facility to decide which maintenance tasks are required in the future. A web service that provides a graph visualization for any IoT device that is configured to push data through its general purpose API. Arduino Duemillanove 1
A maintainer needs to be alarmed if plants dry up. A product concept for a smart flowerpot container with a water reserve. Electric Imp 2
Humidity sensor unit to be placed in soil. The system alarms maintainers by creating a sound, helping to locate the plant when visiting the greenhouse. Arduino Uno 1
The greenhouse gets too hot and humid during the afternoons. If doors are left open, it will get too cold during the night. A six point temperature and humidity sensor system Intel Galileo 1
An automated fan system, using data from the previous project Intel Galileo 1
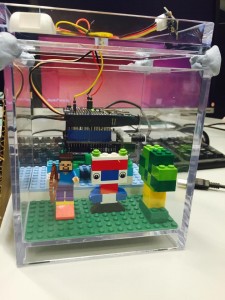
Hydroponic cultivation is failing constantly for an unknown reason. A device that measures a wide range of environmental variables from air and water. Arduino Yun 1
Greenhouse maintenance team wants to know who has visited the greenhouse recently. A NFC keychain system to track visitors. Raspberry Pi 1


23 students enrolled to the second course in 2015.
Here are their projects:

Problem Solution Microcontroller Members
Plants grow unevenly as sunlight enters the greenhouse from one direction only A light-sensitive, rotating platform. Arduino Yun 2
Greenhouse maintainers may not be available at all times. Automated growing system that adjusts flow of water from a large tank and sends pictures and state information on Twitter. Raspberry Pi 2
Plants need different kinds of light for efficient growth. Sapling container with adjustable lightning. Raspberry Pi 3
Different plants consume water at different pace. A set of independent sensor modules for one microcontroller unit. Arduino Pro Mini 2
As the amount of plants increase or decrease, several maintenance tasks are needed. Hydroponic growing platform that can be easily extended as the farm grows. Arduino Uno 3
Maintainers want to overview the status of the facility to evaluate which maintenance tasks are required. A multifaceted web service providing a graphical visualization. Arduino Yun 2
Temperature of the greenhouse gets very high in the afternoon. If the air is moist, soil and plants may develop mold. Automatically functioning pulley system that adjusts ventilation according to temperature and humidity. Arduino Yun 2
N/A Device measures air temperature, humidity, CO2 Arduino Uno 3
Device measures soil temperature, humidity and light Arduino Uno 1


The last course in 2016 attracted 12 innovators.
Course page. 

Problem Solution &  link to the project page Microcontroller Members
The greenhouse attracts pigeons Automated movement sensing water gun to deter the pigeons. Raspberry Pi 1
Plants need different kinds of light and shade periods for efficient growth. Automated system to control built-in lights and shades Intel Edison 1
Maintainers need to be notified when soil dries. Maintainers want to reconfigure the device to match needs of different plants. Automated system to control built-in lights and shades Arduino Mega 2
Maintainers need to overview the state of the facility and be alarmed if a reaction is needed. Advanced web visualisation prototype Lightblue bean 1
A system that monitors temperature and humidity of soil. Image analysis tool for identifying changes in the look of the plants. Raspberry Pi 1


Publications

This article shows specifics of the hardware required to arrange a similar course and the first year’s course syllabus.

Blending Problem-and Project-Based Learning in Internet of Things Education: Case Greenhouse Maintenance.” Proceedings of the 46th ACM Technical Symposium on Computer Science Education. ACM, 2015.

This article summarises our learnings from teaching the three courses and offers key take-aways.
Assessing IoT projects in University Education – A framework for problem-based learning.” Conference: International Conference on Software Engineering (ICSE), Software Engineering Education and Training (SEET), 2017
Many thanks to the awesome research and teaching team.
Hanna Mäenpää, Samu Varjonen, Arto Hellas et al.
Decoctus, Basil Curls

by Liisa Lado-Villar

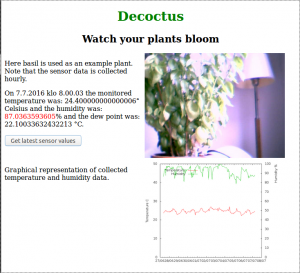
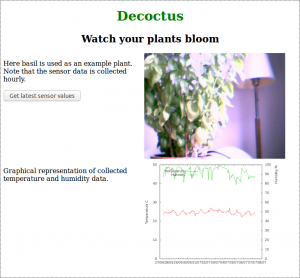
Browser view of watched plant.

Figure 1, Browser view of watched plant.

Monitor you plant remotely with browser, watch webcam image and observe temperature and humidity graph.

Decoctus is the name for this small system that helps to grow a plant. With help of a sensors the plant can be monitored remotely and watched its well-being.  The core of this system is Raspberry Pi microcomputer. It controls SHT10 humidity & temperature sensor and a webcam, additionally it hosts a Node.js  web server and acts as storage for collected data. A web browser is used to show the sensor data in graph form and and the latest photograph of the plant.

Hardware

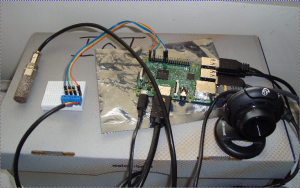
Figure 2, the used hardware

Figure 2, the used hardware on top of a shoebox

For monitoring environment of the watched plant  SHT10 temperature and humidity sensor is coupled to Rasberry Pi 2 GPIO pins. The pi-sht1x library of Keito extracts data from the sensor and converts to human readable form, into Celsius degrees and relative humidity percentage.

Wiring

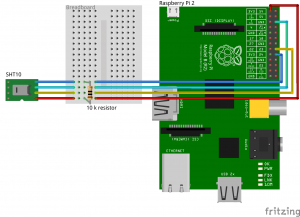
About wiring the SHT10, take a look of figure 3. From sensor wires go through a breadboard to enable power and data wires to pass 10K resistor. Green wire is ground and it is coupled to a GPIO ground port, here third down from the right. Blue is the data line used for readings, coupled to ninth at right row, physical port number 18 or GPIO 24. Above it is the yellow clock wire at port port 16, that is GPIO 23. And the fourth red power wire is first in left 3,3V port 1 or GPIO 01.

Figure 2, sensor wiring though a breadboard to GPIO pins.

Figure 3, sensor wiring though a breadboard to GPIO pins.

Wiring is used and data fetched with help of Keito’s JavaScript library and here follows the whole Node.js code that saves data to csv file called decdata.csv.

Sensor data collecting

fs = require('fs');
var async = require('async');
var sht10 = require('./js/pi-sht1x')

datapath = 'decoctus/julkinen/data';
filename = 'decdata.csv';
HEADERLINE = 'Time Temperature Humidity Dewpoint\n';
dataline = '';

//read sensor data
async.series([
sht10.init,
sht10.reset,
function(callback) {
sht10.getSensorValues(function(error, values) {
dataline = dataline + Math.floor(Date.now() /1000); //Timestamp from milliseconds to seconds.
dataline = dataline + '\t' + values.temperature + '\t' +values.humidity + '\t'+ values.dewpoint + '\n';
writesensordata();
callback(error);
});
}
], function(error) {
sht10.shutdown();
if (error) {
console.error(error);
}
});

function writesensordata(callback)
{
//Write sensor data to given file
fs.access(datapath + '/' + filename, fs.F_OK, function(err) {
if (err) {
var datafile = fs.appendFile(datapath + '/' + filename, HEADERLINE, (err) => {
if (err) throw err;
else console.log('A new data file was created with headers.');
});
}

var datafile = fs.appendFile(datapath + '/' + filename, dataline, (err) => {
if (err) throw err;
console.log('New sensor data was appended to '+ filename + ' file.');
});
});
}

Shooting images

For shooting pictures a Microsoft webcam with USB connector was plugged to one of Raspberry’s USB ports. For to use webcam fswebcam library was downloaded with sudo apt-get install fswebcam in Raspberry’s terminal. From command line you can shoot picture simply commanding fswebcam photo.jpg  where captured image is saved in photo.jpg file. With on option it is possible to give configuration file for commad, to keep the command reasonable short. Here is used configuration file:
$cat webcam.conf
device /dev/video0 #only one camera here
delay 1
skip 20 # Take 20 frames before saving for sharper image
jpeg 80
#resolution 1600x896 #max is 640x480
resolution 640x480
no-banner #Leave comments out from saved image
set "White Balance Temperature, Auto"=False
set "White Balance Temperature"=5000
set "Focus, Auto"=False
set "Focus (absolute)"=52
set "Exposure, Auto"=False
set "Exposure (absolute)"=215
set "Gain"=1
#set "Sharpness"=240 #Did not sharpen the image
#set "Contrast"=40 # Neither did this help for better quality
frames 1

Raspbery Pi

The used controller is Raspberry Pi 2 Model B, installed with Raspbian Jessie operating system.

Software Backend

In server, here is the same Raspberry again,  there are two server processes, continuous web server and hourly executing data collection process. The web server is implemented with Node.js tuuttuut.js code as well as SHT10 sensor data saving with sensordata.js program. Data saving is initiated with Cron through keraa.sh bash script.

Decoctus directory structure

Because there is not used any web softaware framework here is also part of systems directory structure.
decoctus/
├── julkinen
│ ├── css
│ ├── data
│ └── kuvat
└── skriptit
├── js
└── node_modules
├── async
│ ├── dist
│ ├── internal
│ └── node_modules
│ └── lodash
│ └── fp
├── gyp


├── onoff

├── opencv

├── pi-gpio
│ └── test

Linux timer Cron

*nix timer Cron is used to schedule to run image shooting and sensor data collecting. */04 * * * * NODE_PATH=/usr/lib/nodejs:/usr/lib/node_modules:/usr/share/javascript PATH=/usr/local/sbin:/usr/local/bin:/usr/sbin:/usr/bin:/sbin:/bin:/usr/local/games:/usr/games /usr/bin/node /home/pi/decoctus/skriptit/sensordata.js Runs every fourth minute the sensordata.js script, for test purposes. In Decoctus system it is used to run keraa.sh script once in an hour.

# m h  dom mon dow   command
0 * * * * /home/pi/decoctus/skriptit/keraa.sh

Bash script

And keraa.js launch senor data collecting, webcam shooting and plotting of newest sensor data grap with gnuplot.

#!/bin/bash
DATESTMP=`date +"%d%m%Y%H%M"`
PATHBASE="/home/pi/decoctus/"
FILECONFIG="webcam.conf"
PATHSKRIPTI="skriptit/"
PATHDATA="julkinen/data/"
PATHKUVAT="julkinen/kuvat/"
FILEDATA="decdata.csv"
FILEKUVA=$PATHBASE$PATHKUVAT"kuva"$DATESTMP".jpg"
CONF=$PATHBASE$FILECONFIG

#does not run the node script from cron without giving paths, here right one should be just added.
CURDIR=`pwd`
cd $PATHBASE
#Get older photo for comparing shapes or edges of a plant
#KUVACOMP=`ls -t julkinen/kuvat/kuva*.jpg | head -16 | tail -1`
#cp $KUVACOMP julkinen/kuvat/kuva_comp.jpg
mv julkinen/kuvat/kuva.jpg julkinen/kuvat/kuva_prev.jpg
#And fetch data from sensor sht10.
NODE_PATH=/usr/lib/nodejs:/usr/lib/node_modules:/usr/share/javascript
PATH=/usr/local/sbin:/usr/local/bin:/usr/sbin:/usr/bin:/sbin:/bin:/usr/local/games:/usr/games
node /home/pi/decoctus/skriptit/sensordata.js
gnuplot skriptit/gnuplottext
cd $PATHSKRIPTI
#Take the photograph
fswebcam --config $CONF $FILEKUVA
cd ../$PATHKUVAT
VIKAKUVA=`ls -t | head -1`
cp $VIKAKUVA kuva.jpg
#Get older photo for comparing shapes or edges of a plant #Does not work from cron
KUVAV=`ls -t1 | head -16 | tail -1`
cp $KUVAV kuva_comp.jpg
cd $CURDIR

Nodejs web server

For Node.js server tuuttuut.js to serve a html file, images and text for AJAX text, following code is used.

var http = require("http");
var fs = require('fs');
var url = require('url');
var path = require('path');
var exec = require('child_process').exec;

var sensordata = '?';
var basedir = 'julkinen';

mimetypes = {
“.html” : “text/html”,
“.css” : “text/css”,
“.png” : “image/png”,
“.jpg” : “image/jpg”,
}

//First getdata returns empty line????
function getdata(){
exec('tail -1 julkinen/data/decdata.csv', function(error, stdout, stderr){
if (error) {
console.error('exec error: ' + error);
sensordata = 'Data retrieving error: ' + error;
}
else {
sensordata = stdout;
}
});
}
/**
*
*/
http.createServer(function (request, response) {
function serveitem(mimetype, requestfile) {
response.writeHead(200, {'Content-Type': mimetypes[mimetype]});
if (requestfile=='/') {
requestfile='index.html';
}
var ofile = fs.readFileSync(basedir + '/' + requestfile)
response.end(ofile);
}

try {
var requrl = url.parse(request.url, true); //true for query property
var reqfile = requrl.pathname;
var ext = path.extname(reqfile);
if (ext==”) {
ext = ‘.html’;
}
console.log(‘MENOSSA ‘ + reqfile);
if (reqfile==’/decline’) {
getdata();
response.writeHead(200, {‘Content-Type’: ‘text/plain’});
response.end(sensordata);
} else {
serveitem(ext,reqfile);
}
} catch(e) {
response.writeHead(500);
response.end();
console.log(e.stack);
}
}).listen(8013);
console.log(‘Server running at http://*.*.*.17:8013/’);

Software Frontend

Figure 4, The system fetches also latest sensor values

Figure 4, The system fetches also latest sensor values

In figure 4, it is possible to see the parts of system web  page. There is the latest, at most an hour ago grabbed photo of the watched plant, the graph plottet when the photo an sensor value was taken and a button to get the last sensor readings. Colour ofreading s are red if beforehand given limits are passed. In the system here is index.html page from where next AJAX code is taken.

Index.html

function getsdata() {
var areq = new XMLHttpRequest();
var datal;
var datadate;
areq.open("GET", "http://192.168.0.17:8013/decline", true);
areq.onreadystatechange = function() {
if (areq.readyState == 4 && areq.status == 200) {
datal=areq.responseText;
datal = datal.split('\t');
datadate = new Date(datal[0]*1000).toLocaleString();
var datatemp = datal[1];
if (datatemp<15) {
datatemp = '' + datatemp + '';
}
var datahum = datal[2];
if (datahum < 90) {
datahum = '' + datahum + '';
}
var nicedataline = 'On ' + datadate + ' the monitored temperature was: ' + datatemp + '° Celsius and the humidity was: ' + datahum + '% and the dew point was: ' + datal[3]+ '°C.';

document.getElementById(“dataline”).innerHTML = nicedataline;
}
};
areq.send();
}
/

Coming next

Maybe there is too much on Raspberry, web server data collection and data. And everything without any backup, first development need is to take backups. Later maybe copy whole image to cloud and separate data storage. Next change AJAX to some library that allows server push data, then draw the graph on canvas whenever data has been updated. Then add to the keraa.sh script deleting jpg files, just leaving weekly samples maybe.

Gnuplot script

Here is also gnuplot script.
$ cat skriptit/gnuplottext
set terminal png size 720,540
set output 'julkinen/decraph.png'
set xdata time
set ylabel "Temperature C"
set y2label "Humidity %" offset 0,10
set yrange [0:50]
set y2range [0:100]
set y2tics 10
set timefmt '%s'
set key left top title " "
set key autotitle columnhead
plot 'julkinen/data/decdata.csv' using 1:2 axes x1y1 title 'Temperature' with lines, 'julkinen/data/decdata.csv' using 1:3 axes x1y2 title 'Humidity' with lines

OpenCV

For using computer vision to automatically detect transformation in a plant it is possible to use Node.js with openCV library. And start like in this code here.
var cv = require('opencv');
const inpath = 'julkinen/kuvat/'
var area1, area2;

inputimage1 = inpath + ‘kuva.jpg’
inputimage2 = inpath + ‘kuva_comp.jpg’

cv.readImage(inputimage1, function(err, image1){
if (err) {
console.log(err);
}
else {
image1.convertGrayscale();
var contours1 = image1.findContours();
var area1 = contours1.area(0);
}
});
cv.readImage(inputimage2, function(err, image2){
if (err) {
console.log(err);
}
else {
image2.convertGrayscale();
var contours2 = image2.findContours();
var area2 = contours2.area(0);
}
});

if (area2 < area1)
console.log(‘Send alert.’);
else
console.log(‘Don’t worry.’);

Project: Greenhouse eXactum

Greenhouse-eXactum concept / by Timo Hyyppä

Code: https://github.com/Hakkarainen/greenho

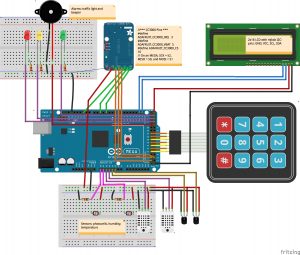
HW-Components:

greenhouse_components_v01

IMG_0166_pScreen Shot 2016-06-29 at 22.54.02

greenhouse_schema_v01_bb3IMG_0148_p

Application:

The application has six parts:
1. Sensor-handling and configuration management
2. Alarm-generation and processing
3. NTP-time stamping
4. Local statistics and reporting
5. sensor analytic on remote web-dash board.
6. MQTT-based network communication

1. Sensor-handling and configuration management

Sensors are connected to analog-inputs A0-A5 of Arduino Mega. There are three kind of sensors: photocells, humidity- and temperature sensors. The sensors are calibrated by using the measurement values of a reference plant-pot as reference levels. If the conditions of a reference plant are changed drastically, new reference values are read automatically and averaged as reference levels for the sensors in other plant-pots . Each plant type has two kind of profiles (soil and air) defined in
relativistic manner when comparing to the reference levels of the reference plant.

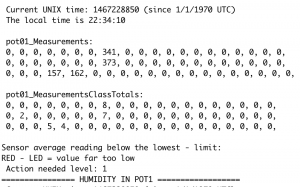
Screen Shot 2016-06-29 at 23.53.38

All measurements are based on several readings with a proper delay in between and those are averaged. If measurements are out of range at many sensors repeatedly, a re-calibration of sensors is executed automatically. The time dependent functionalities of the sensor measurements are parametrized and thus can be adjusted according to needs.

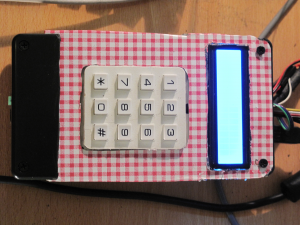
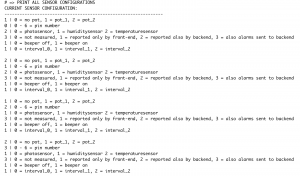
The number of sensors can be set and their functionalities and connections can be managed. An example configuration application is implemented in the demo, which also prints the current and modified configurations on the console (per sensor and all sensors) for user review.

Screen Shot 2016-06-29 at 23.06.25

All sensor measurements can be sent to the backend cloud via a publish/subscribe protocol (MQTT) for the pot-specific dash board application. System can also be configured per sensor in a mode which makes only local statistics without the need for network communication for the remote dash board.

Screen Shot 2016-06-29 at 23.10.37

2. Alarm-generation and processing

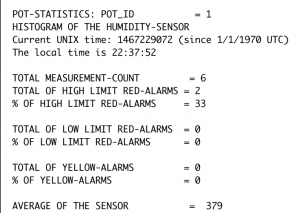
Each plant type have specific profiles which define the optimal life conditions (measurement ranges) for it. There are both soil and air profiles for the plant type and three relativistic zones (green, yellow and red) are defined above and below the reference plant levels. After measurement it is analyzed and classified by the alarm-application and also cumulative alarm-statistics are maintained and printed out on console locally.

Alarms are reported to the user via a traffic light-like LED-based display and a beeper. Number of beeps and the pitch of the signal ending tone informs the user about which zone the measurement belongs to and how serious the alarm is. The green zone does not generate any sound, The beeper can be set on or off by the user. Alarms are also sent to the backend cloud via a publish/subscribe protocol (MQTT) for the pot-specific dash board application.

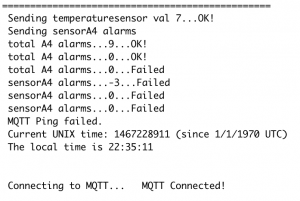
For the local serial monitor the alarms are printed as clear console-text, which gives to the user information about the seriousness of the alarm and some proposals for corrective care actions.

Screen Shot 2016-06-29 at 23.10.37

3. NTP-time stamping

The system keeps track of correct time-stamping via NTP-protocol which fetches the official Internet time (Unix-time) in seconds when ever needed. Unix time is converted also into local time for the reporting on the console.
4. Local statistics and reporting

The system classifies the measurements into selected number of classes configured during the system installation. The last classified measurements and cumulative statistics are stored locally for console reporting. Measurement statistics and also histograms covering longer periods are available. Alarms are reported respectively per alarm zones.

Screen Shot 2016-06-29 at 23.17.08

Screen Shot 2016-06-29 at 23.42.42

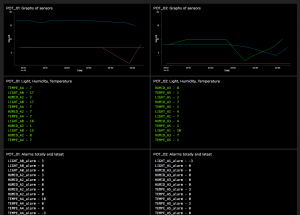
5. Sensor analytic on remote web-dash board.

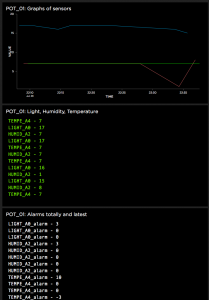
The remote web-dash board application supports creation of sensor and alarms based publish/subscribe-information feeds and configuring of a set of selected UI-components which are able to process the data feed inputs for user. The dash board UI-components are able to draw graphs at selected time interval scale and in real time. New feeds and UI-components can be created and existing ones updated or removed. If a new subscription feed is created at dash board end it needs definition of its publishing counterpart in the Arduino end and vice versa is true if a new publisher is defined in the Arduino end.

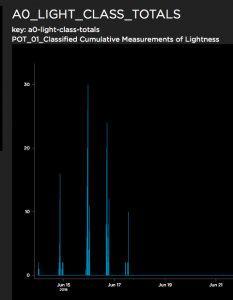
In the demo the pot-specific sensor measurements are displayed as realtime sensor-graphs and also cumulative class-histograms. The sensor specific alarms are displayed in real time as pot-specific lists. The dash board allows flexible configuration change and information presentation capabilities.

https://io.adafruit.com/dashboards

Screen Shot 2016-06-29 at 22.55.52Screen Shot 2016-06-29 at 23.01.59


6. MQTT-based network communication

Why MQTT IoT-protocol ?
https://learn.adafruit.com/mqtt-adafruit-io-and-you/why-mqtt

MQTT IoT-protocol:
http://mqtt.org/faq
6.1 This Greenhouse-project uses:
https://learn.adafruit.com/mqtt-adafruit-io-and-you/intro-to-adafruit-mqtt
Publish & Subscribe protocol / Adafruit-concept:

With MQTT the Greenhouse system can publish data to the MQTT-broker, and also subscribe data from the MQTT-broker.

Adafruit CC3000 wifi + MQTT:

https://www.adafruit.com/products/1469
https://github.com/adafruit/Adafruit_MQTT_Library/blob/master/examples/mqtt_cc3k/cc3000helper.cpp

Screen Shot 2016-06-29 at 23.32.36

Libraries needed:

#include “Adafruit_MQTT_CC3000.h”
#include “Adafruit_MQTT.h”
#include “Adafruit_MQTT_Client.h”

/*** Adafruit.io Setup ***

#define AIO_SERVER “io.adafruit.com”
#define AIO_SERVERPORT 1883
#define AIO_USERNAME “…your AIO username (see https://accounts.adafruit.com)…”
#define AIO_KEY “…your AIO key…”

// Store the MQTT server, username, and password in flash memory.
// This is required for using the Adafruit MQTT library.
const char MQTT_SERVER[] PROGMEM = AIO_SERVER;
const char MQTT_USERNAME[] PROGMEM = AIO_USERNAME;
const char MQTT_PASSWORD[] PROGMEM = AIO_KEY;

// Setup the CC3000 MQTT class by passing in the CC3000 class and MQTT server and login details.
Adafruit_MQTT_CC3000 mqtt(&cc3000, MQTT_SERVER, AIO_SERVERPORT, MQTT_USERNAME, MQTT_PASSWORD);
Greenhouse-project implementation using io.adafruit:

Greenhouse-project libraries for connectivity:
#include <Adafruit_SleepyDog.h>
#include <Adafruit_CC3000.h>
#include <SPI.h>

#include “utility/debug.h”
#include “Adafruit_MQTT.h”
#include “Adafruit_MQTT_CC3000.h”
#include <ccspi.h>
/*** Feed examples used in Greenhouse project ********************/

// Setup a feed called ‘lightsensorA0’ for publishing.
// Notice MQTT paths for AIO follow the form: <username>/feeds/<feedname>
const char LIGHT_A0[] PROGMEM = AIO_USERNAME “/feeds/LIGHT_A0”;
Adafruit_MQTT_Publish lightsensorA0 = Adafruit_MQTT_Publish(&mqtt, LIGHT_A0);

// Setup a feed called ‘humiditysensorA2’ for publishing.
const char HUMID_A2[] PROGMEM = AIO_USERNAME “/feeds/HUMID_A2”;
Adafruit_MQTT_Publish humiditysensorA2 = Adafruit_MQTT_Publish(&mqtt, HUMID_A2);

// Setup a feed called ‘temperaturesensorA4’ for publishing.
const char TEMPE_A4[] PROGMEM = AIO_USERNAME “/feeds/TEMPE_A4”;
Adafruit_MQTT_Publish temperaturesensorA4 = Adafruit_MQTT_Publish(&mqtt, TEMPE_A4);
// Alarm-feeds

// Setup a feed called ‘lightsensorA0alarm’ for publishing.
const char LIGHT_A0_alarm[] PROGMEM = AIO_USERNAME “/feeds/LIGHT_A0_alarm”;
Adafruit_MQTT_Publish lightsensorA0alarm = Adafruit_MQTT_Publish(&mqtt, LIGHT_A0_alarm);

// Setup a feed called ‘humiditysensorA2alarm’ for publishing.
const char HUMID_A2_alarm[] PROGMEM = AIO_USERNAME “/feeds/HUMID_A2_alarm”;
Adafruit_MQTT_Publish humiditysensorA2alarm = Adafruit_MQTT_Publish(&mqtt, HUMID_A2_alarm);

// Setup a feed called ‘temperaturesensorA4alarm’ for publishing.
const char TEMPE_A4_alarm[] PROGMEM = AIO_USERNAME “/feeds/TEMPE_A4_alarm”;
Adafruit_MQTT_Publish temperaturesensorA4alarm = Adafruit_MQTT_Publish(&mqtt, TEMPE_A4_alarm);
// TOTALS FOR HISTOGRAMS FEEDS

//Measurement totals-feeds:
// Notice MQTT paths for AIO follow the form: <username>/feeds/<feedname>
const char A0_LIGHT_CLASS_TOTALS[] PROGMEM = AIO_USERNAME “/feeds/A0_LIGHT_CLASS_TOTALS”;
Adafruit_MQTT_Publish A0lightClassTot = Adafruit_MQTT_Publish(&mqtt, A0_LIGHT_CLASS_TOTALS);

//Measurement totals-feeds:
const char A2_HUMID_CLASS_TOTALS[] PROGMEM = AIO_USERNAME “/feeds/A2_HUMID_CLASS_TOTALS”;
Adafruit_MQTT_Publish A2humidClassTot = Adafruit_MQTT_Publish(&mqtt, A2_HUMID_CLASS_TOTALS);

//Measurement totals-feeds:
const char A4_TEMPE_CLASS_TOTALS[] PROGMEM = AIO_USERNAME “/feeds/A4_TEMPE_CLASS_TOTALS”;
Adafruit_MQTT_Publish A4tempClassTot = Adafruit_MQTT_Publish(&mqtt, A4_TEMPE_CLASS_TOTALS);

// END OF FEEDS DEFINITION *****************************************************


greenhouse_components_v01

Greenhouse monitoring system

A monitoring system based on Light Blue Bean, node.js/Johnny-Five and d3.js

Overview

IoT is a huge trend nowadays but it doesn’t necessarily guarantee real value for users. This project is basically a simple system for monitoring plants well-being. Main focus was to present collected data in clear and readable format and offer real value (usefulness) to users. One design aspect was to offer user interaction instead of just presenting monitoring data.

  • Features of the system:
  • Current temperature
  • Temperature trend
  • Current light level
  • Current soil moisture value
  • Previous soil moisture value
  • Alarms:
    • Temperature – Adjustable low and high limit values
    • Soil Moisture – Adjustable low limit value
  • E-mail notifications based on user defined alarms and measurement data.

arc

Light Blue Bean and sensors

Light Blue Bean is Arduino compatible micro controller board that uses Bluetooth Low Energy for communication. Bean has 5 digital pins and two analog pins that can be used also as digital pins. The Bean has also a built-in temperature sensor, a three-axis movement sensor and a RGB led.

Bean includes a small prototyping board where you can solder your sensors etc. I soldered photo resistor and wires for soil moisture sensor (basic conductor sensor). I soldered also external power supply wires for small battery back. Power source for Bean needs to between somewhere between 2.6v and 3.6v. Nominal voltage for Bean is 3.3v. I used old battery case with two 1.5v AA batteries which gave me around 3.2v when batteries were full. Bean was running several days with this setup.
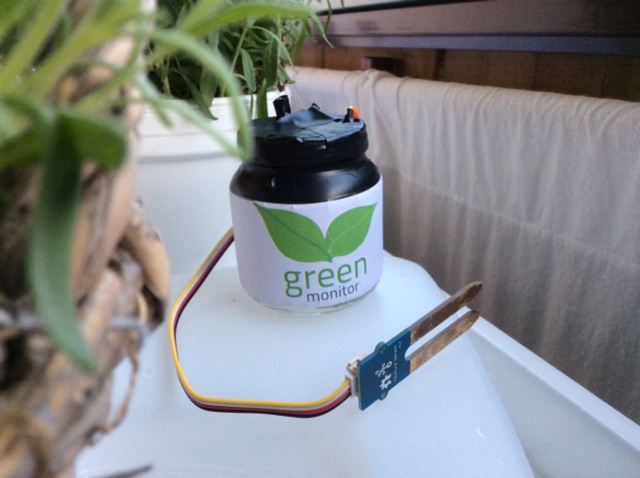
I installer the Bean into a small glass jar. One great advantage of the Light Blue Bean is it’s relatively small size and independence of wires (if you don’t need external sensors or power).

For starting to use the Bean you need first upload your program (sketch) to the Bean. First a sketch is loaded with Arduino IDE to the Bean Loader. Open Arduino IDE and Bean Loader programs.  Select Bean from the board list in Arduino IDE. Then you can upload sketches to the Bean Loader. After that In the Bean Loader app simply connect to your Bean and upload the program. You might need to update your Bean firmware also, depending on the version your device is running.

I found out that loading sketch (firmata-bean in my case) to the Bean was unreliable. Sometimes it succeeded and sometimes not. I didn’t do any serious testing but I started to think that bluetooth signal strength might have something to do with it.

IMG_0833

Back-end 

Johnny Five framework is a JavaScript framework for controlling micro controllers / bots. Johnny five works (almost) straight out the box with common Arduino boards and you can use also other boards with dedicated IO-classes.

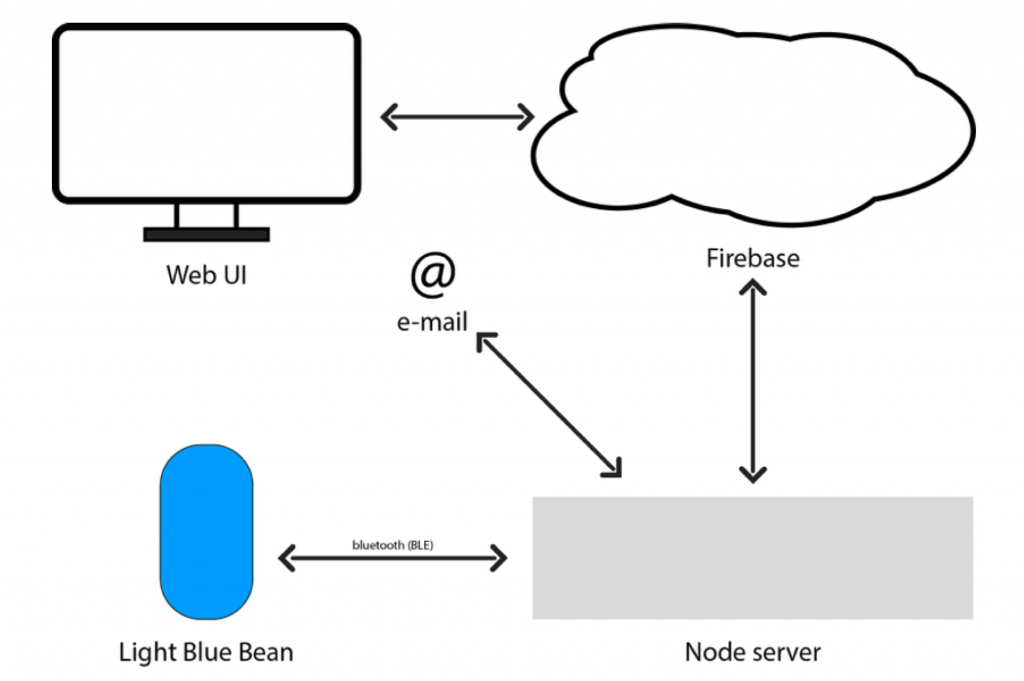
Light Blue Bean is plain BLE connection device so you can’t connect it with usb wire. Fortunately there is an easy way to connect the Bean to the Johnny Five with Bean-io class.

Bean’s built-in sensors are independent from the Arduino side. For polling these sensors Ble-Bean is a convenient solution.

You need to include all these plug-ins to your Node.js script. It is also mandatory to load firmata-bean sketch to the Bean. After that it is pretty straight-forward to use the Bean with Johnny-five.

One thing that is needed to take into account when programming Arduino side of the Bean is different mapping of the pins, e.g. when using analog pins A0 and A1 you need to call pins 4 and 5.

All the data was stored to Firebase. I used simple user account authentication. The data from the Bean was read and stored every two hours. When the Bean data is read script also checks if the values are within the user defined alarm limits stored in the Firebase. If the read sensor value isn’t within the user defined limits node script sends notification e-mail to the user with NodeMailer.

Sensor readings and scaling the values 

I used old soil moisture sensor which was already pretty heavily corroded. I needed to adjust the value range to suit the sensor readings which were approximately half of the theoretical maximum. I scaled the values before I stored the data to the Firebase.

Light level sensor was simple photo resistor that came with the Arduino Starter Kit. I needed to adjust the scaling of the sensor readings. The readings might be linear but I decided to cut the floor limit to around the 45% of the max value which was already very dim level.  This way the shown values were more in line with how humans perceive brightness. Probably plants needs also some light before anything happens.

Front-end

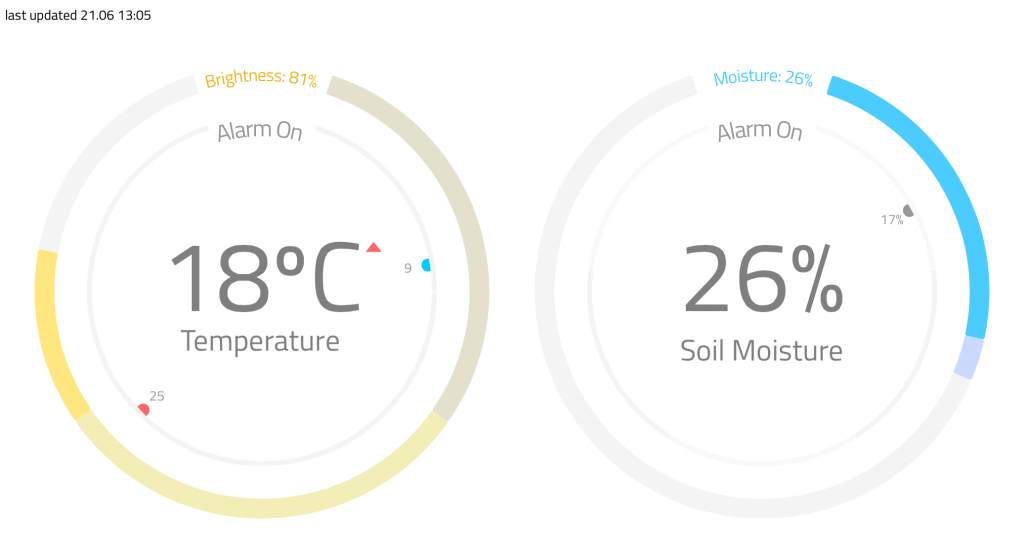
Front-end was made with D3.js and Angular.js. I first looked ready made re-usable charts, but I soon came to conclusion that I needed to do all the graphical presentations from the scratch with D3.js. If you want to use easily customisable charts with Angular for your data, check Angular-nvD3 or NVD3.js. I also included Ionic for easy platform conversations (iOS and Android). Ionic made it easy to run the app at certain IP so I could test the layout and usability with touchscreen devices such as iPad.

gh_view

D3 part is implemented as an angular directives. Angular controller and directives listens changes in Firebase and data is updated in real time. When user changes alarm seting angular code changes Firebase database values that are also monitored by back-end.

Detected problems / difficulties

I already mentioned that there was occasional problems when I was tried to load sketches to the Bean.

I also noticed that polling data from the Beans Arduino part didn’t work well when polling frequency was high. Average time the data updated reliable seemed to be around two minutes. If the polling time was below two minutes there were usually duplicated values from previous readings even the readings should have been something else. This problem didn’t concern the Beans built-in sensors controlled by Ble-Bean which worked just fine. There’s might be an easy fix for this problem but I didn’t found out the solution. Anyhow in my final version the data was read every two hours and the data seemed to be reliable with this frequency.

Future possibilites and reflections

The user adjustable threshold values could be used for new hardware implementations such as watering the plants or controlling ventilation / shading actions. Back-end (Node.js) could easily run in Raspberry or some other low cost device.

This project was clearly a prototype. The hardware installation could be done better. I thought about using 3.5mm jacks for the power and moisture sensor connection but I just didn’t buy those. However the glass jar worked well with the photo resistor. At code level there is also room for structural improvement but considering the scope of this course I’m pretty happy for the results as a whole.

Code examples can be found here.

Automated Lights and Curtains

Overview
Automation is the key to make life easier. In this project, we have implemented a simple Internet of Things (IoT) system to automate lighting and curtains based on triggers from the environment. The automation system can turn on or off the lights and adjust the brightness if needed. The system can also lower or open curtains. As the trigger to initiate actions, different sensors such as luminosity could be used, but in this project, the main trigger is network traffic.

Hardware
Philips Hue bridge + 3x lights
Intel Edison + Intel Edison Kit for Arduino
28BYJ-48 5V DC 4-Phase 5-Wire + ULN2003 Stepper Motor Driver Board
Dell D630 laptop with Netwjork W522U USB WLAN dongle
Easton Carbon One 660 arrow

Wiring the Curtains
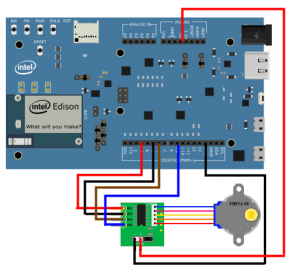
Edison-wiring
The stepper motor board was wired to the following pins on the Arduino kit:
IN1 -> 3
IN2 -> 5
IN3 -> 6
IN4 -> 9
GND -> Digital GND
+ -> 5V

Software
The following software and libraries were used in the project
Mraa: Low Level Skeleton Library for Communication on GNU/Linux platforms [3]
phue: A Python library for Philips Hue [4]
Scapy: the python-based interactive packet manipulation program library [6]
Dnsmasq [1]
Hostapd [2]
Google Protobuf [5]

Description of the Prototype
As the full prototype includes a lot of moving pieces, brief descriptions of each piece is given here.

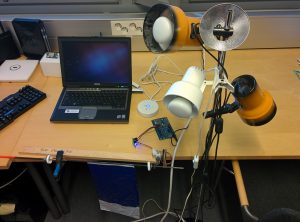
IMG_20160630_123652
Access Point
The central part of the system is a Dell D630 laptop. The laptop acts as an wireless access point and router for the entire system. The laptop is running Ubuntu 14.04 LTS, dnsmasq [1] and iptables. The AP is created using a Netwjork W522U USB WLAN dongle, which supports master mode, and hostapd [2]. The Philips Hue Bridge is plugged into the AP using a generic USB Ethernet dongle. The Edison uses its onboard WLAN NIC to connect to the AP.

IoT Hub
The IoT Hub is a small central server, which listens commands from different monitoring elements. These elements can be for example sensors (with relevant software) monitoring luminosity or network monitors. In the end, it does not matter what kind of trigger or combination of triggers are used, something needs to gather the signals and translate them to relevant actions.

The IoT Hub listens for commands through a protocol created with Google Protobuf.[5] In general, the signals are notifications from events. In IoT environment, signal could be luminosity change, or in a bit more general environment, a network event such as stream to specific address or a DHCP request.

In the end, the hub takes inputs and then translates them to relevant outputs to different IoT devices, in this case, the curtains and the lights.

Intel Edison and Curtains

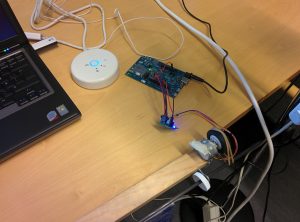
IMG_20160630_123728
The stepper motor is wired to the arduino board, including power and ground. On the Edison, mraa, a low level skeleton library for communication on GNU/Linux platforms with Python bindings [3] is used to change the state of the pins and drive the stepper motor.

A small UDP socket server is used to listen simple, unauthenticated UDP datagrams. When the server receives either “open” or “close” command, the server runs the stepper motor in full-wave mode in either clockwise or counterclockwise direction by specified number of steps. By experimenting, 700 steps with 0.01 second interval between steps seems to be about right for the current gearing ratio for rolling the curtain up down.

Philips Hue

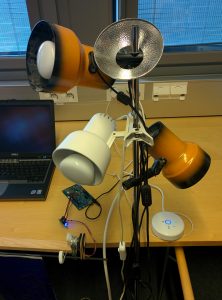
IMG_20160630_123747
To control the lights, an off-the-shelf Philips Hue set is used. The set contains three lights and a bridge to control the lights. The basic setup, i.e. associating the lights to the bridge and other initial setup was done through an android app, but for the actual communications between the setup and lights were done using Phue library.[4] A small server listening for UDP datagrams was implemented on the laptop. This time, instead of using plain text open/close -messages, a Google Protobuf was used to create a small protocol for controlling lights. Currently, only ON/OFF and brightness commands for all lights is supported, but finer control would be straightforward to implement.

Network Sniffer
In this prototype, sniffing for network traffic was used to trigger the IoT-side, i.e. lights and curtains. For network sniffing, Scapy [6], a very powerful network sniffing, packet manipulation and dissecting tool, was used. With Scapy, the sniffer monitored network traffic, and when the sniffer detected relevant packets, lights and curtains were triggered. The sniffer created a Google Protobuf message to the IoT hub to trigger relevant actions.

In the demo, a UDP datagram stream to a Google Chromecast was used to trigger turning off lights and closing the curtains. When the stream ended, the sender does a HTTP GET request to port 8008, which was used to trigger turning the lights on and opening curtains.

Integration
To make things slightly simpler, most of the components are either running on the AP laptop or are connected through network. The laptop acts as a home gateway, i.e. acts as a NAT device and runs DHCP server. On the laptop, the IoT hub, bridge controller and the sniffer are running. The curtain controller is  running on the Edison, which in turn is connected to the laptop with WLAN.  The Hue bridge is connected to the laptop via Ethernet cable.

Since all relevant communications are IP based, the components could be spread around the network. The only device bound pieces are the curtain controller and the network sniffer. Curtain controller has to run on the Edison to drive the motor, while the sniffer has to see relevant traffic. Of course, multiple sniffers and curtains can be added to the system.

Problems and Future Work
Surprisingly few problems arose during the course. Some, such as elastic drive band slipping from wheel opening and closing the curtains would be trivial to fix, but others are not so easy to fix.

The heuristics used by the network sniffer are currently trivial, mainly matching packet headers and payloads to predefined rules. While relatively straightforward to get basic funtionality, more fine grained detection and reactions need more work.

The main unsolved problem is the crashing of Intel Edison. When the Edison is connected to main powers with charger, the Edison will crash with quite large probability when driving the 5V motor. If the Edison is also connected to a laptop through USB (only charging), the crashes will not happen. One likely reason is voltage fluctuation, but that is hard to prove.

As with many other IoT platforms, this platform currently suffers from the lack of authentication in the protocols and messages. But, unlike other networks, a straightforward way to mitigate this is the network setup. All network components, i.e. the controller, Hue Bridge and Edison are isolated in their own network and IP address space. Other devices can at best see WPA2 encrypted WiFi traffic and packets are not routed between IP address spaces.

Code is available at: https://github.com/shatonen/eg16

[1] http://www.thekelleys.org.uk/dnsmasq/doc.html
[2] https://w1.fi/hostapd/
[3] https://github.com/intel-iot-devkit/mraa
[4] https://github.com/studioimaginaire/phue
[5] https://developers.google.com/protocol-buffers/
[6] http://www.secdev.org/projects/scapy/

The Pigeon Handler

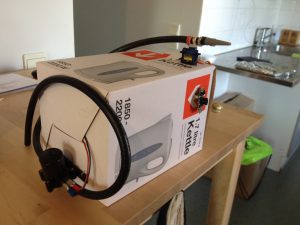
From the land of the Angry Birds, now you can get a whole new level of entertainment by making those birds angry yourself!! If being the good guy of the story does not go with you then join the dark (and fun) part of the story.

IMG_0269

This prototype aims to scare unwanted pigeons on the rooftop of Kumpula Kampus. The main idea emerged from being wondering what I could do to help the plants from my family garden. Initially, I thought of a common problem we had in the front yard where it is common that random dogs goes to the garden and pee on the grass or plants we own. Thus, I thought that spraying water every time they come close might scare them and keep the garden safe from unwanted visitors. At the same time, I was searching for other ideas, one of them involved trapping small animals or taking pictures of them which sounded interesting but, not convincing enough. After a small talk and many jokes about the project, Samu Varjonen mentioned that trapping animals could be interesting since they have a problem with pigeons on the rooftop of the campus.

This talk lead to the creation of this fast summer project but, many small details were missing yet. Trapping pigeons might not be the best way to get rid of them, or at least it sounds like a heartless option, thus spraying water on them to scare them could be a potential option … as long as they do not start taking summer showers up there. I started to find projects that might be doing something similar. I found a project using Arduino and a motion detector to shots water at a random direction once the sensor detects movement. This project brought an important piece of information to this summer project, using a windshield water pump to not only spray water but aim to the target. You can see this project here.

Now with a more concrete idea and the previously mentioned project in mind, I wanted to extend it. Since I had no motion detectors at hand and I was in a hurry to start, I decided to use a camera which I was able to use not only for detecting motion but approximate the location of the target. Therefore, creating the final prototype for this summer project.

Prototyping

Requirements

The software and hardware required for the project includes:

  • Raspberry Pi 2 with Raspbian
  • A camera
  • OpenCV library for the camera
  • Windshield water pump
  • Servo motor
  • Diode
  • TIP122 Transistor
  • Two 1k Resistors
  • Power supply for the motor, in this case a small laptop charger (12v – 3 amp)

Extra (Not used but could be easily extended)

  • 2k resistor
  • Extra 1k resistor
  • URM37 ultrasonic sensor

Development

First, we have to install OpenCV on the Raspberry Pi. There are some tutorial available online in how to do it. The original library page is can be found here and one of the tutorials I considered really useful can be found here.

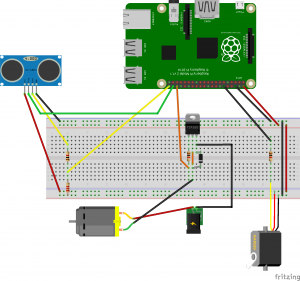
Second, we have to plug all the hardware. The following diagram contains 3 out of the 4 basic parts for creating this project. On the right side is the servo motor, which was directly plugged to the Raspberry Pi and contains only an input signal which modulates the direction. On the middle is located the control for the pump, in this project the power supply was a small laptop charger which Samu helped me to build. The left side, which is not included in the code of the project but I think that it can be easily extended is the sonic sensor, expected for avoiding shooting at far objectives and improve aiming accuracy. This feature was emulated here using the camera and will be explained in the following paragraphs. The fourth part is the camera but, in this case I plugged via USB and therefore it is not included in the diagram.

Greenhouse_bb

Once we have installed OpenCV, we can use the library for creating a motion detection system. In a nutshell, the system first have to chose a background image. In order to avoid problems with the first frames received and approximating the background image, the code read continuous frames in gray scale, smooth them using Gaussian blur and calculate the mean of squared error until a sequence has a similar value. This calibration only happens at the beginning of the program but, I think this should be calculated once in a while in order to adapt to small changes in the environment. Once it is calibrated, the system keeps reading frames and calculating the absolute difference. The difference can be used as motion detection since they are changes in the background but, in order to avoid noise and not significant changes, only the biggest change is taken into account and it has to go beyond an empirical threshold in order to be considered as movement. The movement is enclosed into a circle using the library and based on the location on the screen and the size of the circle we can approximate the position to aim for and a naive distance to the target.

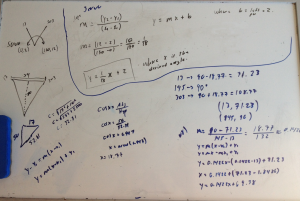
The position of the servo with respect to the location of the movement in the frame is approximated using basic algebra. I measured the width of the camera vision at some given distance. Thus, we have a triangle with two known values which were used to calculate the angle of aperture. Hence, this angle can be given to the servo for aiming to our target.

In a similar fashion we can calculate the required duty cycle for each angle. For instance, we can easily obtain the values that give the rightmost and leftmost positions for the servo and then calculate the rest using those values.

Untitled

Finally, for the pump we only require to send a high signal to the GPIO in order to shot, and return it back to low after some given time. Therefore, completing the required code and completing the system.

The source code can be found here.

Eventualities

During the development I experienced some small eventualities that delayed the development and I would add here as warnings since some of them might be crucial. First, beware of the power supply you are using for the Raspberry Pi since it was the cause of many of my problems that showed as random errors or low performance in the best of the cases. Second, beware of the use and abuse of threads in the Raspberry Pi. Threads can increase performance in many cases but the Raspberry Pi has its limits thus, decide what would help the system if running on threads. In this project I only left the frame capturing part in a thread but only the capturing part since adding some calculations on the same thread stuck completely the system. Finally, while applying divide and conquer with the different tasks works great for developing and testing, keep in mind that the Raspberry Pi would have some problems once everything is running at the same time due to its limited power. This last eventuality made me rework half of the code in order to improve its performance.

Testing

Demo

Author

Angel Gallegos

Internet of Things: Le Farmanator

I know exactly how lazy you are. That’s why Farmanator was brought into this world.
You wake up in the morning and couldn’t care less about your plants. “Let them die” you think the moment you realise how soft your pillow is today.
But then you remember… Le Farmanator. You pull out your laptop from underneath your pillow and open it up. Air temperature, humidity, loudness and light levels – it’s all there, it’s all good. And you may sleep another day knowing the winter didn’t come quite yet.
Also no need to worry about remembering to check the data out on a daily basis. It’s stored to Firebase and you can view it for up to 30 days.


Hardware

Temperature & Humidity sensor pro v1.1
Loudness sensor v0.9b
Digital Light sensor v1.1
Arduino Uno
Base Shield
USB-power-cable


Wiring

Base Shield is attached to the Arduino Uno.
Temperature & Humidity sensor goes to A0 on the Base Shield.
Loudness sensor goes to A1 on the Base Shield.
Digital Light sensor goes to 12C on the Base Shield.
Arduino Uno is connected to the PC with a USB-cable.


Software

Code running on Arduino Uno:
https://github.com/jviding/GreenArduino

Code for reading data from Arduino Uno and managing Firebase:
https://github.com/jviding/GreenBack

Code for the webapp representing data from Firebase:
https://github.com/jviding/GreenFront

Check out the Readmes for more details about software.


How to use

Prepare all the software by following up the instructions written on the projects’ github pages.
Start by deploying or running locally the webapp, GreenFront. It might be a good idea to run it locally before deploying by just typing “grunt serve” in the root of the project directory.
Then push GreenArduino source code to your Arduino Uno after attaching the Arduino Uno to your computer with a USB-cable.
Now you may start executing GreenBack on your computer. After a while you should start seeing data appearing to your charts on GreenFront.


In case no data is appearing to the charts on your GreenFront webapp check Firebase if anything is getting stored there. In case Firebase remains empty still after 10 minutes it is likely your computer is not able to read the values from Arduino Uno. This might be due to that your serial port is wrong – check GreenBack for more info to solve this problem.


Problems encountered

  1. Problem, with Arduino Uno’s sensors

One of the main problems with Arduino Uno was to read the sensor data and send it out without any data losses. For example the Digital Light sensor is rather slow which had to be taken into account when handling the results.
As it might take even up to 0.5 seconds to get the readings from the Digital Light sensor the code had to be written so that the value was requested long enough before it was needed. The way-around for the problem was to request the new readings immediately after using the current readings so that after 0.5 seconds when we want to use the new digital light value we have had the whole 0.5 seconds for the sensor to use.

  1. Problem, reading data from Arduino Uno

Another problem was that if too much data was sent too fast to the PC we started to suffer of data losses because the PC needed more processing time.
The problem was solved by timing the outputs so that there was always a short delay between each print of a value. Now the PC could handle the data safely before receiving already a new value.

  1. Problem, flooding Firebase

Storing values to Firebase every 2 minutes would drown us in data already in one week.
The problem was solved by compressing the data from each full day to 4 data events: average of morning, average of day, average of evening and average of night. Now instead of 24*30 data events for example for Loudness for one day we instead have 4 data events. This lightens up the burden on Firebase quite a lot as the amount of data stored is minimized.
Furthermore we could improve our solution by maybe deleting all data events older than 30 days or by after a week compressing even the 4 data events from a day to only into a 1 data event.


Testing

While working on the project Arduino Uno was almost constantly running. In some cases it ran even a few days without interrupts.
The web app then was a good way to view how our data was getting gathered. Also a look on Firebase gave us a good perspective on how our solutions were working. And in some cases thanks to this method some bugs got noticed and fixed on time.


Project members

Jasu Viding

RGB UV Smart Garden

green

The team:

Santeri, Miro and Joe

How did we end up doing this?

We all wanted some automated system to follow and manage our plants, even from another country. So we brainstormed some ideas, first we thought about automated watering, playing around with different setups of lights and water to find the optimal way of growing a certain plant. Then we narrowed it a little down, following the plants well being was enough, the watering part if wanted could be made with a pump of some sort.

And we all love of course a… plant disko!

howdidwe

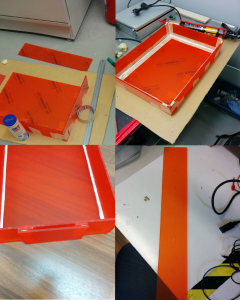
Plastic parts

First every piece of plastic was cut, then taped together and finally glued with silicon. Silicon that we used required 48 hours of cooling down.

plastic

Electronics & Code

Everything is controlled through Raspberry PI running Raspbian. Code can be found here.

The main idea of the project is to follow the light sensor (and maybe also temperature sensor) to control the 3 rows of LEDs in the ‘top part’.


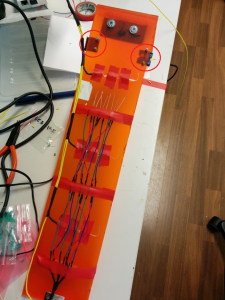
The sensors

Sensors used:

  • A temperature sensor
  • A light sensor

sensors

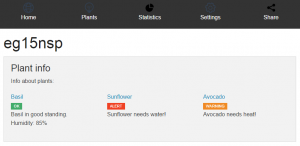
There are 2 sensors attached, light sensor and temperature as shown in the picture. The more important of them is the light sensor, which sends data to raspi from where the polled sensor data is sent to a cloud storage and from there to an SQL database through the filters. This data is displayed on the web UI.


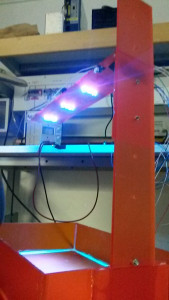
The lights

Components used for this:

  • 9x Green leds
  • 9x Blue leds
  • 9x Red leds
  • 9x UV leds

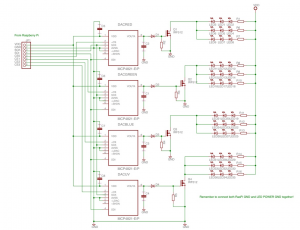
The leds are controlled through the Raspi. The raspberry PI is connected to a Digital To Analog converter where the voltage out is connected to a transistor. The lights are high intensity leds, so we used a external power supply (12V) for them, and for this reason we had to use mosfets between the leds and the raspi.

rgbu

ultraviolet

UI

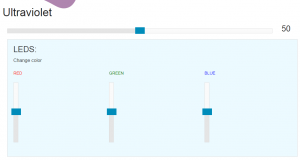
From the UI it is possible to control the lights, ex. if a plant needs more light in the evening you can turn the light level up with your phone.

UI

Backend

The backend was made with Node.js express. It had a simple API for sensor values and color control. Idea of the backend was to poll the SQL database running in cloud service, and to provide API for the UI for easy data handling.


The circuitry

circuitry

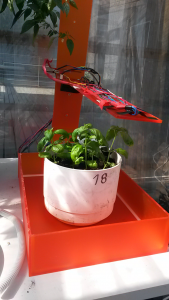
Finished Product

final

RIP list

  • one Rasperry PI
  • 2 DAC
  • 4 LED (2uv & 2 green)

Source code: https://github.com/Divinare/eg15nsp

Internet of Things: Exactum Greenhouse – SmartGreen

Group members and responsibilities

Aleksi Toivanen (Frontend dashboard)
Juhani Jaakkola (Arduino device, backend server and 3D printed cover)

Overview

A device for measuring temperature and relative air humidity. It measures and sends the data to the backend server every 5 minutes. One aim of the project was to make a small affordable device which could be placed to almost anywhere. Parts ordered from Ebay cost about 5,50€ per device (excluding jumper cables, 3D printed box and USB charger).

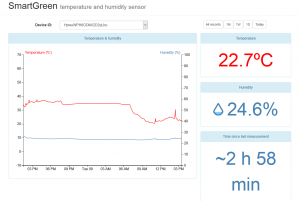
Data is displayed on a dashboard web page which allows the user to follow changes and latest measurements from the device easily. All devices send a device identifier with the data so users can have multiple devices measuring at different locations.

Backend is running in Heroku (PaaS) platform and data is stored to MongoDB (MongoLab).

HARDWARE (2 devices)

2x AM2302/DHT22 (digital temperature and relative humidity sensor)
2x Arduino Pro mini V3.3
2x ESP 8266 – ESP-01 (wifi module)
2x 5V to 3.3V DC-DC Power Supply Module AMS1117 LDO 800MA

3D PRINTED PARTS (TinkerCad links included)

2x Device box and cover

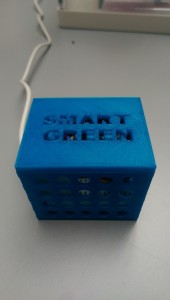
3D printed box

Schematics

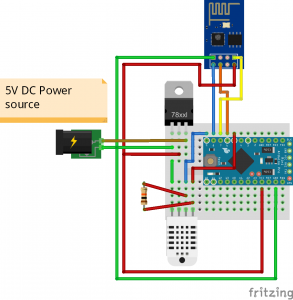
The voltage regulator in the diagram should be a 3-pin low-dropout regulator (5V to 3.3V) with a couple of condensators. In the project we used regulator modules that include these, but unfortunately this module is not available in Fritzing libraries.

scematics

Dashboard

dashboardDevice

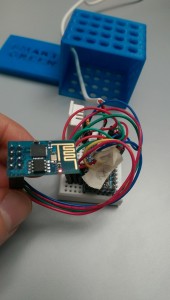
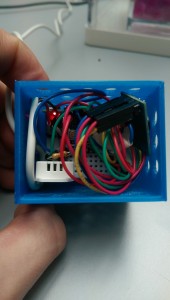
The parts are put together on a small breadboard which is just enough for the few parts used in this project.

small bread boardbread board inside the box

The hardest part of building the device was creating a proper HTTP request using an ESP 8266 wifi module. The module communicates with AT commands which are printed to a serial connection.  AT+CIPSEND’s command value must be exactly the amount of characters in the request. Also the content length value must be correct so that the request is valid.

    // CIPSEND value and Content-Length in the request must be correct!
    espStr_P(PSTR("AT+CIPSEND=208\r\n"));
    if (waitForString(ESP_START, ESP_NONE, DEFAULT_TIMEOUT) == ACT) {

      // Building POST Request
      espStr_P(PSTR("POST /api/data HTTP/1.1\r\n"));
      espStr_P(PSTR("Host: murmuring-bayou-3294.herokuapp.com\r\n"));
      espStr_P(PSTR("Connection: close\r\n"));
      espStr_P(PSTR("Content-Type: application/json\r\n"));
      espStr_P(PSTR("Content-Length: 68\r\n\r\n"));

      // Building POST Request body
      espStr_P(PSTR("{\"did\":\""));
      espStr_P(PSTR(DID));
      espStr_P(PSTR("\",\"tem\":"));

      char value[6];
      espStr(dtostrf(MEASUREMENT[0], 5, 2, value)); // Insert temperature
      espStr_P(PSTR(",\"hum\":"));
      espStr(dtostrf(MEASUREMENT[1], 5, 2, value)); // Insert humidity
      espStr_P(PSTR(",\"hin\":"));
      espStr(dtostrf(MEASUREMENT[2], 5, 2, value)); // Insert heat index
      espStr_P(PSTR("}\r\n"));

      if(waitForString(ESP_SAVED, ESP_NONE, DEFAULT_TIMEOUT) == ACT) { // 'SAVED'
        DEBUG_PRINTLN(F("\r\nSend successfully"));
      } else {
        DEBUG_PRINTLN(F("\r\nSend failed"));
      }
}

Testing

During the development the device run three weeks successfully. During this time all the measurements were received by the backend server.

Source code

Github: https://github.com/nullbox/SmartGreen,

Internet of Things: Raspberry Garden

Raspberry Pi based automated greenhouse monitoring and watering system

Introduction

Our original goal with this project was to build an environment where you could leave your plant unattended for weeks at a time. Environment should report the condition of the attached plant, surrounding environment and amount of water left in tank. It should also be able to water the plant automatically based on humidity threshold levels defined. As you’ll see, this last part was not yet achieved.

IMAG0609

IMAG0610 IMAG0614

Hardware

We use Raspberry Pi with Raspbian as a central piece of the system. Main reasons for this is a wide range of on-board connectors, and flexible, well supported Linux operating system with Node.js support.

Logitech webcam for posting photos to Twitter

This is just as simple as connecting it to USB port and installing fswebcam.

Humidity and temperature

Measure and temperature are measured from both soil and air. Both sensors are manufactured by Sensirion, for soil measurements we use SHT10 in a metal casing, for air measurements SHT15.
There’s supposed to be a huge variation in durability of soil moisture sensors, and SHT10 seems to perform very well. It needs one 10k resistor from data to 3.3V, as seen in wiring diagram. SHT15 is connected straight to RPi.

IMAG0569

Water level

Water level is measured with ultrasonic sensor connected inside the roof of the water tank. We use DFRobot URM37 sensor. It requires two resistors connected to TX connector: 1k between TX and RPi’s RX, 2k between 1k and ground.

Water flow

Solenoid is used for controlling water flow. It needs a separate 12V power supply to work. Only a trigger signal is sent from Raspberry Pi. There’s a 400R resistor between GPIO and transistor base. Transistor is NPN transistor 2N3904, diode is 1N4001.

This part requires experimenting, as we couldn’t get stable output from our solenoid before the project deadline. The part was most likely broken as it worked out fine when dry, but stopped after water was put through it.

IMAG0617

Software

Frontend

Frontend uses AngularJS with Highcharts to visualize the data. It’s a single page application which we host in Firebase, the same place we store in and read our data from.

There’s a Github repository and Firebase hosting guide to get it all running.

In order to show the saved data, you have to enable certain measurement types. The data is drawn based on sensors object, which lives in your database.
There’s a chart drawn for every child of sensors, and there’s a value drawn for every child of sensors/sensorname/measures. Here’s an example that draws humidity and temperature of air sensor:

“sensors” : {
  “air-temperature-and-humidity” : {
    “measures” : {
      “humidity” : {
        “unit” : “%”
      },
      “temperature” : {
        “unit” : “C”
      }
    }
  }
}

Units are only saved for clarification at the moment.

Next steps with the frontend would be to refactor the code to support data binding, and to improve the performance by limiting number of fetched data points.

Backend

The backend is written using NodeJS and is run as a Forever service. The complete backend code is found in the Github repository. For the SHT1x based sensors (air and soil moisture and temperature) a modified library based on Keitos where support for multiple sensors were added was used. At the current state the sensor data is read periodically and posted to the Firebase service. Also a webcam image is captured and posted to Twitter as a media tweet. However, the solenoid valve is not triggered automatically. One of the reasons for lack of this support is that the valve we had did not work well enough for us to test enough. The next step would be to build a support for this.

IMAG0601

Casing

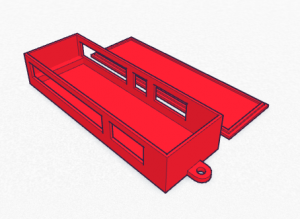
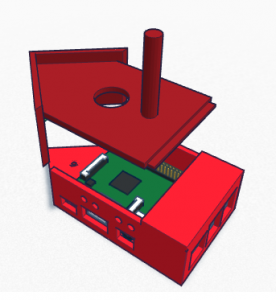
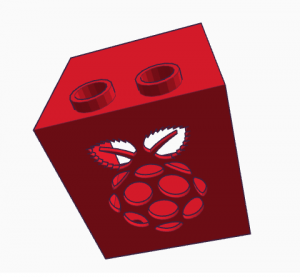
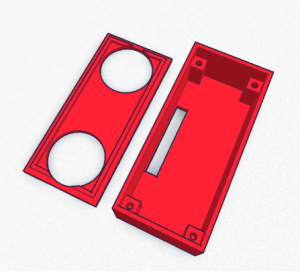
The casing for the device is designed using the lovely Tinkercad and 3D printed using the MakerBot Replicator 2. Casings were designed for the Raspberry Pi B+, sensor connector PCB, URM37 and solenoid valve. We noticed that the appearance of the complete setup with all the wires going from the main unit to the sensors through the connector unit is quite messy. The design could be improved by either using wireless sensors or designing both the main unit and the connector board in a single unit.

IMAG0607

The designs are available in Tinkercad

casing-connector-board casing-raspberry-pi casing-solenoid-valve casing-urm37

Team

  • Antti Laakso (backend, sensors, 3D design)
  • Antti Suniala (frontend, PCB design, soldering)