by Liisa Lado-Villar

Figure 1, Browser view of watched plant.
Monitor you plant remotely with browser, watch webcam image and observe temperature and humidity graph.
Decoctus is the name for this small system that helps to grow a plant. With help of a sensors the plant can be monitored remotely and watched its well-being. The core of this system is Raspberry Pi microcomputer. It controls SHT10 humidity & temperature sensor and a webcam, additionally it hosts a Node.js web server and acts as storage for collected data. A web browser is used to show the sensor data in graph form and and the latest photograph of the plant.
Hardware
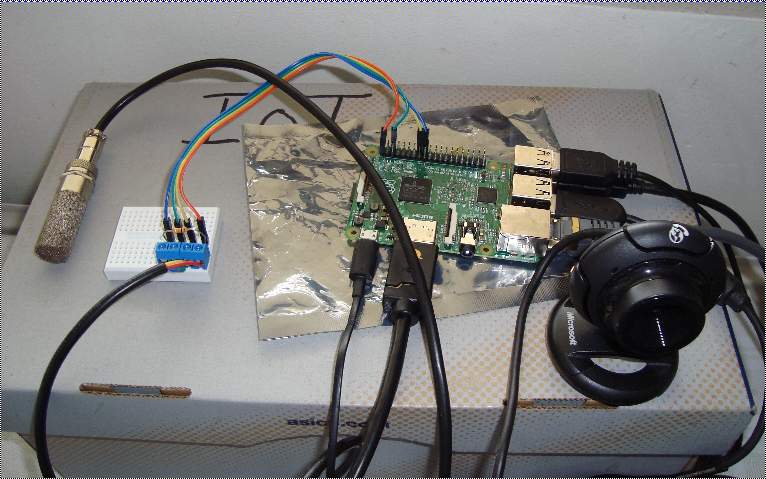
Figure 2, the used hardware on top of a shoebox
For monitoring environment of the watched plant SHT10 temperature and humidity sensor is coupled to Rasberry Pi 2 GPIO pins. The pi-sht1x library of Keito extracts data from the sensor and converts to human readable form, into Celsius degrees and relative humidity percentage.
Wiring
About wiring the SHT10, take a look of figure 3. From sensor wires go through a breadboard to enable power and data wires to pass 10K resistor. Green wire is ground and it is coupled to a GPIO ground port, here third down from the right. Blue is the data line used for readings, coupled to ninth at right row, physical port number 18 or GPIO 24. Above it is the yellow clock wire at port port 16, that is GPIO 23. And the fourth red power wire is first in left 3,3V port 1 or GPIO 01.
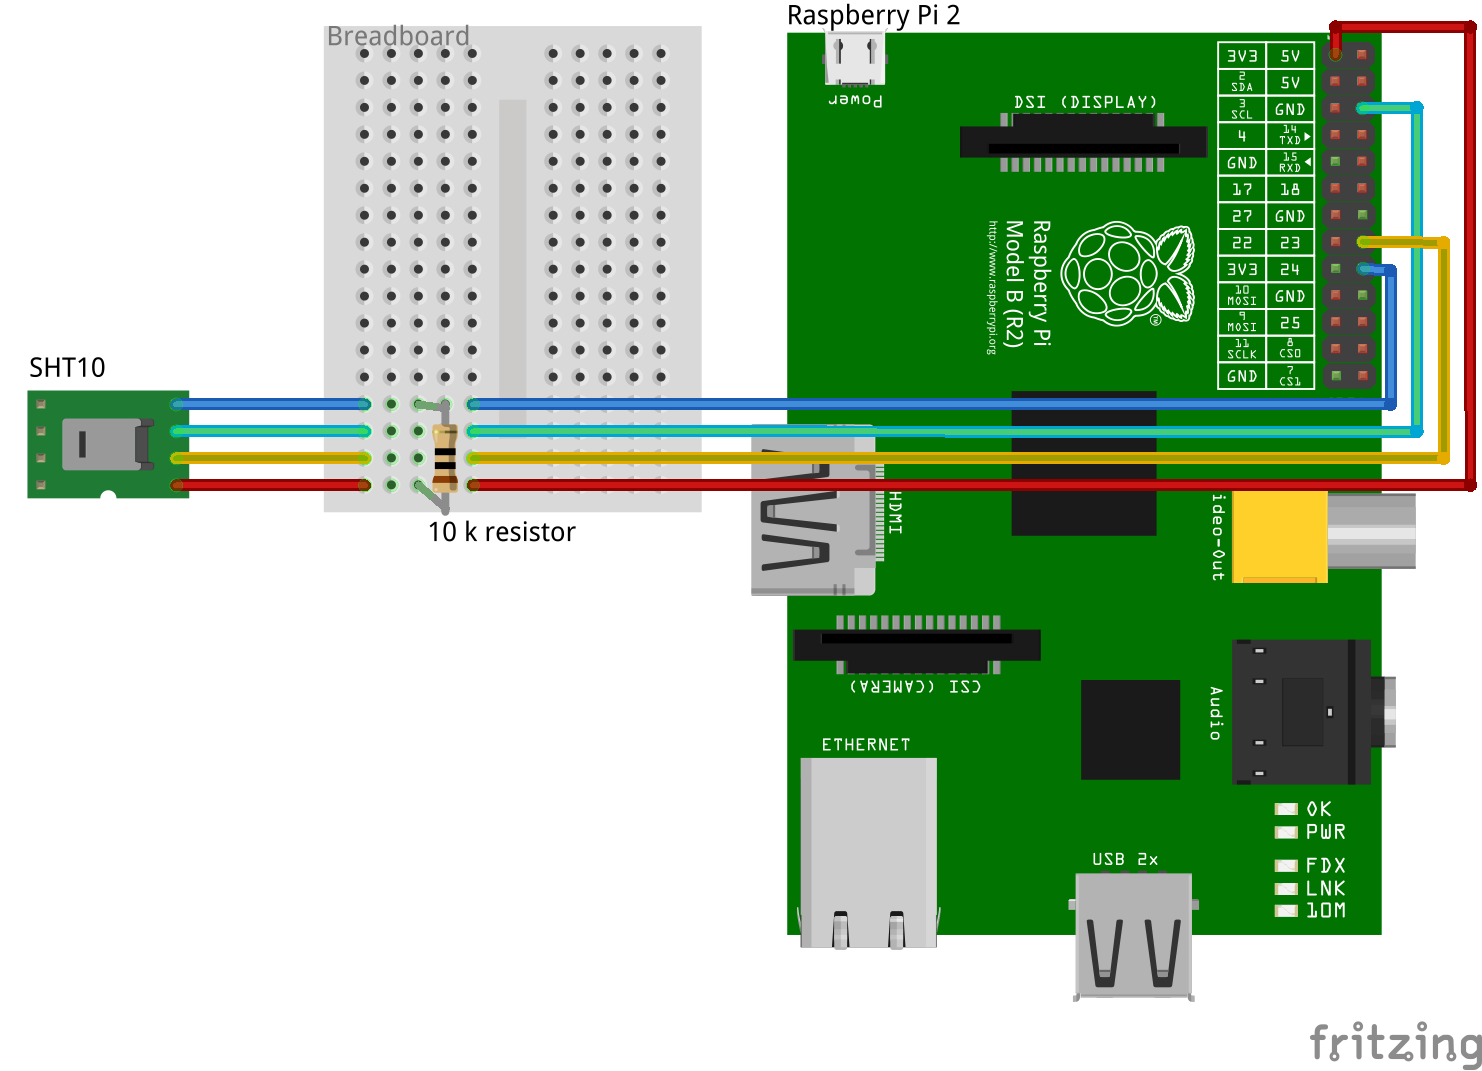
Figure 3, sensor wiring though a breadboard to GPIO pins.
Wiring is used and data fetched with help of Keito’s JavaScript library and here follows the whole Node.js code that saves data to csv file called decdata.csv.
Sensor data collecting
fs = require('fs');

var async = require('async');

var sht10 = require('./js/pi-sht1x')
datapath = 'decoctus/julkinen/data';

filename = 'decdata.csv';

HEADERLINE = 'Time Temperature Humidity Dewpoint\n';

dataline = '';
//read sensor data

async.series([

sht10.init,

sht10.reset,

function(callback) {

sht10.getSensorValues(function(error, values) {

dataline = dataline + Math.floor(Date.now() /1000); //Timestamp from milliseconds to seconds.

dataline = dataline + '\t' + values.temperature + '\t' +values.humidity + '\t'+ values.dewpoint + '\n';

writesensordata();

callback(error);

});

}

], function(error) {

sht10.shutdown();

if (error) {

console.error(error);

}

});
function writesensordata(callback)

{

//Write sensor data to given file

fs.access(datapath + '/' + filename, fs.F_OK, function(err) {

if (err) {

var datafile = fs.appendFile(datapath + '/' + filename, HEADERLINE, (err) => {

if (err) throw err;

else console.log('A new data file was created with headers.');

});

}
var datafile = fs.appendFile(datapath + '/' + filename, dataline, (err) => {

if (err) throw err;

console.log('New sensor data was appended to '+ filename + ' file.');

});

});

}
Shooting images
For shooting pictures a Microsoft webcam with USB connector was plugged to one of Raspberry’s USB ports. For to use webcam fswebcam library was downloaded with sudo apt-get install fswebcam in Raspberry’s terminal. From command line you can shoot picture simply commanding fswebcam photo.jpg where captured image is saved in photo.jpg file. With on option it is possible to give configuration file for commad, to keep the command reasonable short. Here is used configuration file:
$cat webcam.conf
device /dev/video0 #only one camera here
delay 1
skip 20 # Take 20 frames before saving for sharper image
jpeg 80
#resolution 1600x896 #max is 640x480
resolution 640x480
no-banner #Leave comments out from saved image
set "White Balance Temperature, Auto"=False
set "White Balance Temperature"=5000
set "Focus, Auto"=False
set "Focus (absolute)"=52
set "Exposure, Auto"=False
set "Exposure (absolute)"=215
set "Gain"=1
#set "Sharpness"=240 #Did not sharpen the image
#set "Contrast"=40 # Neither did this help for better quality
frames 1
Raspbery Pi
The used controller is Raspberry Pi 2 Model B, installed with Raspbian Jessie operating system.
Software Backend
In server, here is the same Raspberry again, there are two server processes, continuous web server and hourly executing data collection process. The web server is implemented with Node.js tuuttuut.js code as well as SHT10 sensor data saving with sensordata.js program. Data saving is initiated with Cron through keraa.sh bash script.
Decoctus directory structure
Because there is not used any web softaware framework here is also part of systems directory structure.
decoctus/

├── julkinen

│ ├── css

│ ├── data

│ └── kuvat

└── skriptit

├── js

└── node_modules

├── async

│ ├── dist

│ ├── internal

│ └── node_modules

│ └── lodash

│ └── fp

├── gyp
…
├── onoff
…
├── opencv
├── pi-gpio
│ └── test
Linux timer Cron
*nix timer Cron is used to schedule to run image shooting and sensor data collecting. */04 * * * * NODE_PATH=/usr/lib/nodejs:/usr/lib/node_modules:/usr/share/javascript PATH=/usr/local/sbin:/usr/local/bin:/usr/sbin:/usr/bin:/sbin:/bin:/usr/local/games:/usr/games /usr/bin/node /home/pi/decoctus/skriptit/sensordata.js Runs every fourth minute the sensordata.js script, for test purposes. In Decoctus system it is used to run keraa.sh script once in an hour.
# m h  dom mon dow   command

0 * * * * /home/pi/decoctus/skriptit/keraa.sh
Bash script
And keraa.js launch senor data collecting, webcam shooting and plotting of newest sensor data grap with gnuplot.
#!/bin/bash

DATESTMP=`date +"%d%m%Y%H%M"`

PATHBASE="/home/pi/decoctus/"

FILECONFIG="webcam.conf"

PATHSKRIPTI="skriptit/"

PATHDATA="julkinen/data/"

PATHKUVAT="julkinen/kuvat/"

FILEDATA="decdata.csv"

FILEKUVA=$PATHBASE$PATHKUVAT"kuva"$DATESTMP".jpg"

CONF=$PATHBASE$FILECONFIG
#does not run the node script from cron without giving paths, here right one should be just added.

CURDIR=`pwd`

cd $PATHBASE

#Get older photo for comparing shapes or edges of a plant

#KUVACOMP=`ls -t julkinen/kuvat/kuva*.jpg | head -16 | tail -1`

#cp $KUVACOMP julkinen/kuvat/kuva_comp.jpg

mv julkinen/kuvat/kuva.jpg julkinen/kuvat/kuva_prev.jpg

#And fetch data from sensor sht10.

NODE_PATH=/usr/lib/nodejs:/usr/lib/node_modules:/usr/share/javascript

PATH=/usr/local/sbin:/usr/local/bin:/usr/sbin:/usr/bin:/sbin:/bin:/usr/local/games:/usr/games

node /home/pi/decoctus/skriptit/sensordata.js

gnuplot skriptit/gnuplottext

cd $PATHSKRIPTI

#Take the photograph

fswebcam --config $CONF $FILEKUVA

cd ../$PATHKUVAT

VIKAKUVA=`ls -t | head -1`

cp $VIKAKUVA kuva.jpg

#Get older photo for comparing shapes or edges of a plant #Does not work from cron

KUVAV=`ls -t1 | head -16 | tail -1`

cp $KUVAV kuva_comp.jpg

cd $CURDIR
Nodejs web server
For Node.js server tuuttuut.js to serve a html file, images and text for AJAX text, following code is used.
var http = require("http");

var fs = require('fs');

var url = require('url');

var path = require('path');

var exec = require('child_process').exec;
var sensordata = '?';

var basedir = 'julkinen';
mimetypes = {
“.html” : “text/html”,
“.css” : “text/css”,
“.png” : “image/png”,
“.jpg” : “image/jpg”,
}
//First getdata returns empty line????

function getdata(){

exec('tail -1 julkinen/data/decdata.csv', function(error, stdout, stderr){

if (error) {

console.error('exec error: ' + error);

sensordata = 'Data retrieving error: ' + error;

}

else {

sensordata = stdout;

}

});

}

/**

*

*/

http.createServer(function (request, response) {

function serveitem(mimetype, requestfile) {

response.writeHead(200, {'Content-Type': mimetypes[mimetype]});

if (requestfile=='/') {

requestfile='index.html';

}

var ofile = fs.readFileSync(basedir + '/' + requestfile)

response.end(ofile);

}
try {
var requrl = url.parse(request.url, true); //true for query property
var reqfile = requrl.pathname;
var ext = path.extname(reqfile);
if (ext==”) {
ext = ‘.html’;
}
console.log(‘MENOSSA ‘ + reqfile);
if (reqfile==’/decline’) {
getdata();
response.writeHead(200, {‘Content-Type’: ‘text/plain’});
response.end(sensordata);
} else {
serveitem(ext,reqfile);
}
} catch(e) {
response.writeHead(500);
response.end();
console.log(e.stack);
}
}).listen(8013);
console.log(‘Server running at http://*.*.*.17:8013/’);
Software Frontend

Figure 4, The system fetches also latest sensor values
In figure 4, it is possible to see the parts of system web page. There is the latest, at most an hour ago grabbed photo of the watched plant, the graph plottet when the photo an sensor value was taken and a button to get the last sensor readings. Colour ofreading s are red if beforehand given limits are passed. In the system here is index.html page from where next AJAX code is taken.
Index.html
function getsdata() {

var areq = new XMLHttpRequest();

var datal;

var datadate;

areq.open("GET", "http://192.168.0.17:8013/decline", true);

areq.onreadystatechange = function() {

if (areq.readyState == 4 && areq.status == 200) {

datal=areq.responseText;

datal = datal.split('\t');

datadate = new Date(datal[0]*1000).toLocaleString();

var datatemp = datal[1];

if (datatemp<15) {

datatemp = '' + datatemp + '';

}

var datahum = datal[2];

if (datahum < 90) {

datahum = '' + datahum + '';

}

var nicedataline = 'On ' + datadate + ' the monitored temperature was: ' + datatemp + '° Celsius and the humidity was: ' + datahum + '% and the dew point was: ' + datal[3]+ '°C.';
document.getElementById(“dataline”).innerHTML = nicedataline;
}
};
areq.send();
}
/
Coming next
Maybe there is too much on Raspberry, web server data collection and data. And everything without any backup, first development need is to take backups. Later maybe copy whole image to cloud and separate data storage. Next change AJAX to some library that allows server push data, then draw the graph on canvas whenever data has been updated. Then add to the keraa.sh script deleting jpg files, just leaving weekly samples maybe.
Gnuplot script
Here is also gnuplot script.
$ cat skriptit/gnuplottext

set terminal png size 720,540

set output 'julkinen/decraph.png'

set xdata time

set ylabel "Temperature C"

set y2label "Humidity %" offset 0,10

set yrange [0:50]

set y2range [0:100]

set y2tics 10

set timefmt '%s'

set key left top title " "

set key autotitle columnhead

plot 'julkinen/data/decdata.csv' using 1:2 axes x1y1 title 'Temperature' with lines, 'julkinen/data/decdata.csv' using 1:3 axes x1y2 title 'Humidity' with lines
OpenCV
For using computer vision to automatically detect transformation in a plant it is possible to use Node.js with openCV library. And start like in this code here.
var cv = require('opencv');

const inpath = 'julkinen/kuvat/'

var area1, area2;
inputimage1 = inpath + ‘kuva.jpg’
inputimage2 = inpath + ‘kuva_comp.jpg’
cv.readImage(inputimage1, function(err, image1){
if (err) {
console.log(err);
}
else {
image1.convertGrayscale();
var contours1 = image1.findContours();
var area1 = contours1.area(0);
}
});
cv.readImage(inputimage2, function(err, image2){
if (err) {
console.log(err);
}
else {
image2.convertGrayscale();
var contours2 = image2.findContours();
var area2 = contours2.area(0);
}
});
if (area2 < area1)
console.log(‘Send alert.’);
else
console.log(‘Don’t worry.’);