Introduction
Hydroponics is a method of growing plants in nutrient solution without soil. Hydroponics is an efficient way of growing plants as nutrients are delivered directly to the roots in soluble form. It enables plants to allocate more resources to leaves, flowers and fruits.
We decided to create a small-scale hydroponics system with constant water flow. There are many such hydroponics systems commercially available, but we wanted to design our own. Our idea was to build a modular system consisting of a nutrient solution tank, a water pump and separate plant containers that could be connected to form a hydroponics system of 1 – 5 plants. Sensors attached to the system would measure temperature, humidity and lightness of the surroundings. Our initial plan also included measuring nitrate concentration of the nutrient solution and adjusting the amount of nutrients according to the measurements. However it turned out that nitrate sensors are expensive and difficult to get, so we gave up that part of the plan. Instead, we used a simple water sensor in the tank to detect when more water was needed.
Component overview
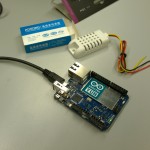
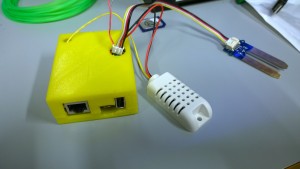
All our sensors were Grove system compatible which means that the sensors could be connected to a Grove Base Shield on top of an Arduino Uno microcontroller without tinkering. We used Grove Luminance Sensor to measure amount of light, Grove Temperature & Humidity Sensor Pro to measure temperature and relative humidity and Grove Water Sensor to detect when the tank was empty. For wireless networking, we used a separate Adafruit CC3000 Wifi Breakout plugged into the base shield. In addition to electronics we had a small Jebao AP-300 aquarium pump.
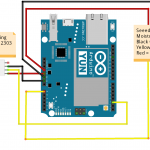
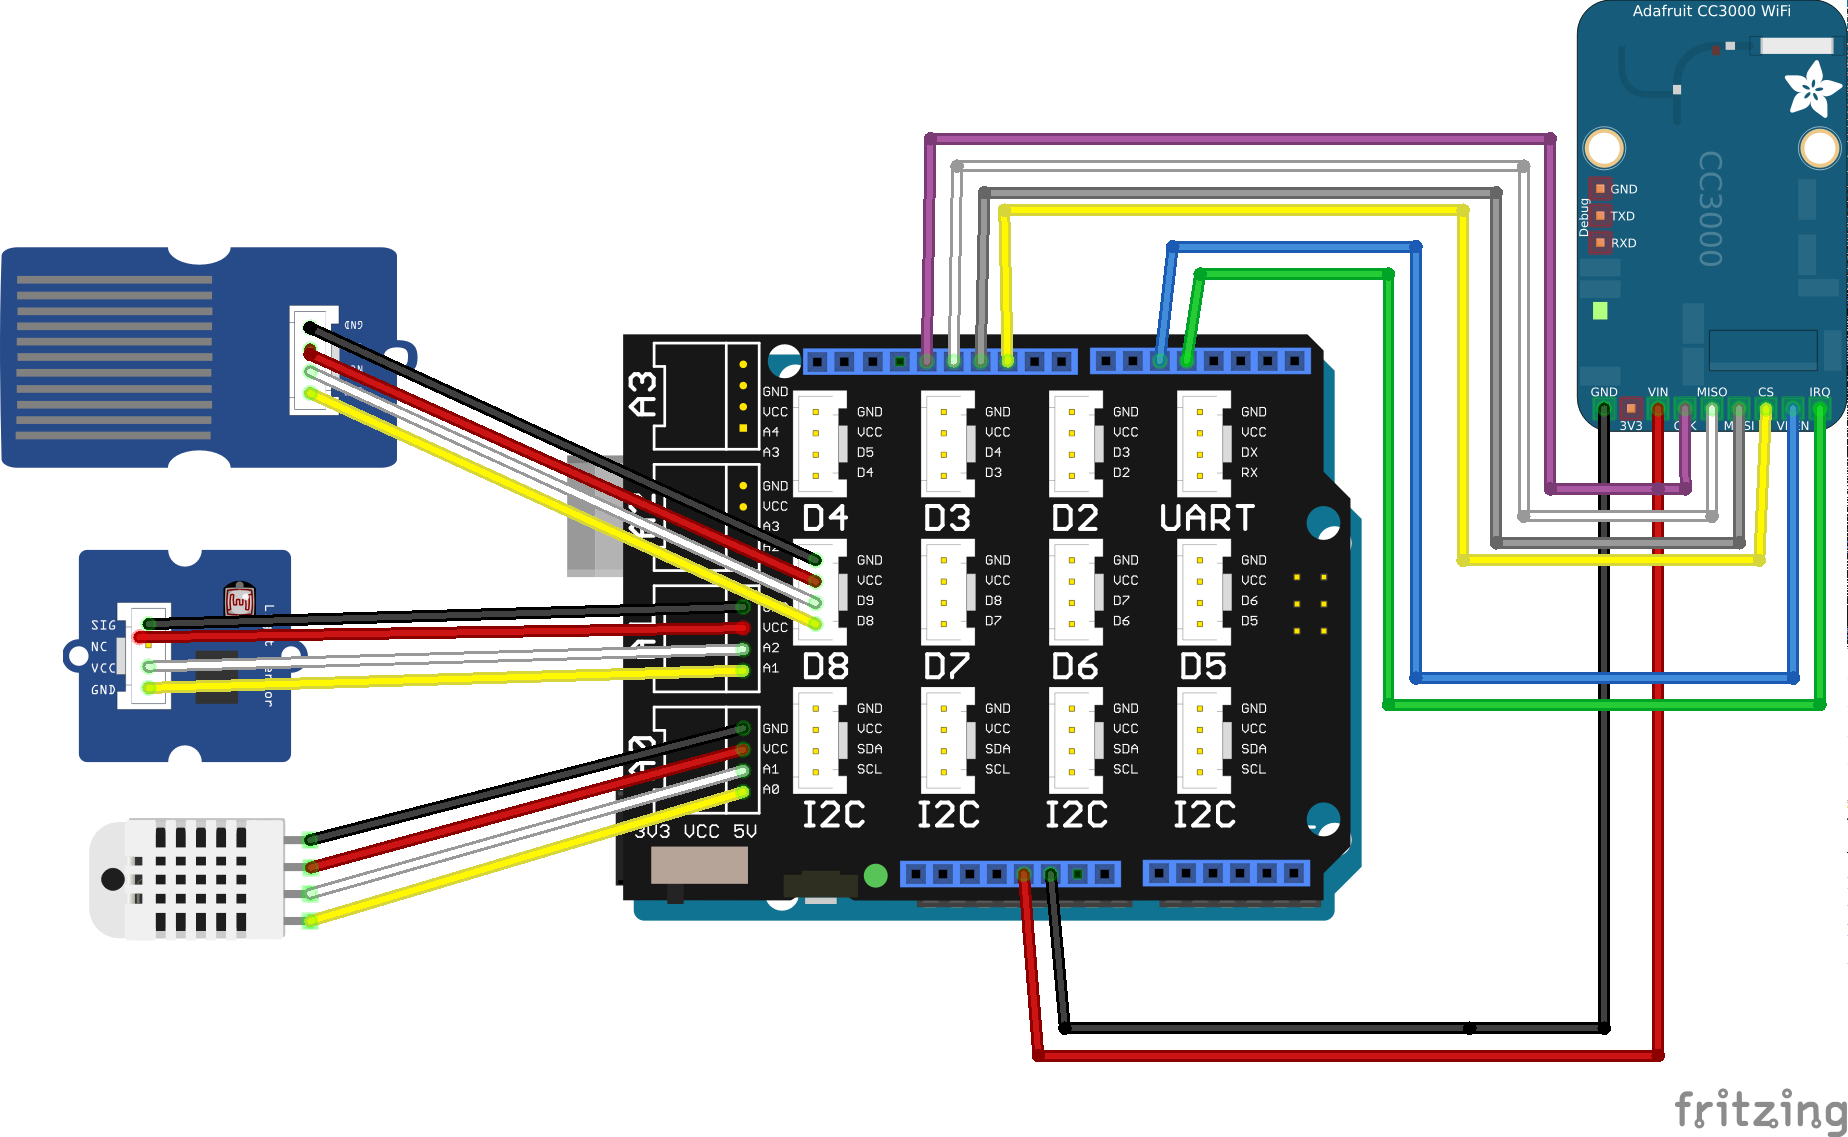 Wiring schema
Sensors and data collection
Grove Water Sensor detects presence of water by measuring conductivity between interlaced sensor traces connected to SIG/VCC pins and ground traces connected to GND pin. When the sensor is exposed to water, conductivity between sensor traces and ground traces increases and voltage value in SIG pin becomes low. Otherwise it is high. We connected the sensor to the base shield’s digital pin and used it as a simple water detector. The sensor could also be used to measure changes in electric conductivity of nutrient solution by connecting it to an analog pin.
Grove Luminance Sensor contains an APDS-9002 lumen sensor . It is a simple analog-output sensor that peaks approximately in wavelength range 400-650 nm. This is very close to the spectrum of human vision. With standard 3.3 V input current, the sensor outputs a value between 0 and 1023 which is converted to voltage by simple arithmetics: output voltage = 3.3 V * output value / 1023 . Voltage values above 2.3 V are inaccurate and mean that the sensor is saturated by light. The output voltage can be linearly transformed to a lux value.
Grove Temperature and Humidity Sensor Pro is a DHT22 sensor with a capacitive humidity sensor and a thermistor. It outputs a 40 bit digital signal consisting of a relative humidity component (8 bit integer + 8 bit decimal), a temperature component in Celsius degrees (8 bit integer + 8 bit decimal) and a checksum (8 bits). Getting data from the sensor requires carefully timed signal exchange between the sensor and the microcontroller. Data request starts by sending the sensor a low voltage signal followed by a high voltage signal and then waiting for a response from the sensor. This is called “handshaking”. The sensor then sends data in a sequence of low and high voltage signals. One bit consists of 50 ms low voltage signal followed by a high voltage signal. The value of of the bit (0 or 1) is determined by the length of the high voltage signal.
We did not need to implement the procedure described above as somebody else had already done it. We used DHTlib to control the sensor. Reading other sensors was straightforward and no external libraries were required.
Sensor data was collected every minute during the testing period and sent to the backend server in a HTTP POST request. We used Adafruit CC3000 library and code samples that came with it to set up the network connection. CC3000 module tended to get stuck when initializing the connection. To avoid it we set up a watchdog: a timer that resets the system if the timer is not reset in eight seconds.
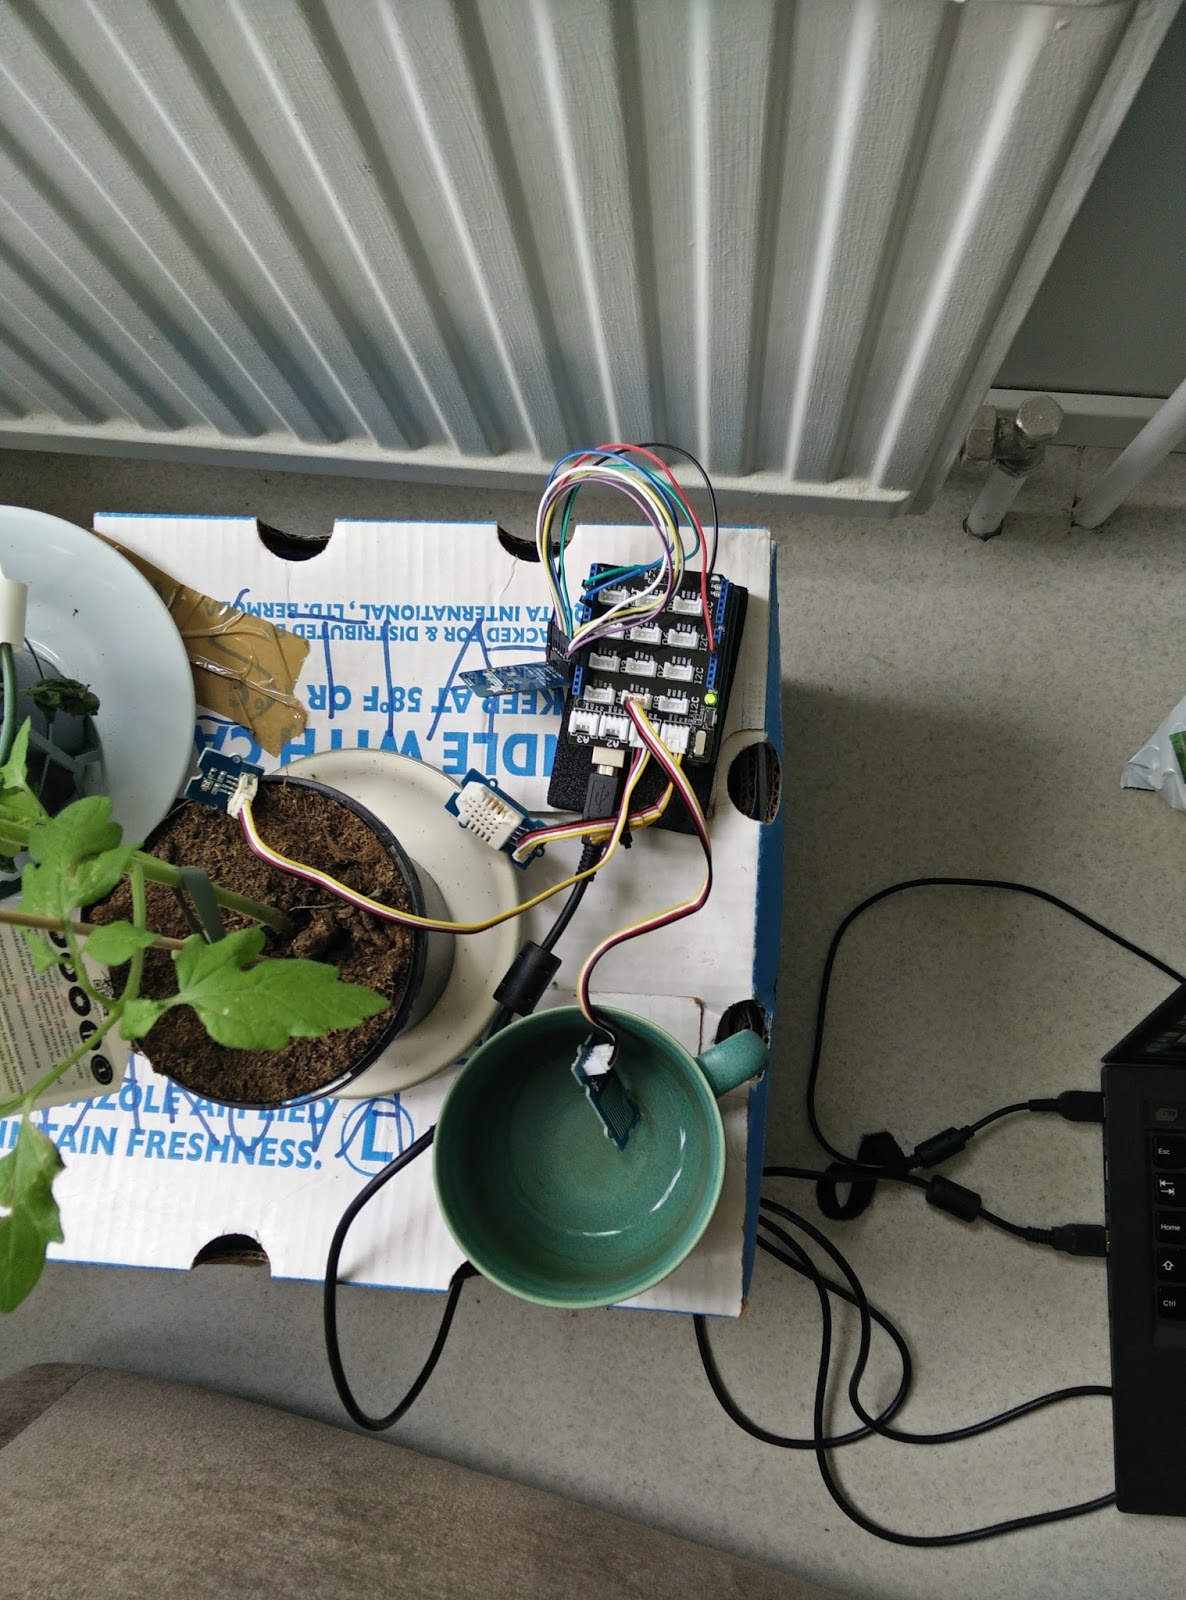 Testing the water sensor.
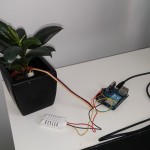
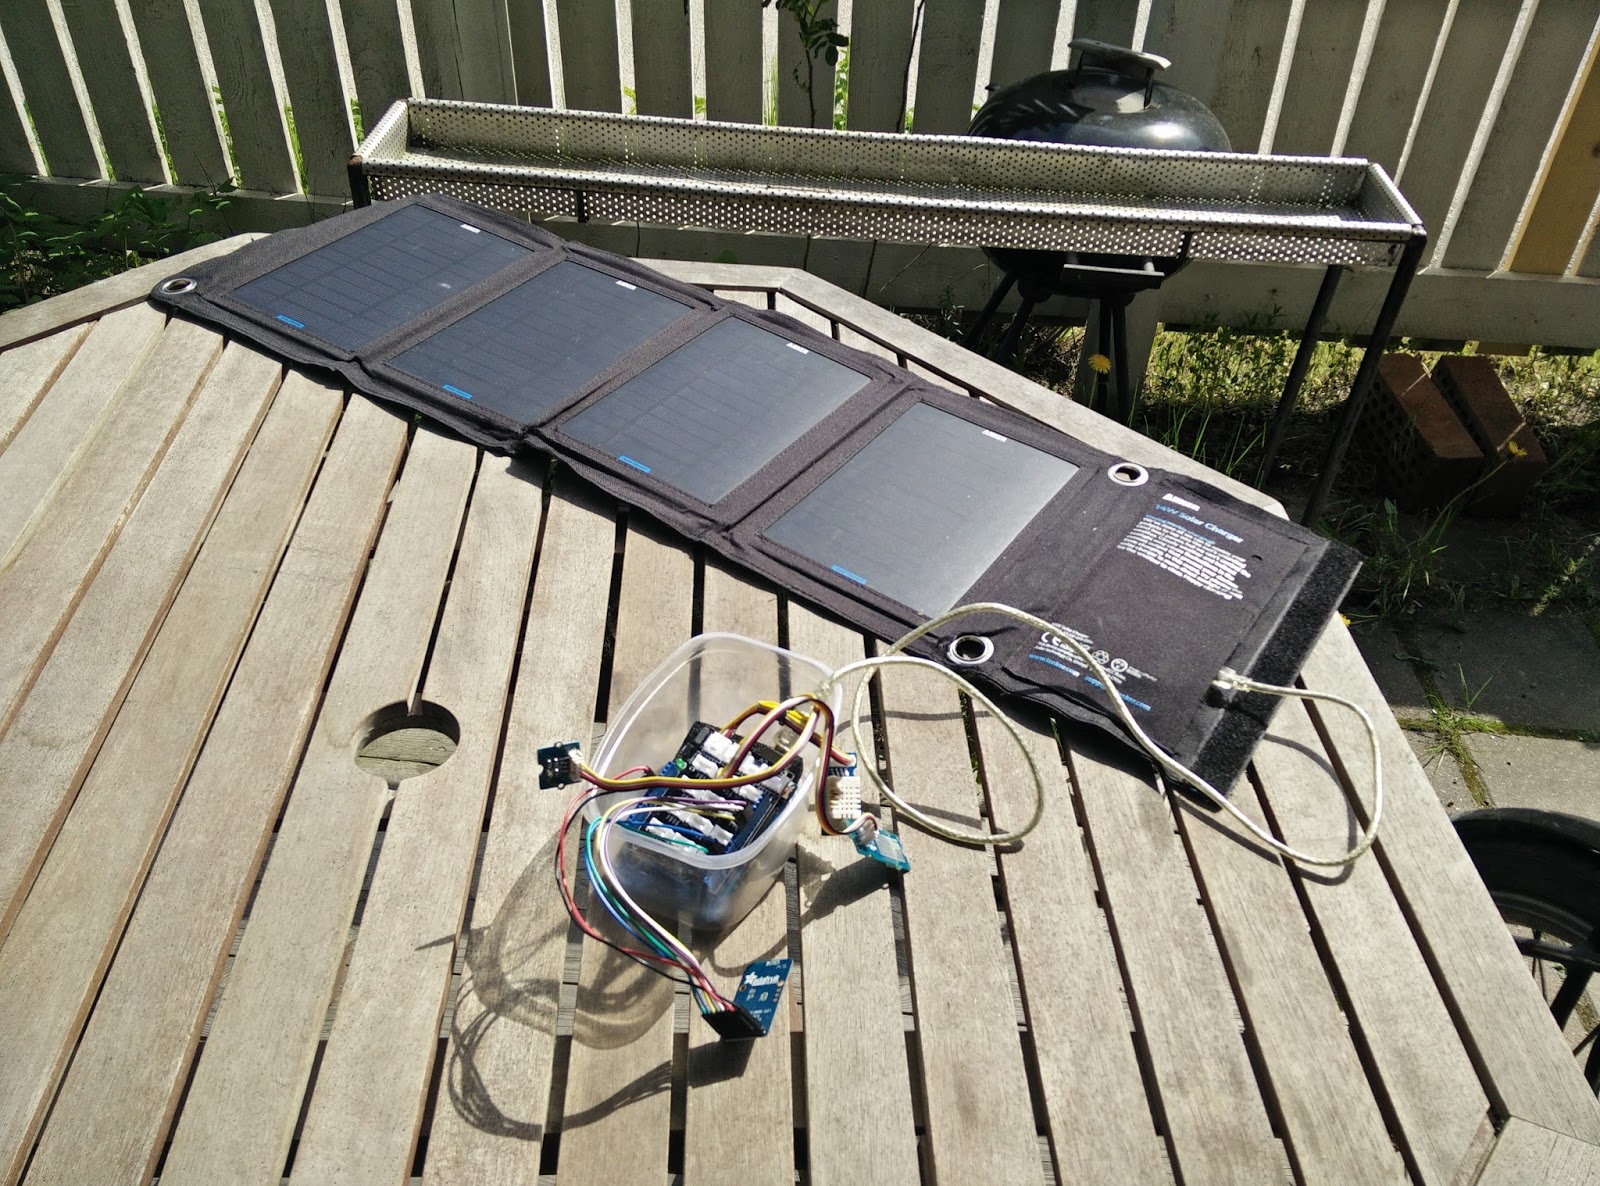 Testing the luminance sensor and Arduino with solar panels.
Backend server
Backend server was implemented using NodeJS, MongoDB and Express and was hosted on Heroku. Backend loosely follows REST architecture and returns all the data as JSON objects. Most of the data is served straight from the database except for a few aggregations for the latest and average values.
The implementation uses Express for basic routing with generic code modules to allow easy extendability. Authentication is not yet supported, but basic skeleton for authentication middleware is present in the code. Currently the application is insecure when used in an open environment such as Heroku.
Data visualization
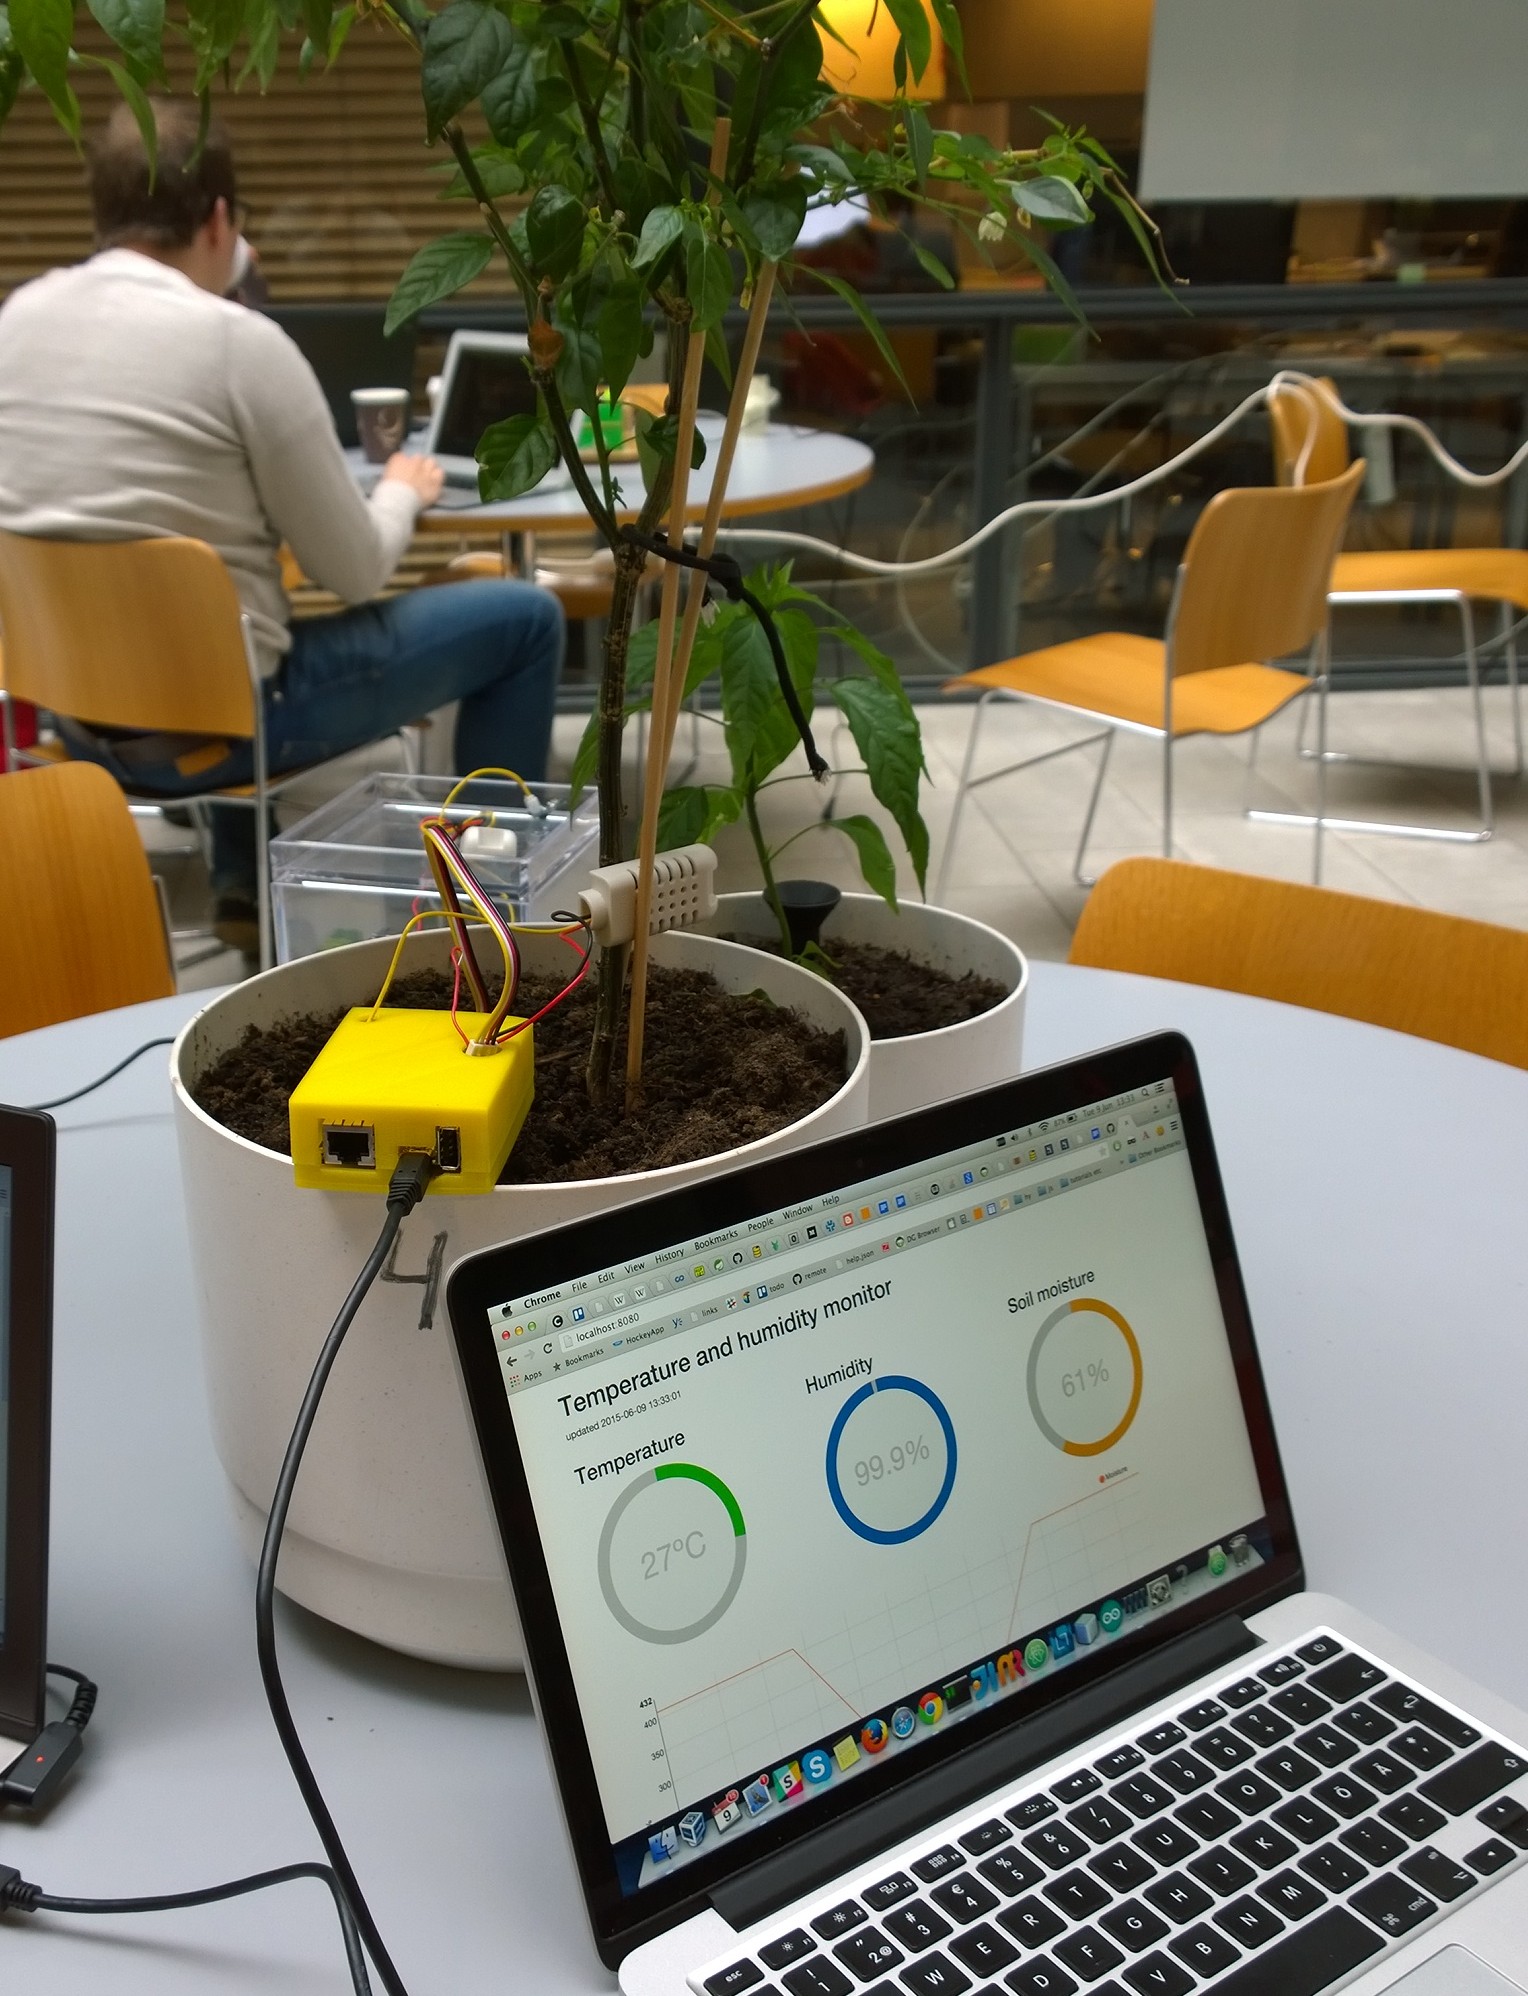
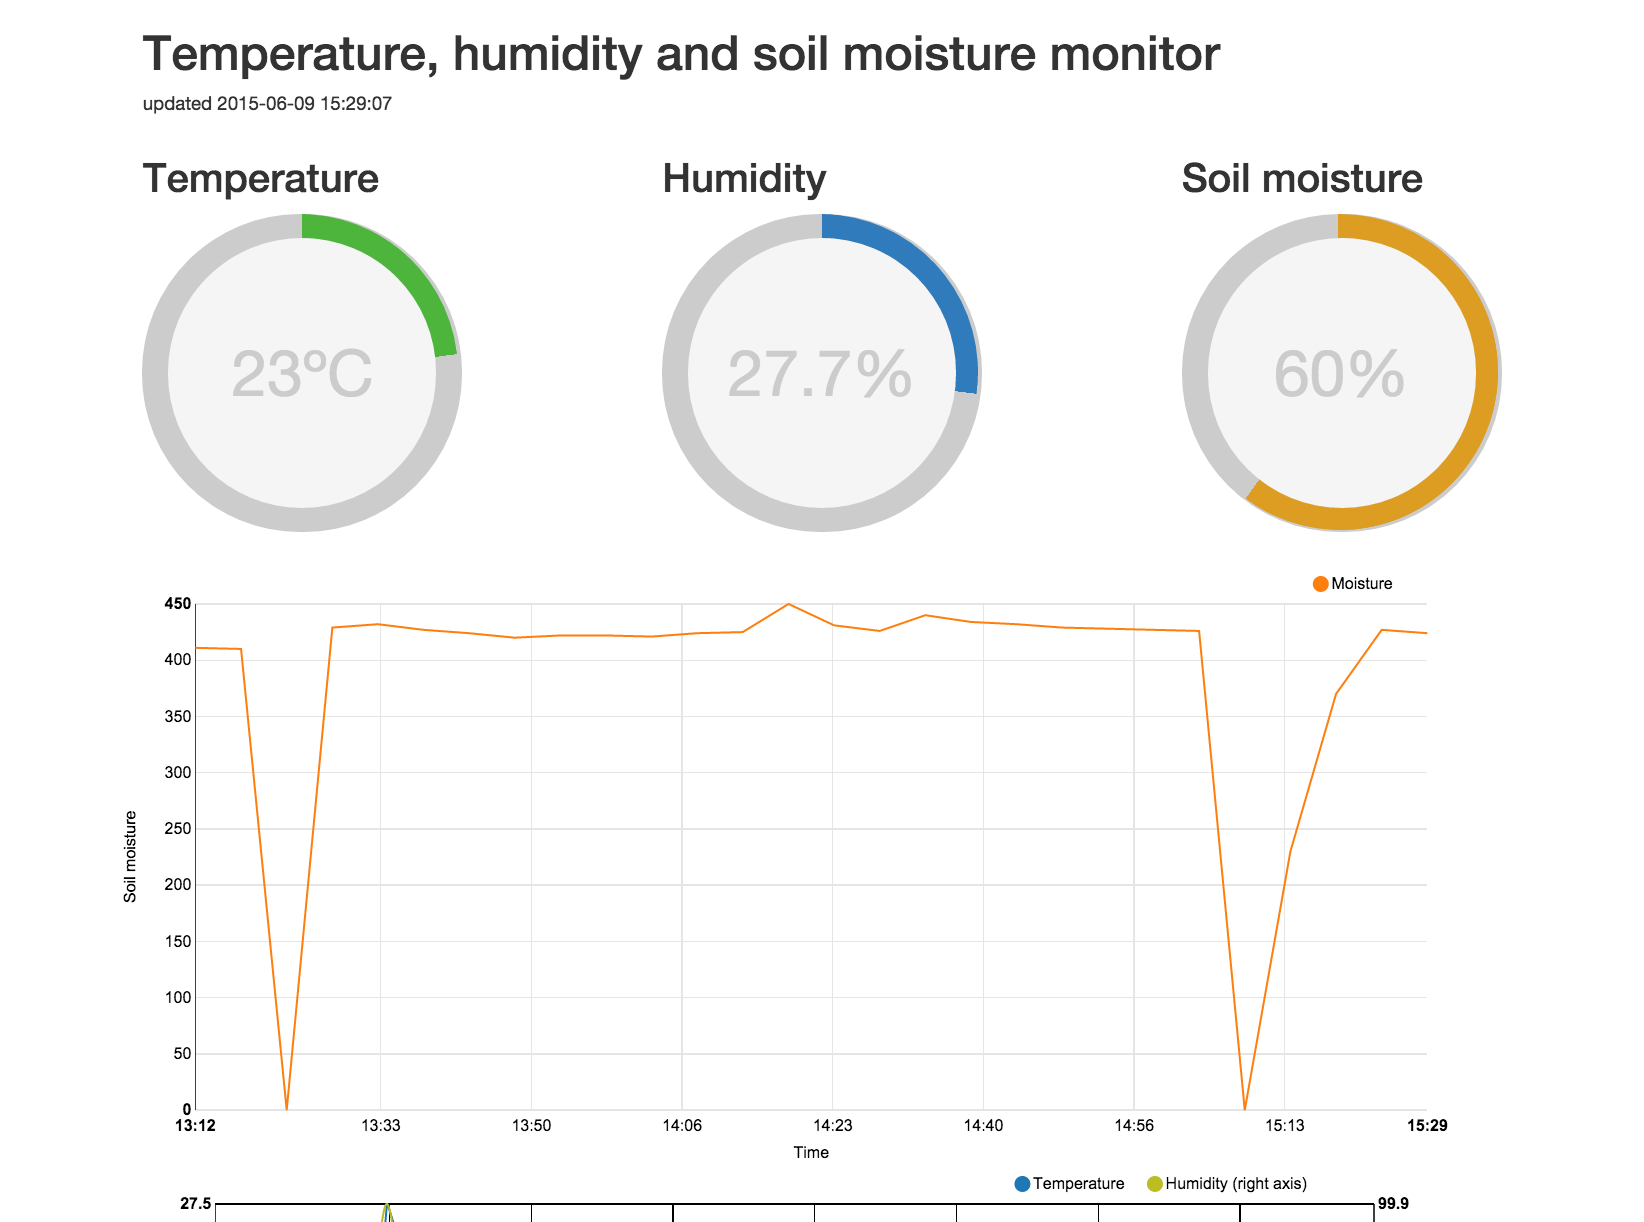
We visualized the data with Angular.js using Bootstrap and angular-chart.js libraries. The dashboard is responsive and reactive, so it fits on every device and time series information is constantly updated.
Basic information displayed is temperature, humidity, amount of light and if water needs to be added to the tank.
 Time series charts displaying real data (Greenhouse project 2) and dummy data (for testing purpose).
Additionally, historic information on temperature, humidity and light levels is shown in time series charts.
Reactivity is accomplished by retrieving the data from the backend service in 10-second intervals and updating the time series charts accordingly allowing the user to see changes in real-time.
This front-end lives in its own Heroku instance and is supported by a static NodeJS file server. Information is retrieved from the backend service with basic HTTP GET requests using Angular.js $http provider.
3D printing the parts
We designed a hydroponics system which consists of a water tank including a pump and plant modules connected to the tank. Plant modules are simple cubic boxes that can be lined up to make the system extendable. Inside each module, a removable holder supports the plant leaving only its roots in contact with water.
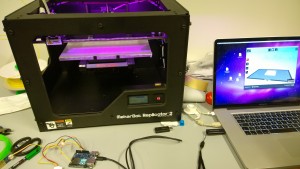
We used TinkerCAD to create the STL models of the parts. Printing was done by Makerbot Replicator 2, which used polylactic acid (PLA) as feedstock material. PLA is a biodegradable derivative of corn starch.
First we printed a plant module using standard quality and 15% fill density (amount of infill in, for example, walls). It took 4.5 hours to finish, so for the next module we used low quality and 10% fill density. This reduced the printing time to 2.5 hours. The printer had to be watched during the printing because sometimes PLA filament fed to the machine got tangled and snapped, terminating the process.
 Printing the first plant module. First version of the plant holder on the right side.
We made multiple versions of the holders and some other small parts. This was where 3D printer became handy: it was easy to see which designs worked and which did not after having the actual physical object in hand.
Testing the system
After having all the parts printed we hooked two plant modules and a tank together, put the pump and a hose in place, added some water and started the pump to see if the system actually worked. Water flowed easily through all plant modules back to the tank but after a few minutes we noticed that some part of the system was leaking. We tried to seal the joints between plant modules by adding some silicone and glueing the modules together. It didn’t resolve the leaking issue as it seemed that water was leaking through the bottoms of the plant modules. Next we covered the interiors of the plant modules with water resistant paint but it didn’t help either.
We are not sure if the plant modules could have been made waterproof by printing them with higher fill density. However, leaking was not really a major issue since the containers kept the water long enough to demonstrate how the system works. Below is a video of the final version in operation. Arduino was placed in a wooden box to make sure it did not get wet. Luminance and temperature & humidity sensors are on top of the wooden box. The plant module with a plant in it is filled with LECA.
Source code for the project is available on a Github repository: https://github.com/hzhulkko/iot
The team
Heidi – Arduino programming, hardware testing, 3D design and printing operations
Jarkko – Backend server, 3D design
Lari – Data visualization, 3D design and printing operations