In this brief blog post we explain how we built a small system that monitors the temperature, air humidity and soil moisture of a small greenhouse or a plant pot. The prototype was implemented as a 2-man team with Mika Aho and Jyri Lehvä. The focus of the project was more on the software than on the hardware and the goal was to get to know the very basics of Arduino environment and learn something new about web programming in general.
The idea of the system was as simple as providing information about the environment of a small greenhouse to the gardener. We felt that monitoring the temperature, air humidity and soil moisture were the most important metrics we should be able to provide. To achieve that, we selected two sensors. One for the soil moisture and the second one to monitor the temperature and air humidity. The metrics from the sensors were saved to an online database and presented by a web application as graphs and charts so that the gardener can browse them with any modern web browser.
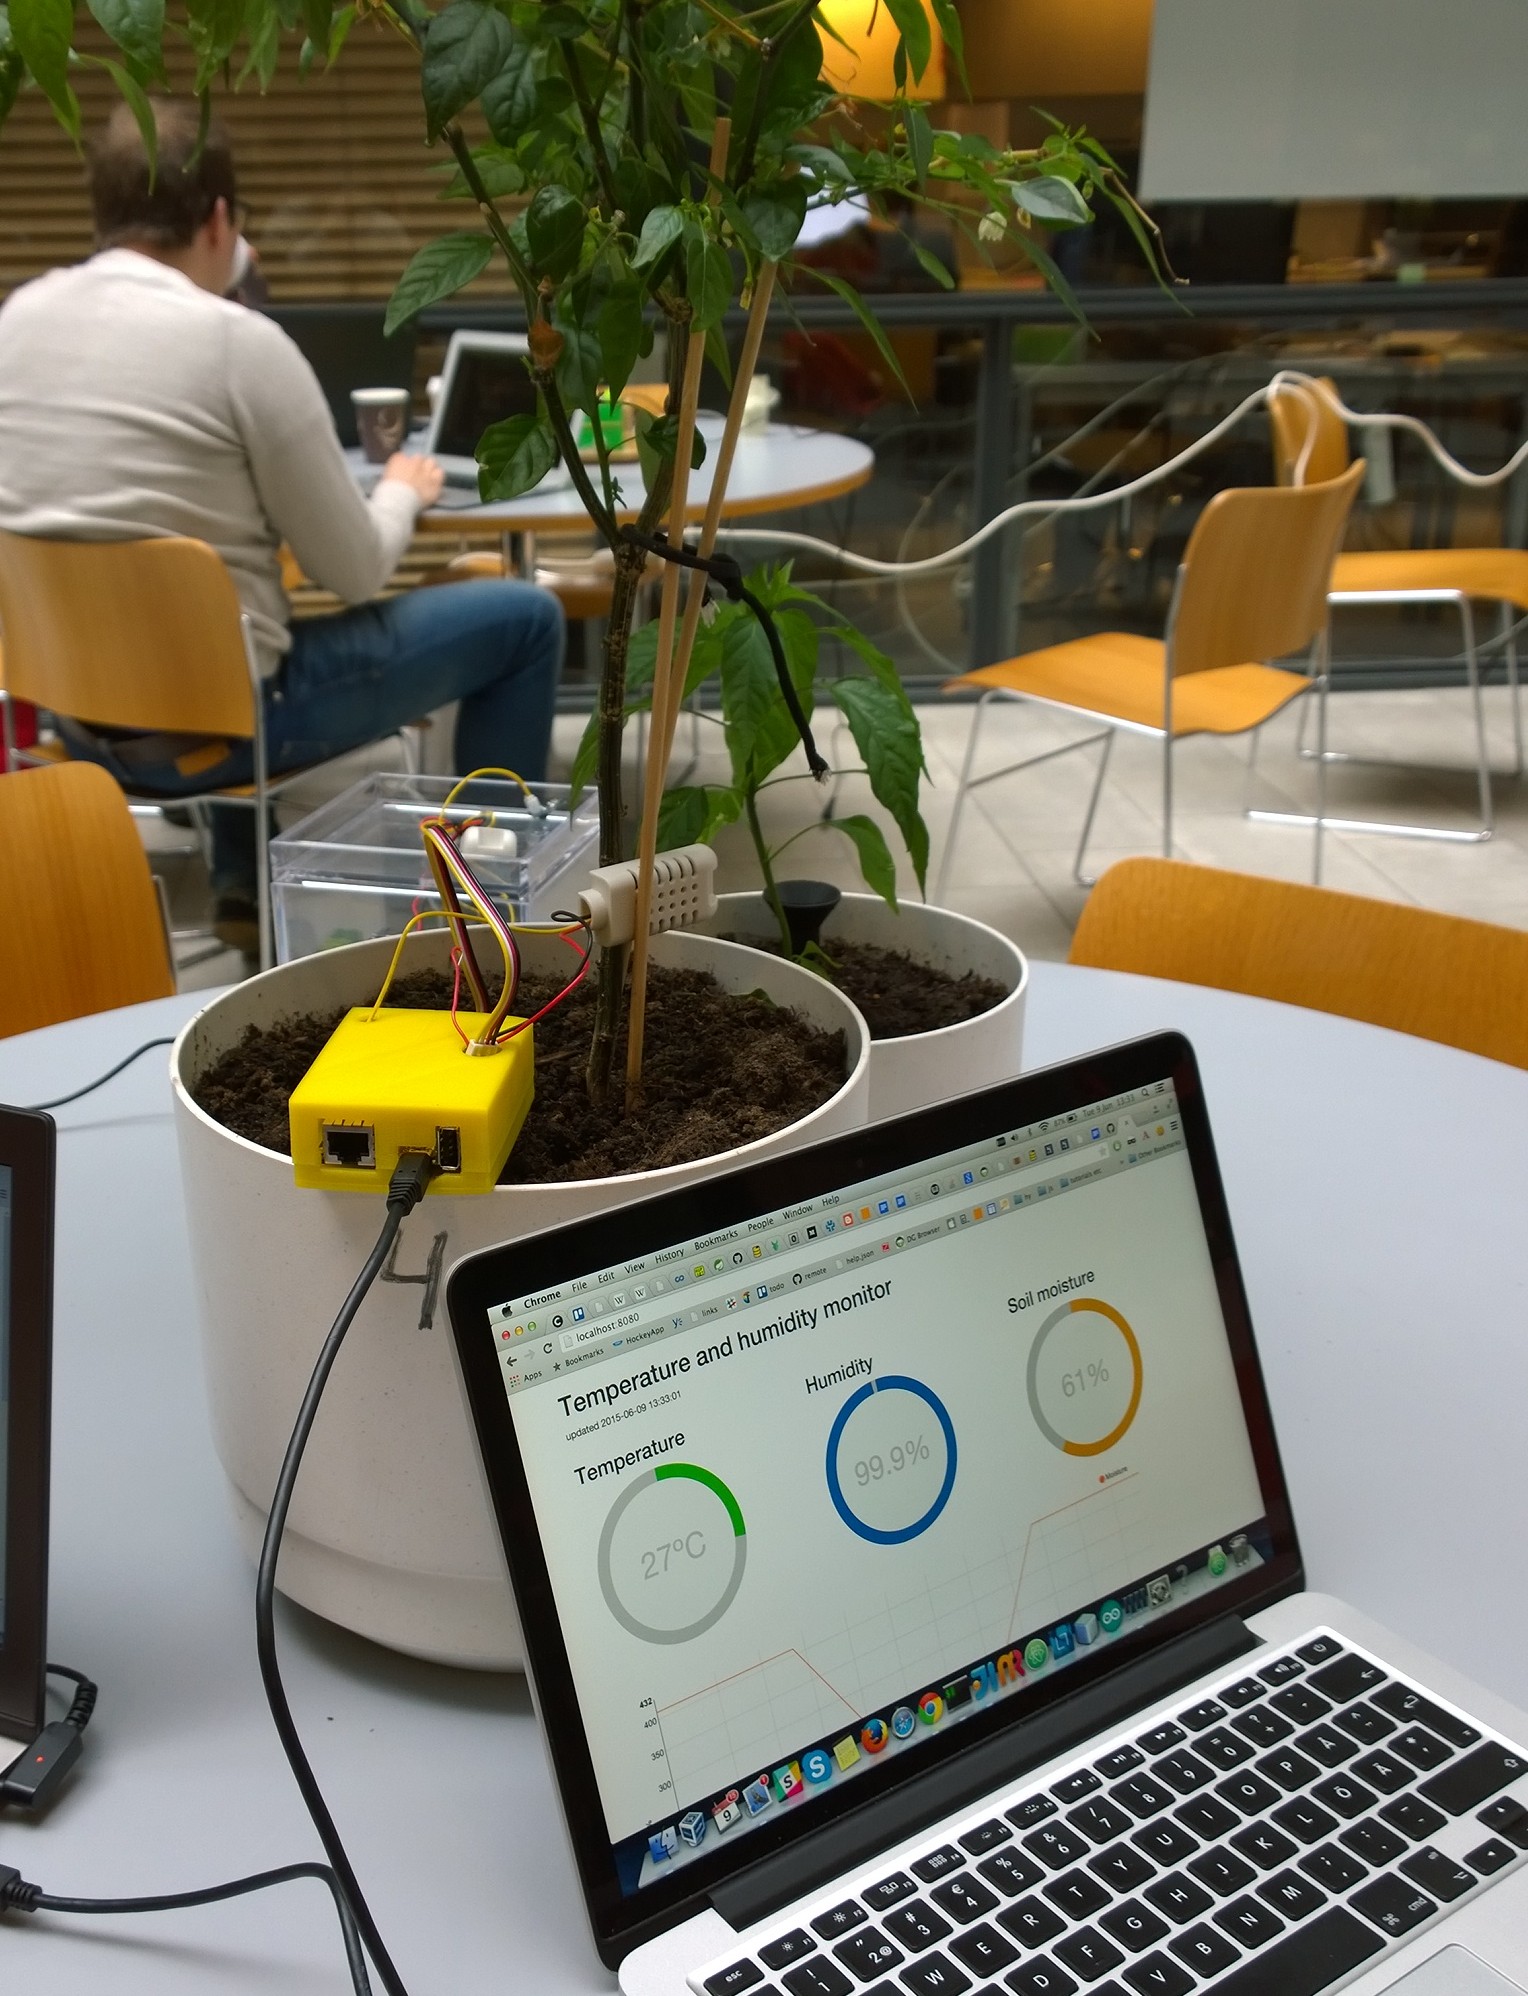
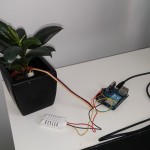
Prototype in action
Arduino Yun and the sensors
The hardware used consisted of Arduino Yun and two sensors; AM2302 for temperature and air humidity and a Seeedstudio Grove sensor for soil moisture. We chose Arduino Yun because it felt like an easy device to use; it runs a Linux and contains a Wi-Fi chip. All we had to do was to setup it, plug it to a laptop with Arduino IDE and connect the sensors. After that we could just start writing code. Very Easy!
For the Arduino Yun we wrote a simple program that reads the input from the sensors attached to it every 10 minutes. The input from the sensors is then formatted to JSON and pushed to Firebase which is a web service for storing and querying data. The delay between reads from the sensors can be configured to any value that fits the best.
-
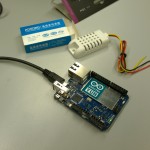
- Arduino Yun and AM2302
-
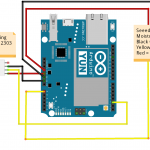
- Wirings
-
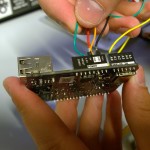
- More wirings
-
- Sensors up and running
The Web application
The web application was built using Nodejs, ExpressJS and Firebase as the backend. The frontend was built using AngularJS, Angularfire and using D3js to draw the charts. The code can be found from Github (https://github.com/jlehvae/exgreen2k15). The application was deployed to Heroku (https://guarded-mesa-9835.herokuapp.com/).
The most significant challenge of the web application was to correctly visualize the data. For visualization we used Angular directive called Angular-nvD3. The Angular-nvD3 didn’t have very specific instructions on how to format your data so that it is correctly visualized and that’s why we had to take a trial and error approach. Configuring the charts correctly and formatting the data properly can take a while if you don’t have any previous experience with D3js. After we figured out the correct way to input the data, we were getting charts that didn’t look quite right. Soon we found out that we were actually missing a specific CSS file. After adding the missing file everything pretty much started working.
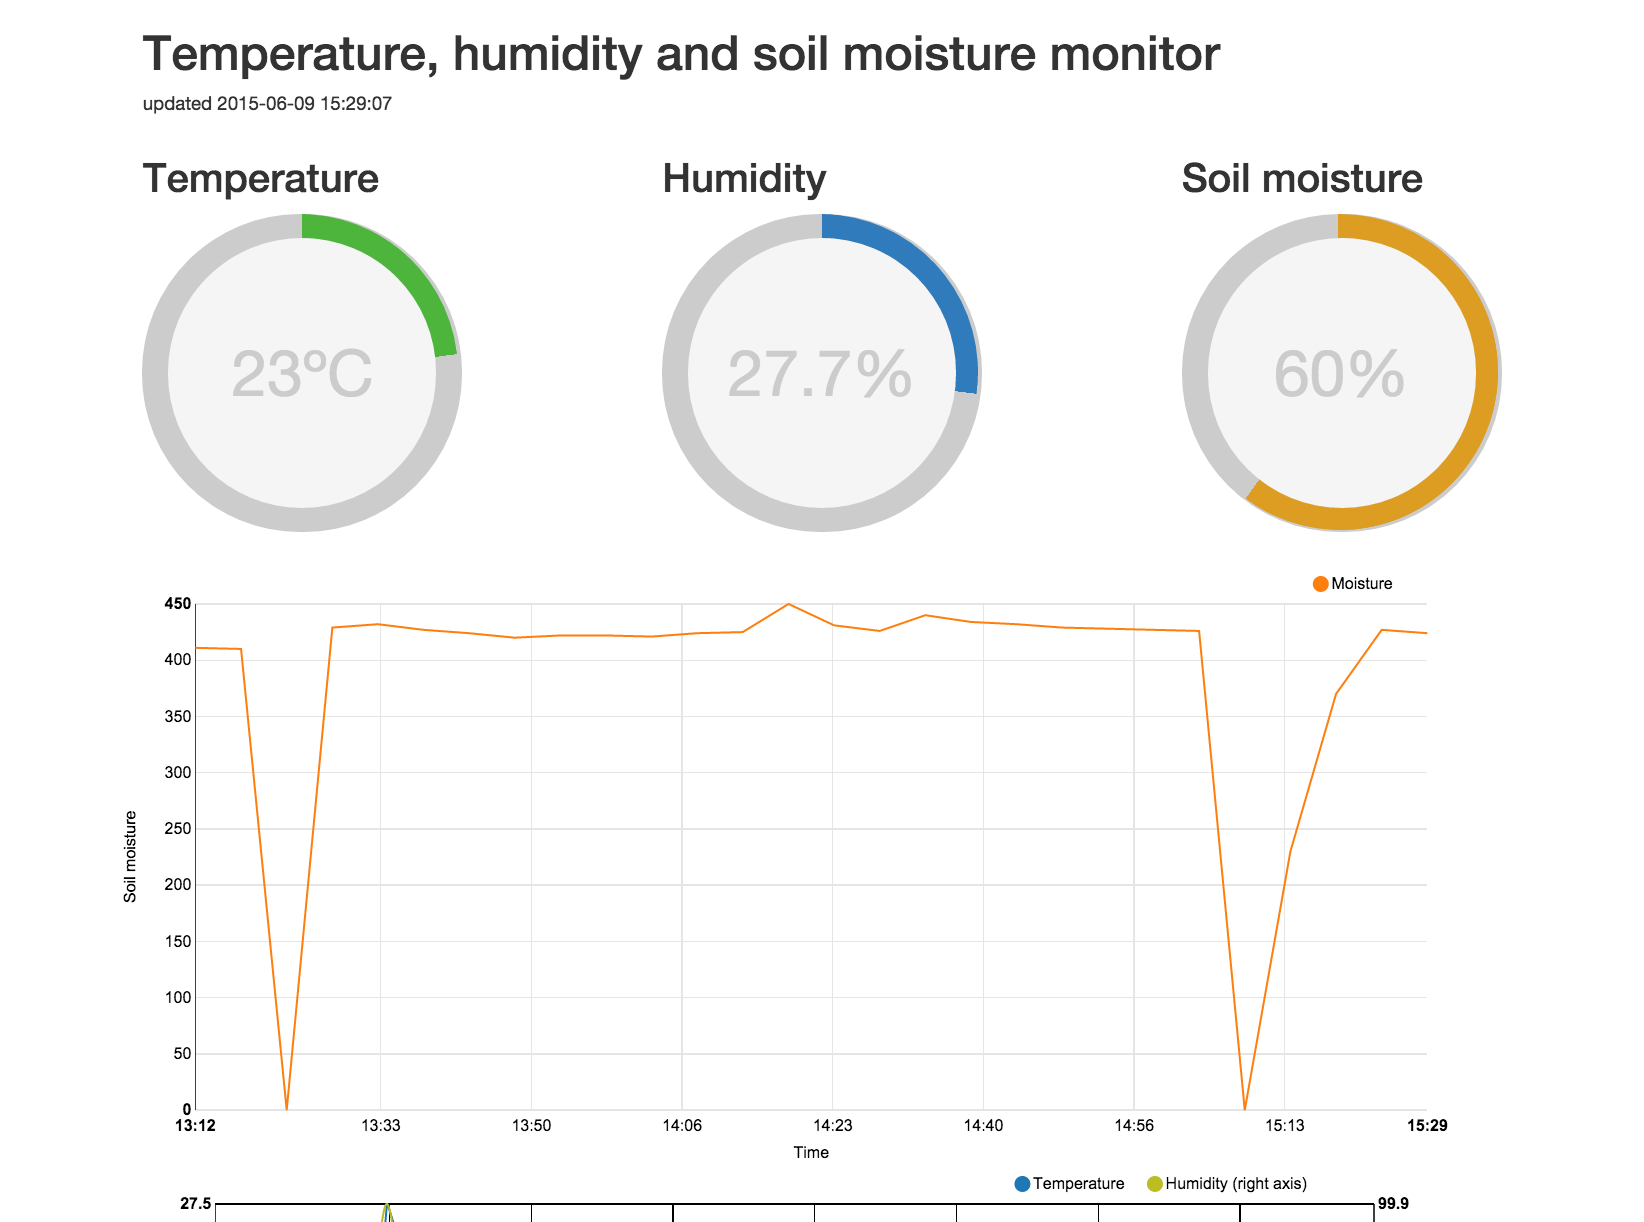
Online Dashboard at Heroku
3D printing
The final step was 3D printing a case for our Arduino. We had no experience working with a 3D printer before. It was surprising how easy it was to print the case. It turned out the Internet is full of readymade 3D models for different things. It took only a couple of minutes to search for a model that is designed for Arduino Yun. Only problem with the model was that we had two wires that needed holes on top of it so we could have the sensors attached while the Yun is in the case. We made the holes using Tinkercad (https://www.tinkercad.com/). It’s a website that let’s you import and edit 3D models using a web UI and export them back once they are modified.
We used Makerbot Replicator 2 as the 3D printer. It was easy to use; just add the file of the model you want to print using the MakerWare and press start (we pretty much used the default values for everything). Printing the case took around 2 hours in total. The top and the bottom part of the case had to be printed separately so the case wouldn’t break apart during printing as there would have been nothing to support the roof of the case. The top part of the case was printed upside down so the roof was supported facing against the floor of the printer.
-
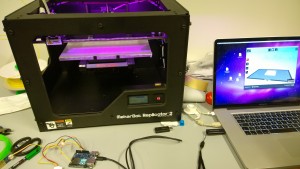
- MakerBot Replicator 2
-

- The printing has started
-

- Top part of the case
-
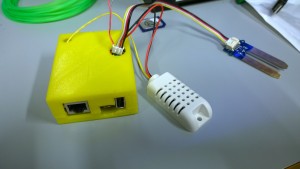
- Case finished
Sensors and the validity of the data
There were some problems with the moisture sensor as the readings before and after watering a plant were not that different. The plant in question was supposed to be quite dry yet the sensor gave readings of 400 ish (according to Seeedstudio this means that the soil is moist) and after excessive watering the readings only went up by around 40. The fact that our sensor had been used before and appeared quite worn probably had something to do with this.
The setup was tested on multiple occasions by simply turning the device on and manipulating the sensors by
- touching the moisture sensor
- putting the moisture sensor in soil and pouring water into it
- blowing into the humidity/temperature sensor
- leaving the temp/hum sensor under direct sunshine
What we found out was exactly what you’d expect: the sensors (and thus our charts) correctly reacted to changes in the environment. This didn’t really mean that the data was valid, though. If we had one or two more copies of the sensors we could have tested if they are all giving out same metrics in the same conditions. Now there was no way of knowing if the sensors were accurate or if the data was valid or not.