
Table of Contents
- Introduction and Background
- Data
- Methods and Key Measures
- Results
- Discussion
- Limitations
- Implications and Conclusions
- Division of Labor
- References
Data
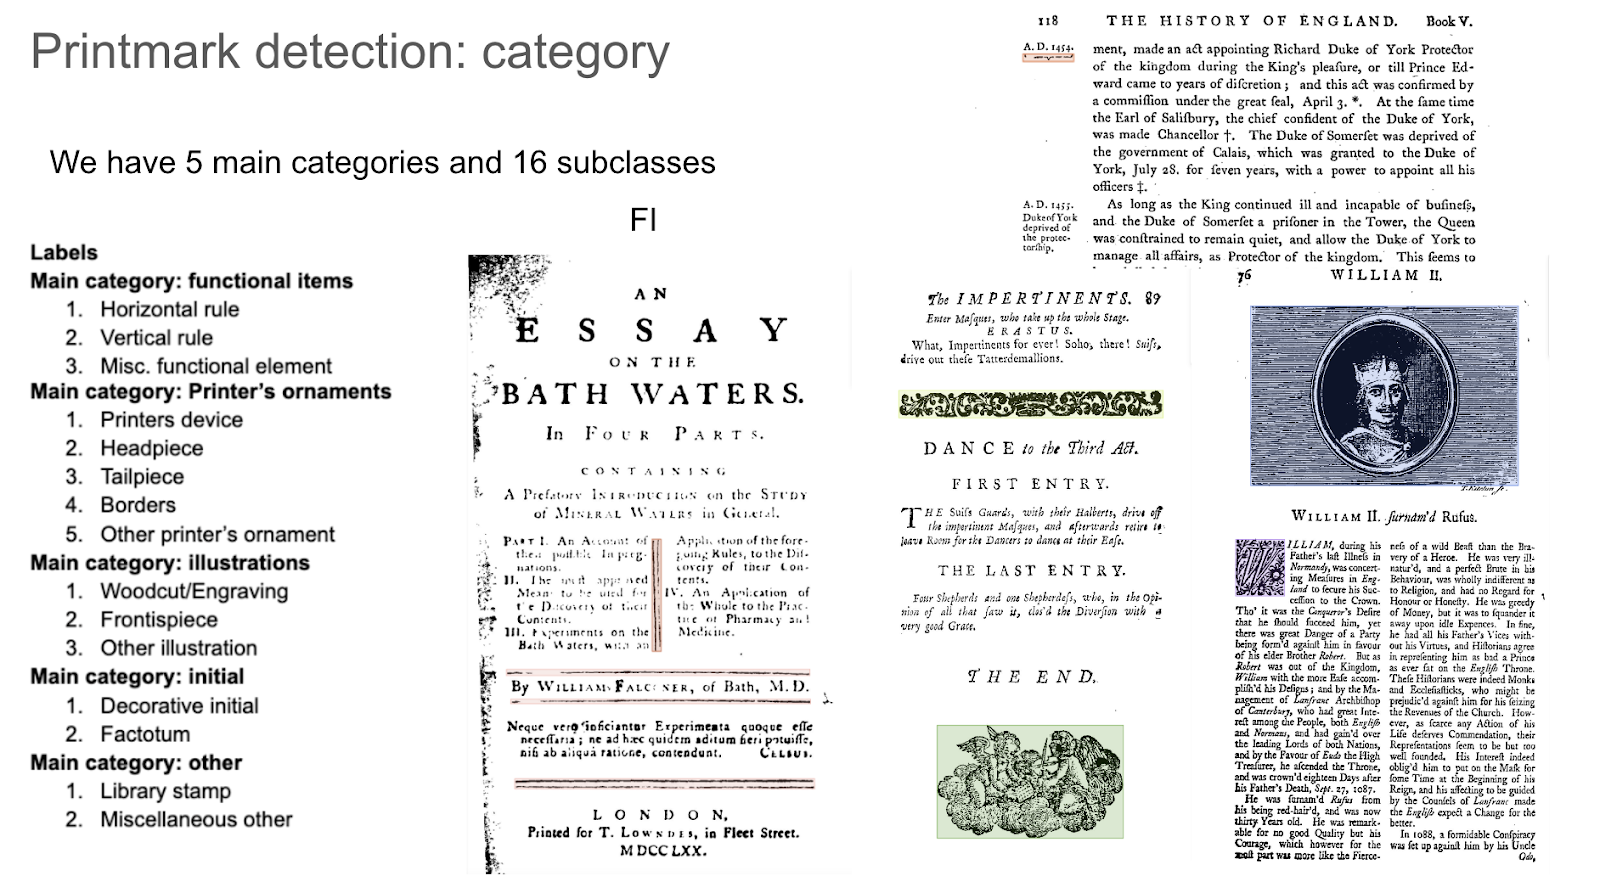
The data used in this project comprises images of scanned book pages from the Eighteenth Century Collections Online (ECCO) dataset. Besides the standard text, a page can contain various printmarks, which fall into one of the 15 categories described in Figure 1.1. Every image can be traced to the document it came from using the assigned ECCO ID. We use a subsample of 6,985 of these ECCO documents and we will refer to this dataset later as Dataset 1.
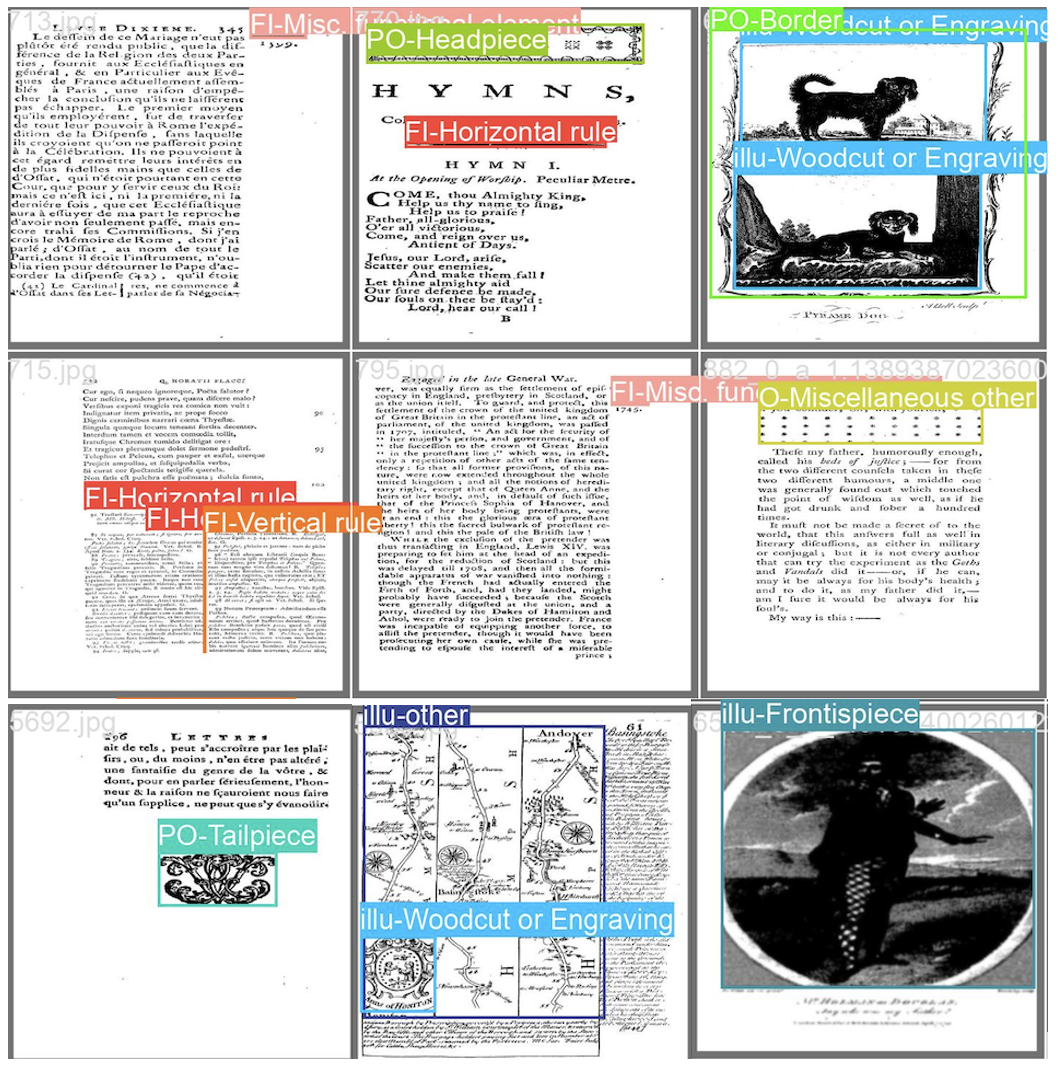
In addition to being traceable back to the original ECCO document, the images in Dataset 1 have annotation data for the 15 categories. These annotations reveal whether an image contains a printmark, its category, and its location. Figure 1.2 demonstrates annotated pages. The annotation information can be used to train computer vision models to detect printmarks in new data or to extract interesting printmarks from images for further processing.
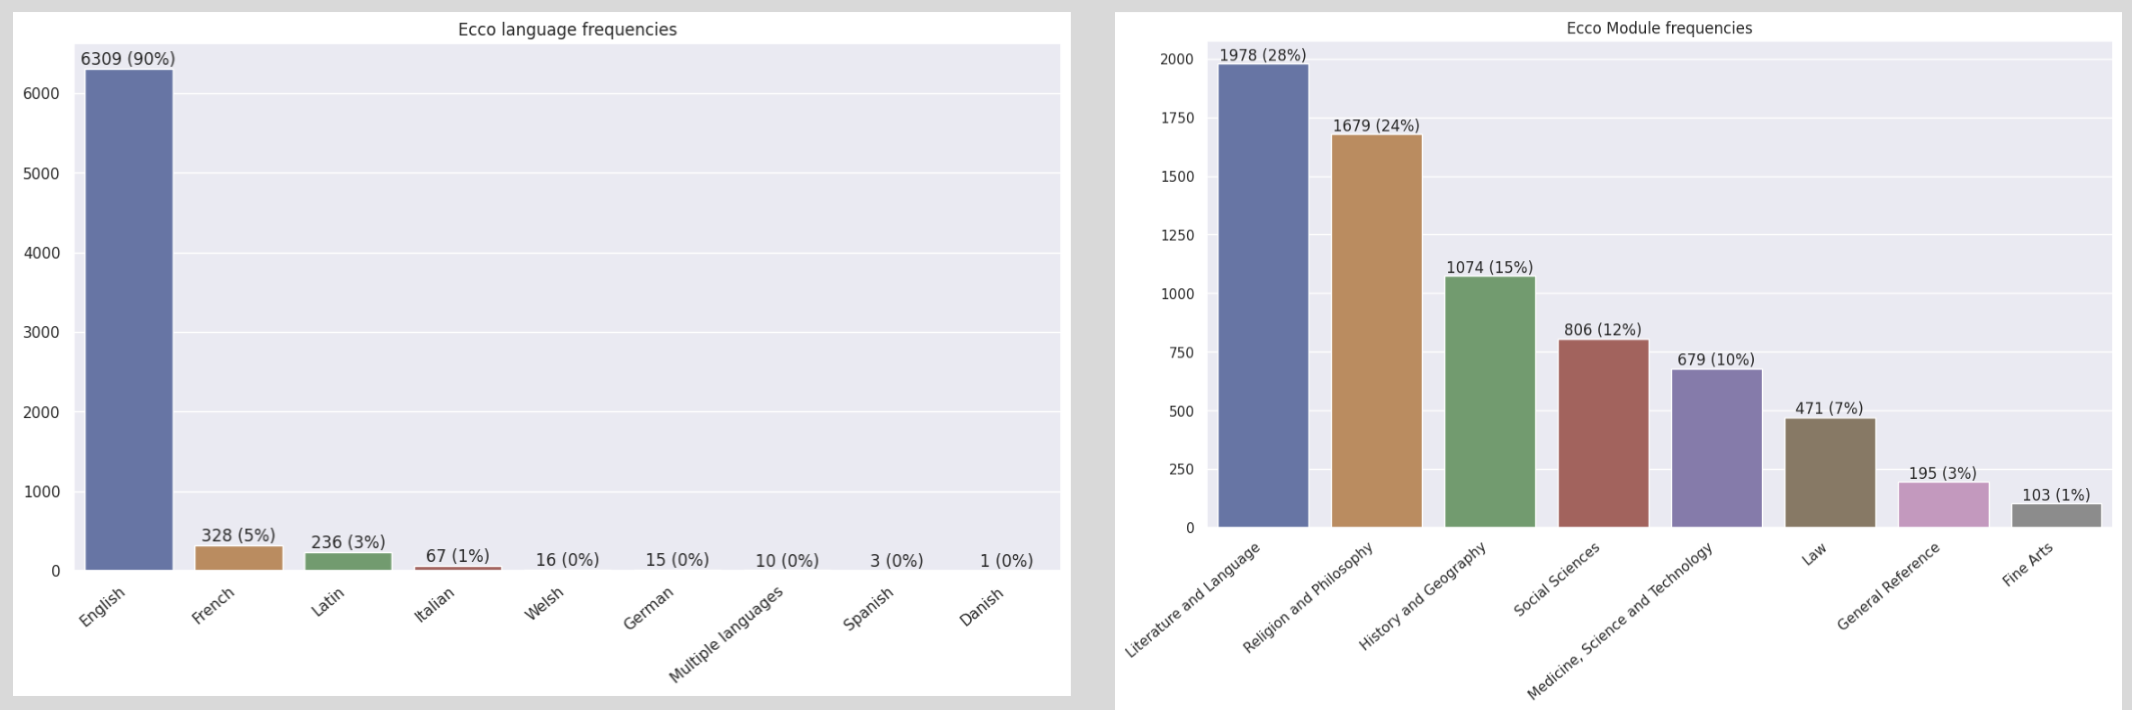
The ECCO ID allows us to pull additional metadata information using the ECCO Core database, giving us information on the document including the genre, title, character length, number of pages, start and end date, language, and an ESTC ID. In the random sample of image data that we explored, 90% of documents were written in English, 5% in French, and 3% in Latin (see Figure 1.3: left). The document module, or the topic of the text, was majority literature and language (28%), followed by religion and philosophy (24%), and history and geography (15%) (see Figure 1.3: right).
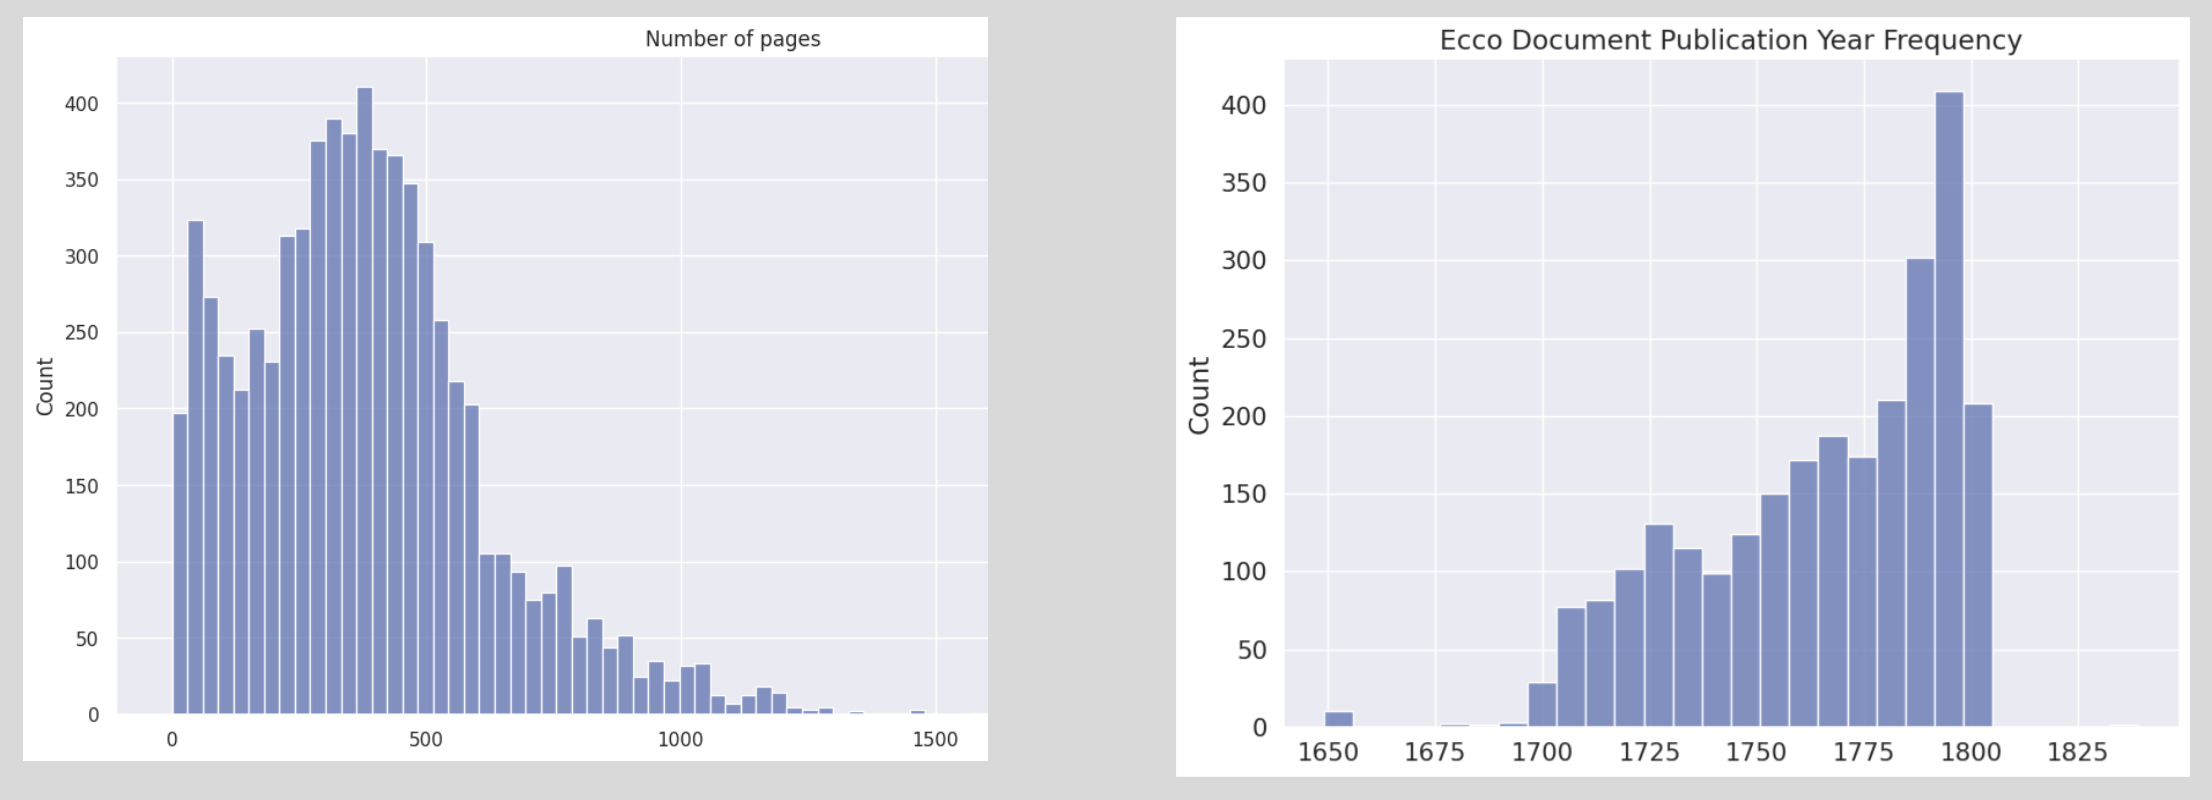
Most documents have fewer than 500 pages, although a small percentage go up to nearly 2000 pages (see Figure 1.4, left). Because the documents we are looking at were published before the 18th century, most of the texts were published close to but before the year 1800, with the first being published in 1650. Then the number of texts gradually increases until we reach 1800 (see Figure 1.4: right).
Of the 6,985 ECCO documents from the original dataset, printer information could be identified for 2,588 documents using the ESTC ID field, which identifies the printer (using field “actor”) associated with the document. Each of these 2,588 document:printer pairs were then matched up with data from the ESTC Core database in order to pull additional data including the longitude and latitude of the document publication location’s city. London, Dublin, and Edinburgh together account for 77% of the publications. See Figure 1.5 for additional location information broken down by country (left) and city (right). The interactive visualization in Figure 1.6 can be used to explore the publication locations. Hovering over a location will give the city, country, total number of documents printed in that city, and the years that printing occurred in that city.
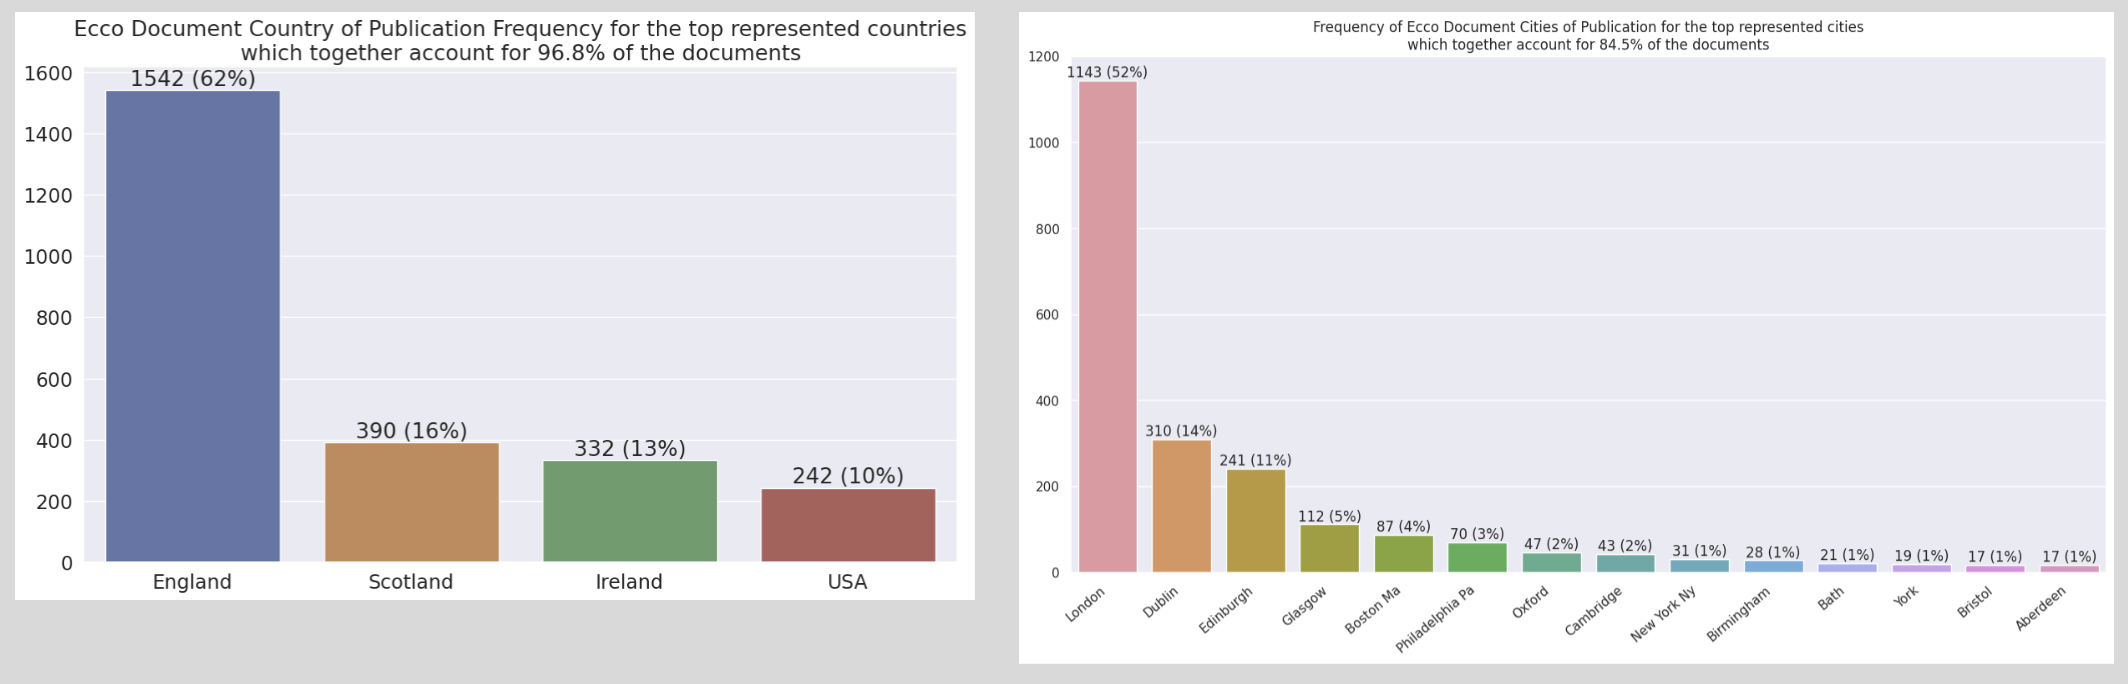

Figure 1.6: Interactive visualization displaying 2,588 documents’ publication locations. Hovering over the location will give the city, country, total number of documents printed in that city, and the years that printing occurred in that city.
Another useful subset of the ECCO dataset is the Tonson dataset, comprised of images associated to works printed by Tonson. In total, the Tonson dataset contains around 2,500 books with 730,000 images.
This subset is used mainly due to the high-quality extractions of headpieces and decorated initials that are available within the project. From the whole dataset, there are around 9200 initials extracted with good quality. An example of this is shown in Figure 1.7:
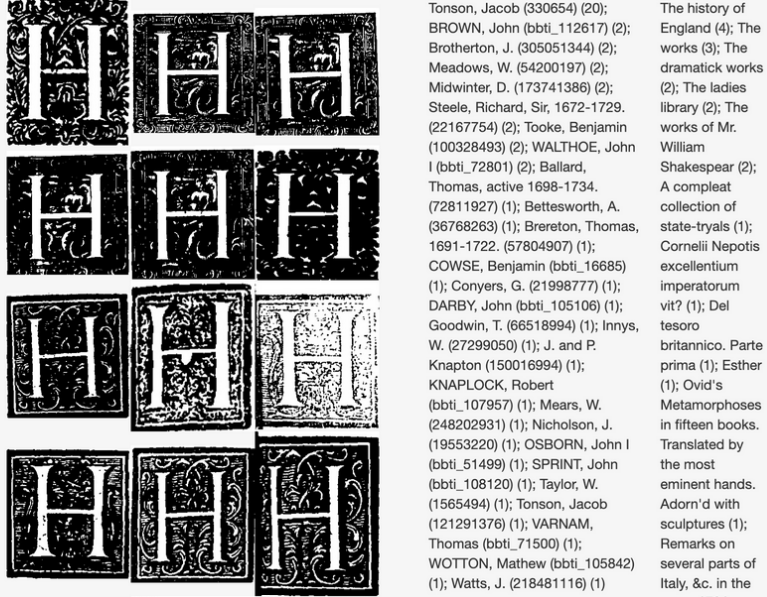
These extractions can be helpful to evaluate a clustering algorithm’s performance based on the style of an image. Currently this is the biggest dataset available in the project for these purposes.
Biases
The problem with historical data collections is usually that they contain several biases caused by 1. the historical context, 2. the curation in memory institutions, e.g. authorial bias (Sher, 2010), and 3. the selection process for the digitization of documents (Mäkelä et al., 2020).
ECCO contains only 54% of the works in the ESTC which are not equally distributed and result in a sampling bias. Tolonen et al. (2022) identified the following biases in the data we use:
-
- Overrepresentation of easy processable works,
- Overrepresentation of Ireland, underrepresentation of the US,
- More first prints, less reprints,
- Different representation of publication types: more “book-length” prints, less pamphlets, especially after 1770 from the category social sciences or law,
- Bias towards London, printers outside of London worse covered:
- Especially cross-sections of biases missing: e.g. reprints from printers outside of London,
- Rich-get-richer effect (if one book was published already, the probability is higher that also a pamphlet is included),
- Tendency that publisher increased their networks, while printers became less visible (Hill et al, 2019).