Welcome, weary web traveler.
You have arrived to my CartoGIS 2024 Portfolio. Here I have compiled all the maps made during the beforementioned course. This portfolio consists of the maps made for the smaller weekly tasks, a compiled reflection on the courses topics and also the final project which takes the majority of the space.
Weekly maps and the data used
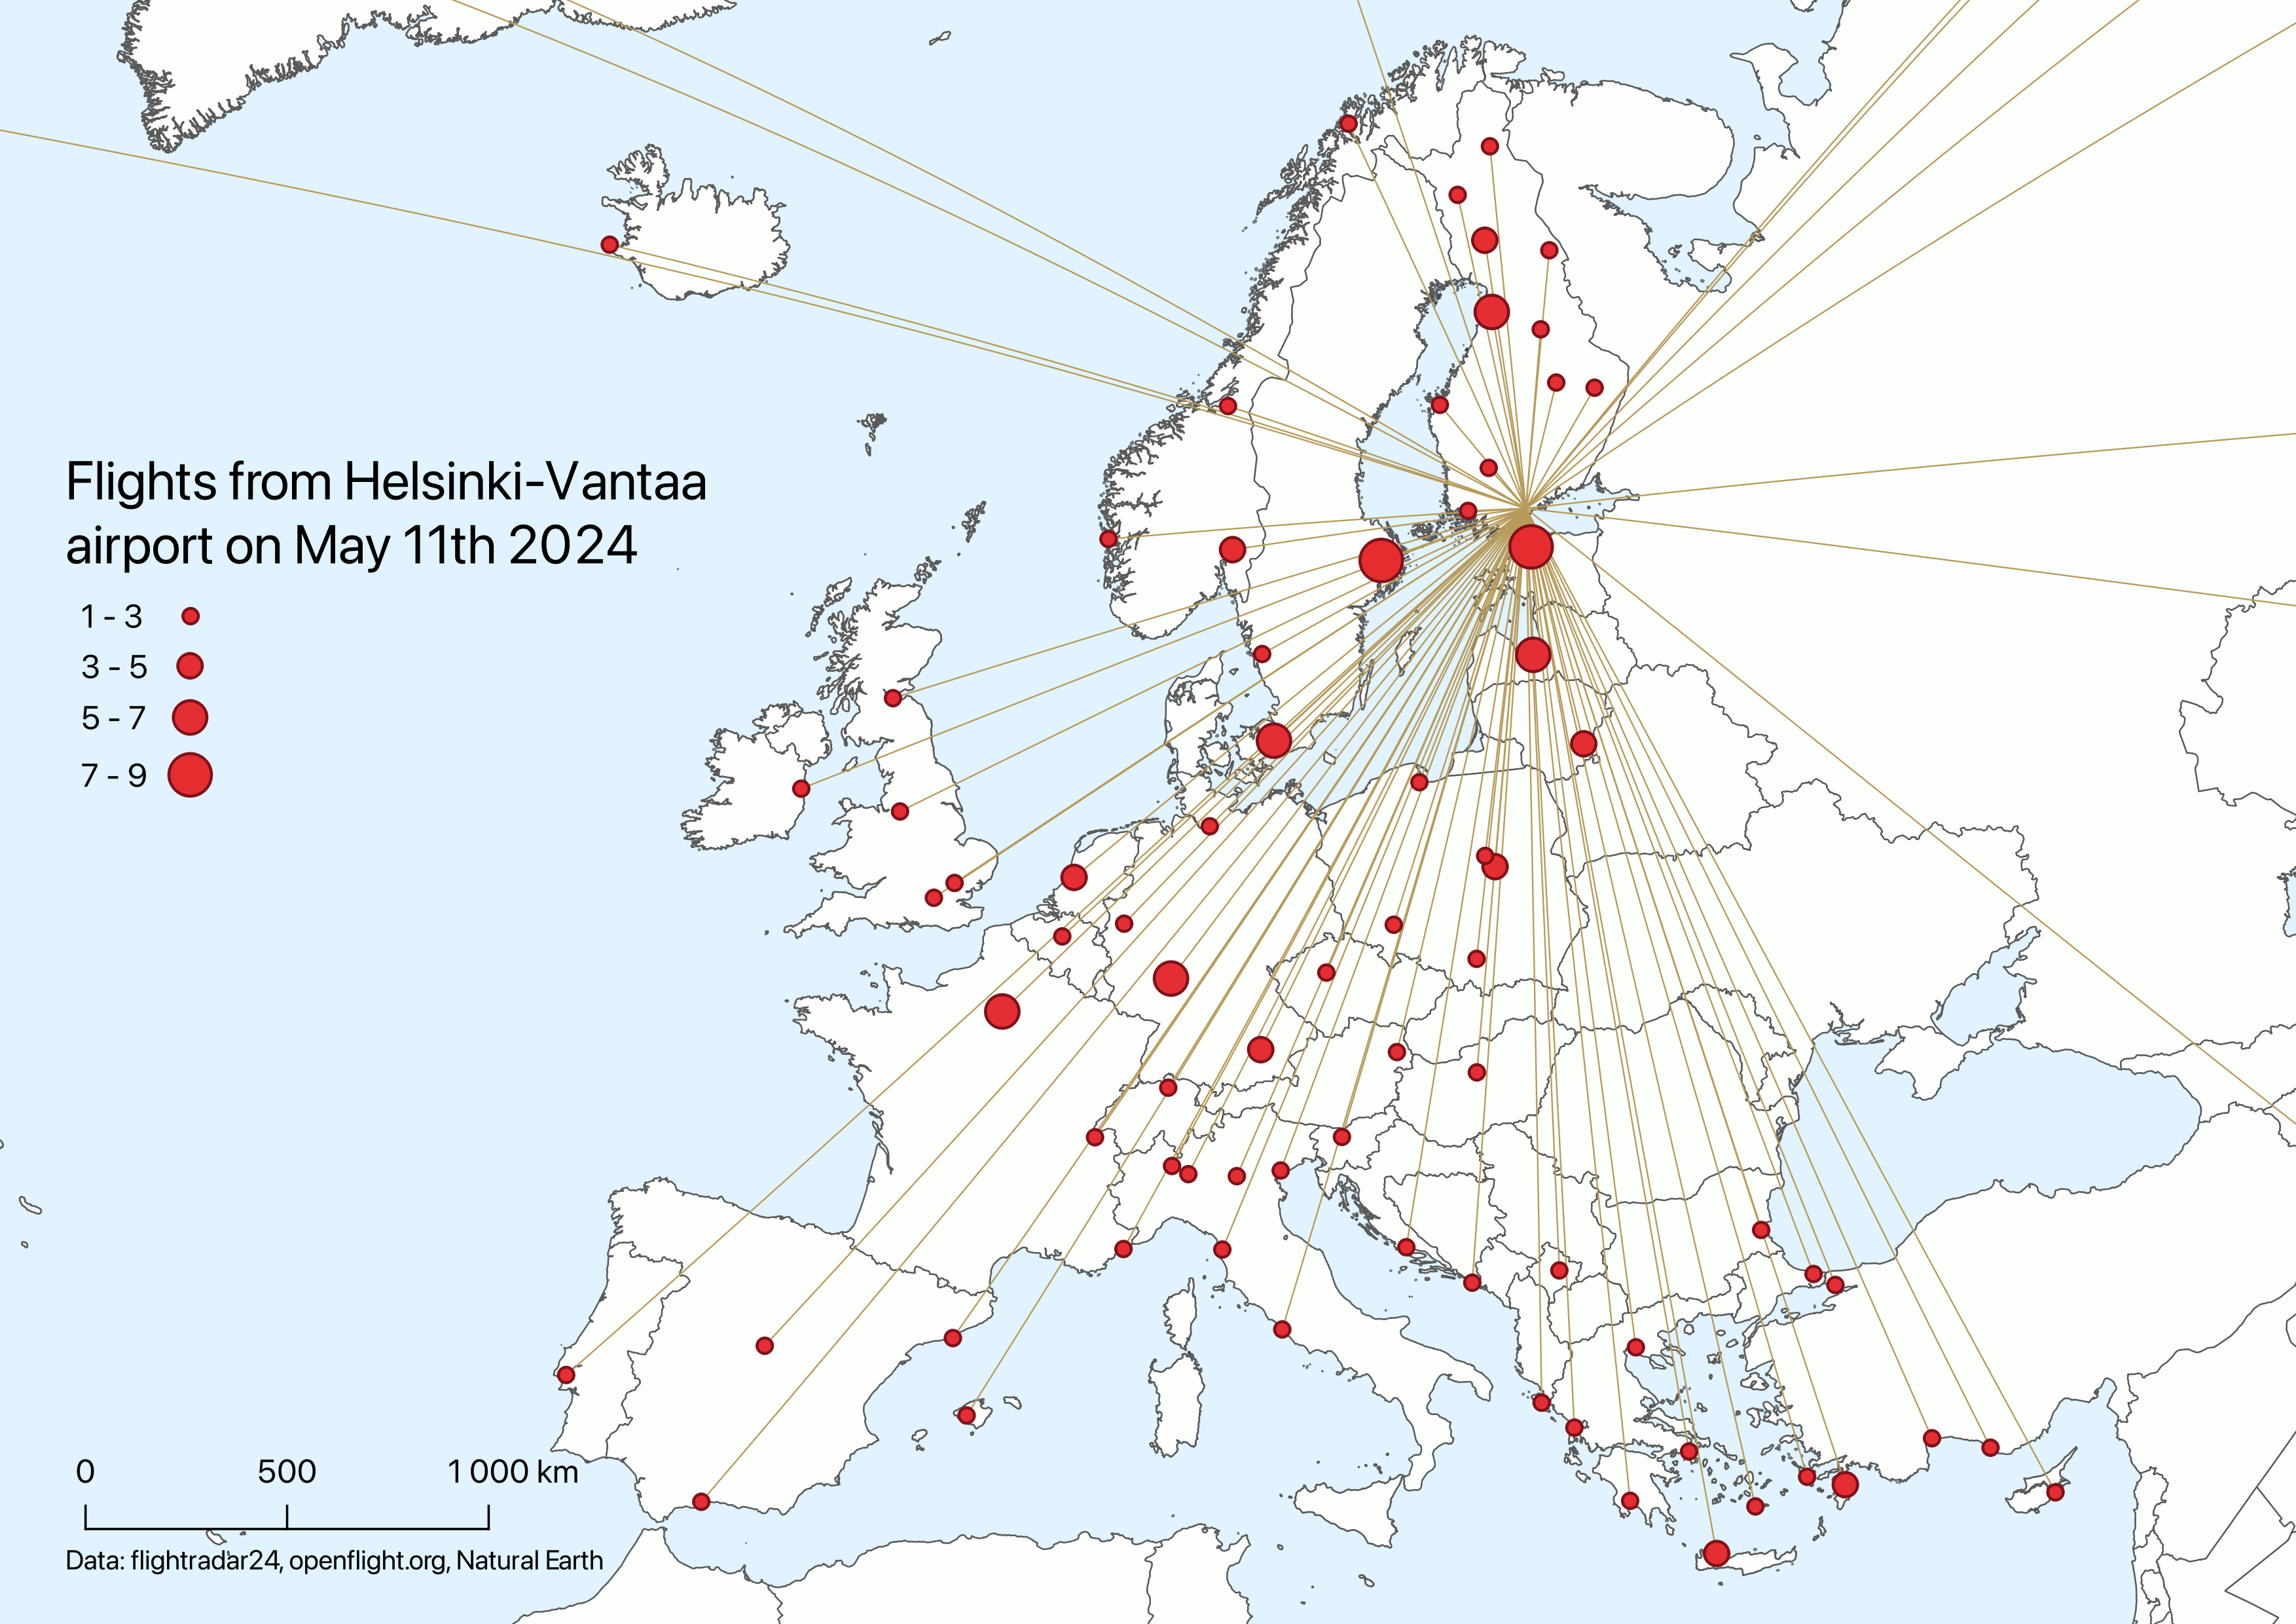
The first map showcases all flights within a certain day departing from the Helsinki-Vantaa international airport. All flight routes are visualized but only the destinations within Europe are shown on this map since most of the departing flights are to European destinations. The most frequent daily services are to the neighboring countries of Sweden and Estonia.
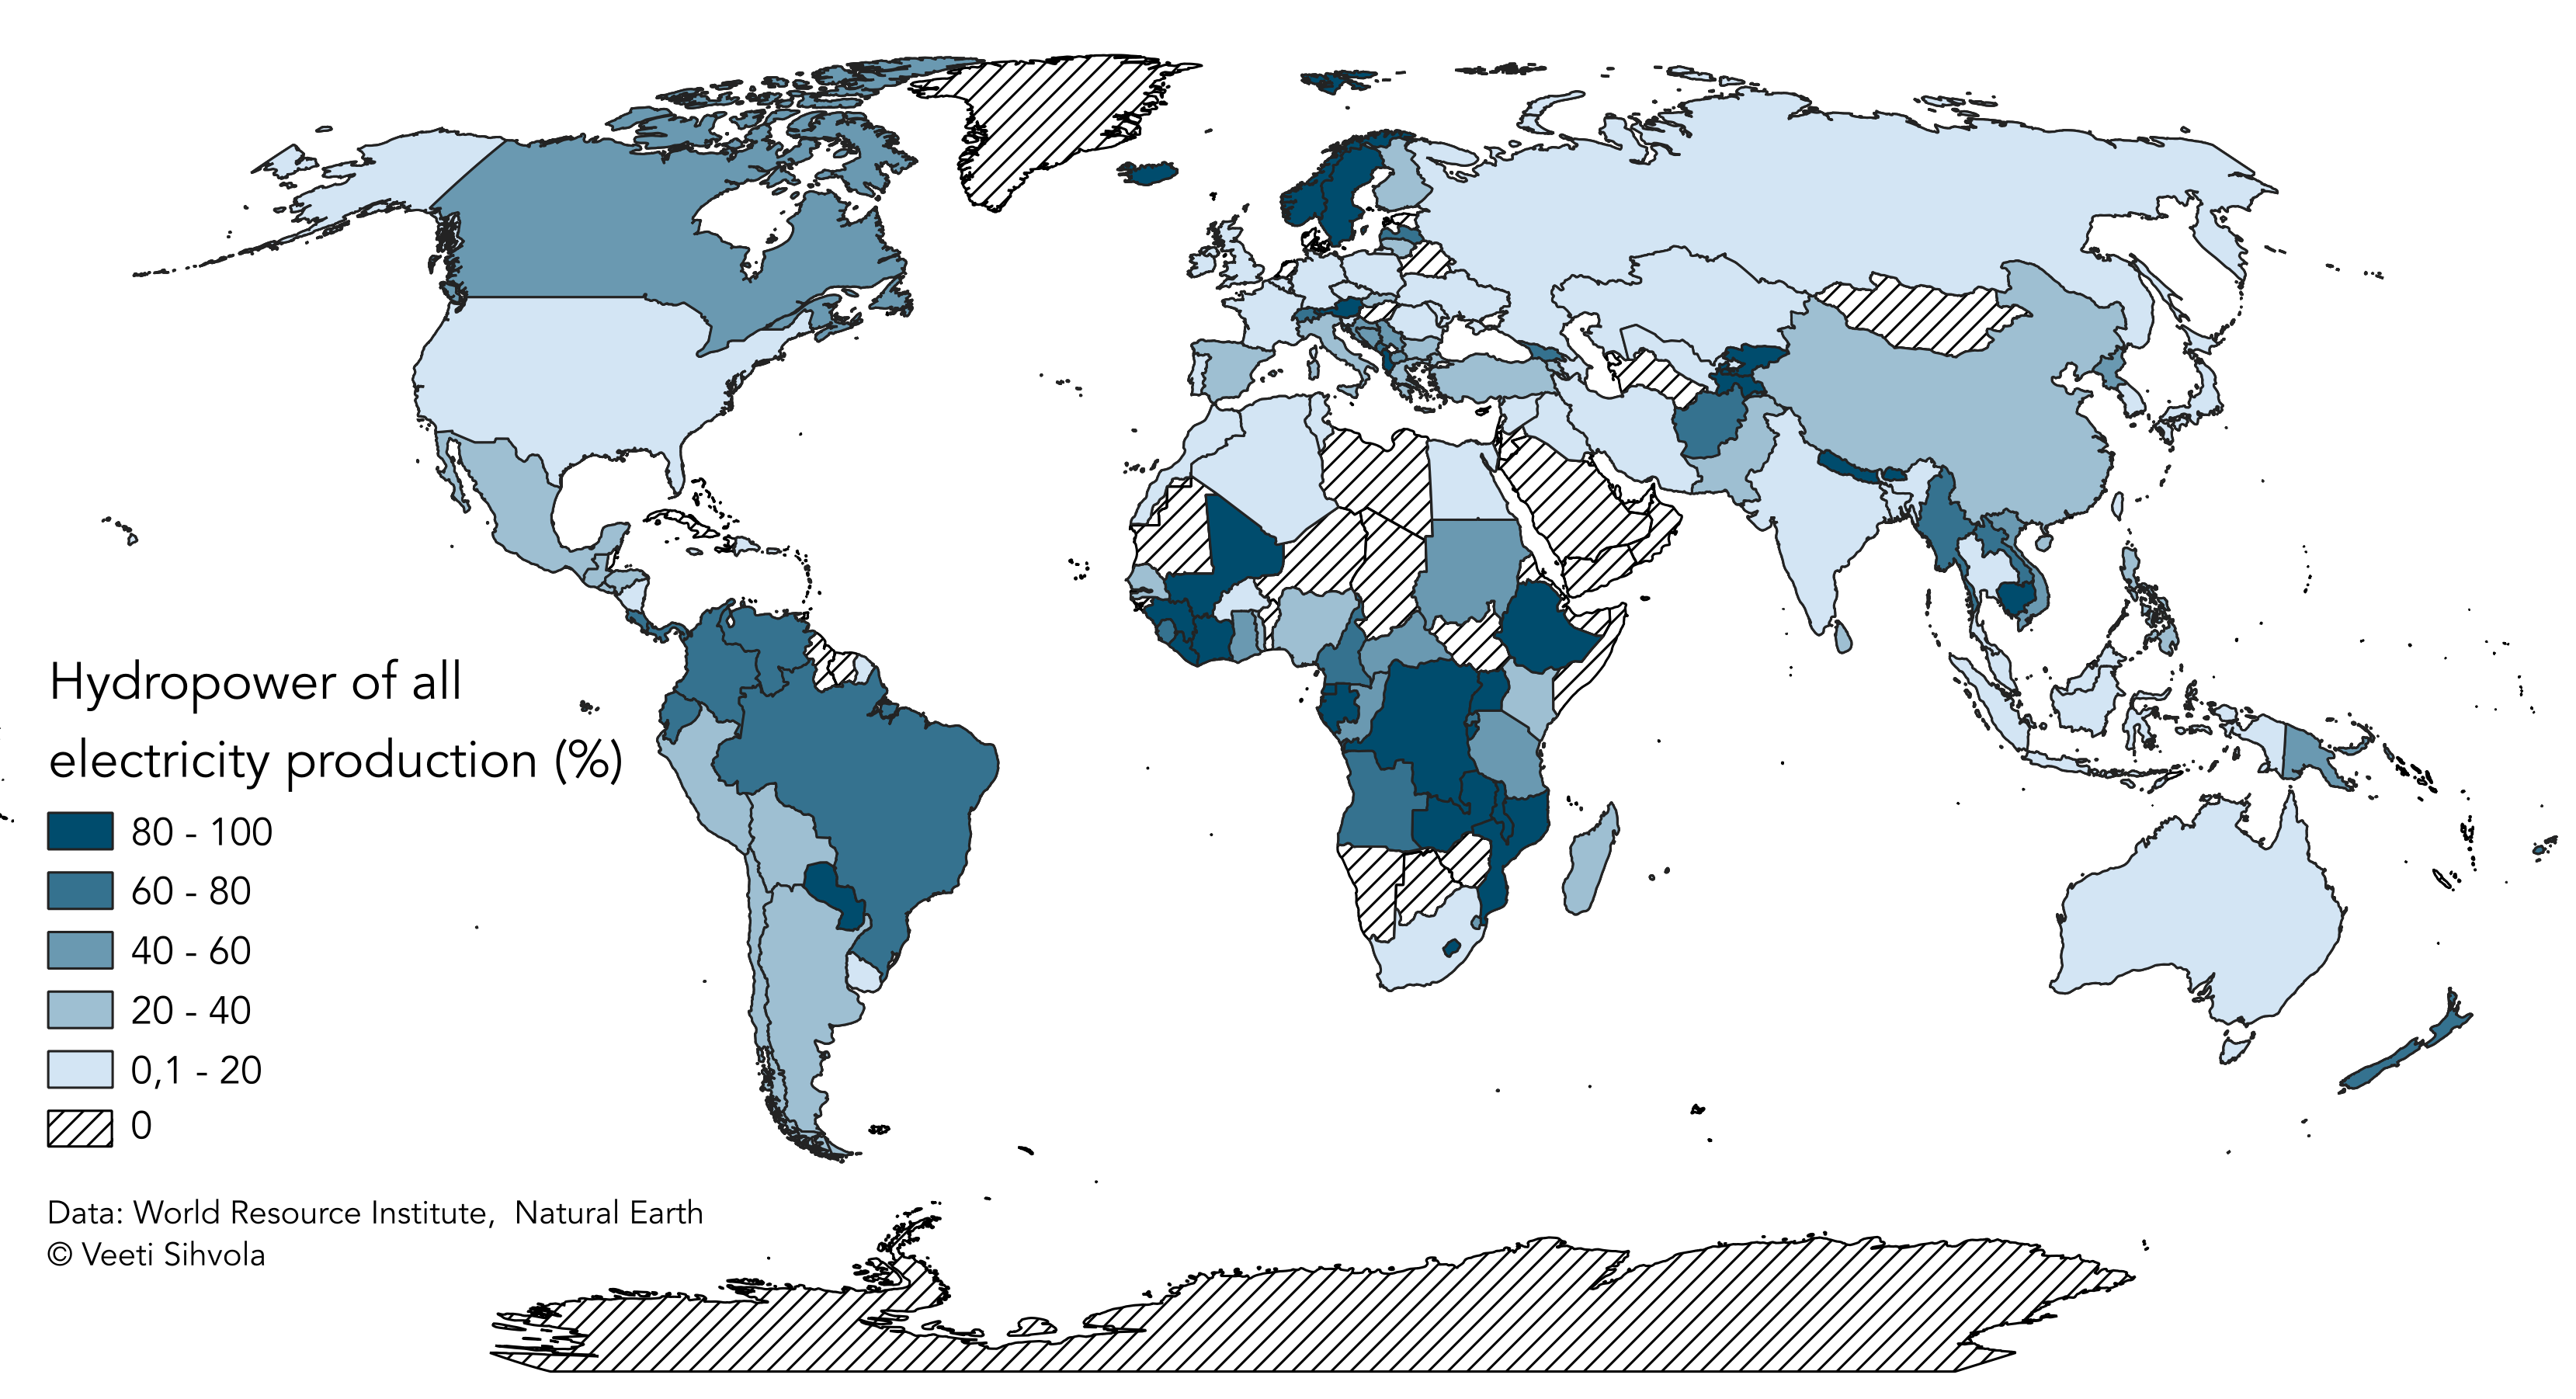
The second weeks map shows how large (or small) a countries theoretical hydropower production is compared to all electricity produced. Notably there are quite a few countries that don’t produce any electricity using hydropower.
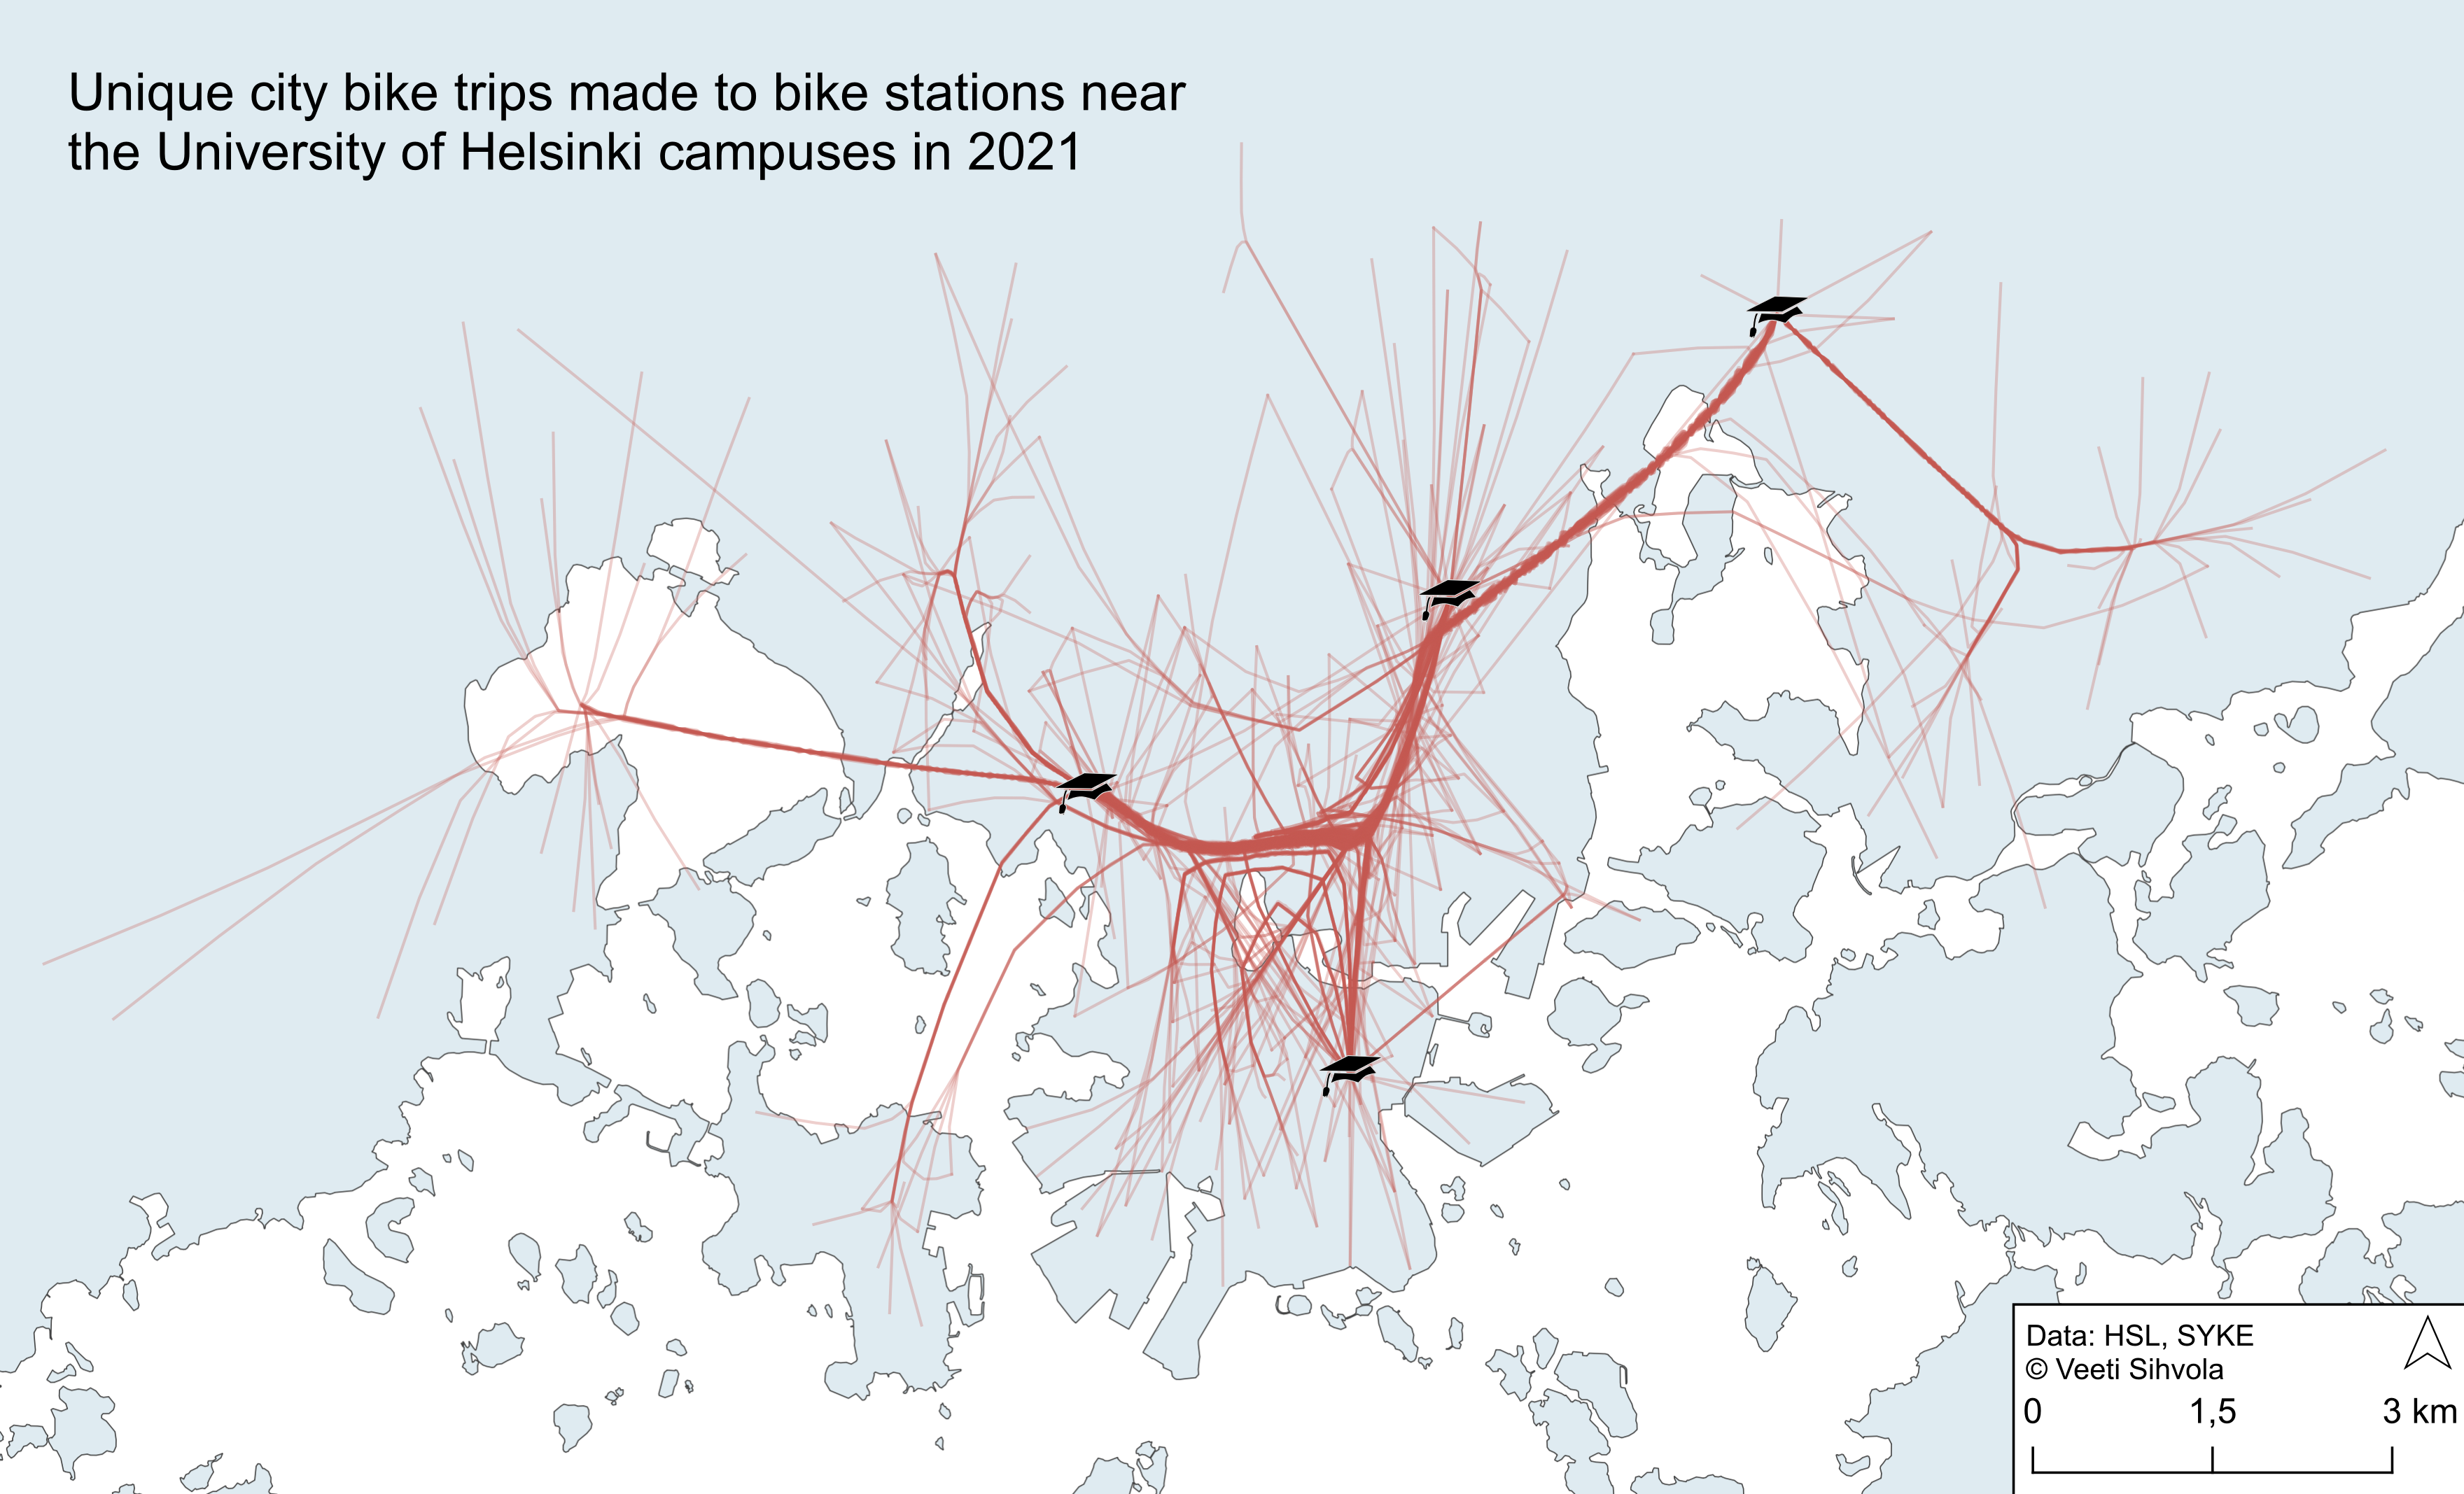
The third weeks map tries to grasp the unique city bike trips that were made to stations near the University of Helsinki campuses. The origin-destinations lines were bundled by an egdebundling algorithm.
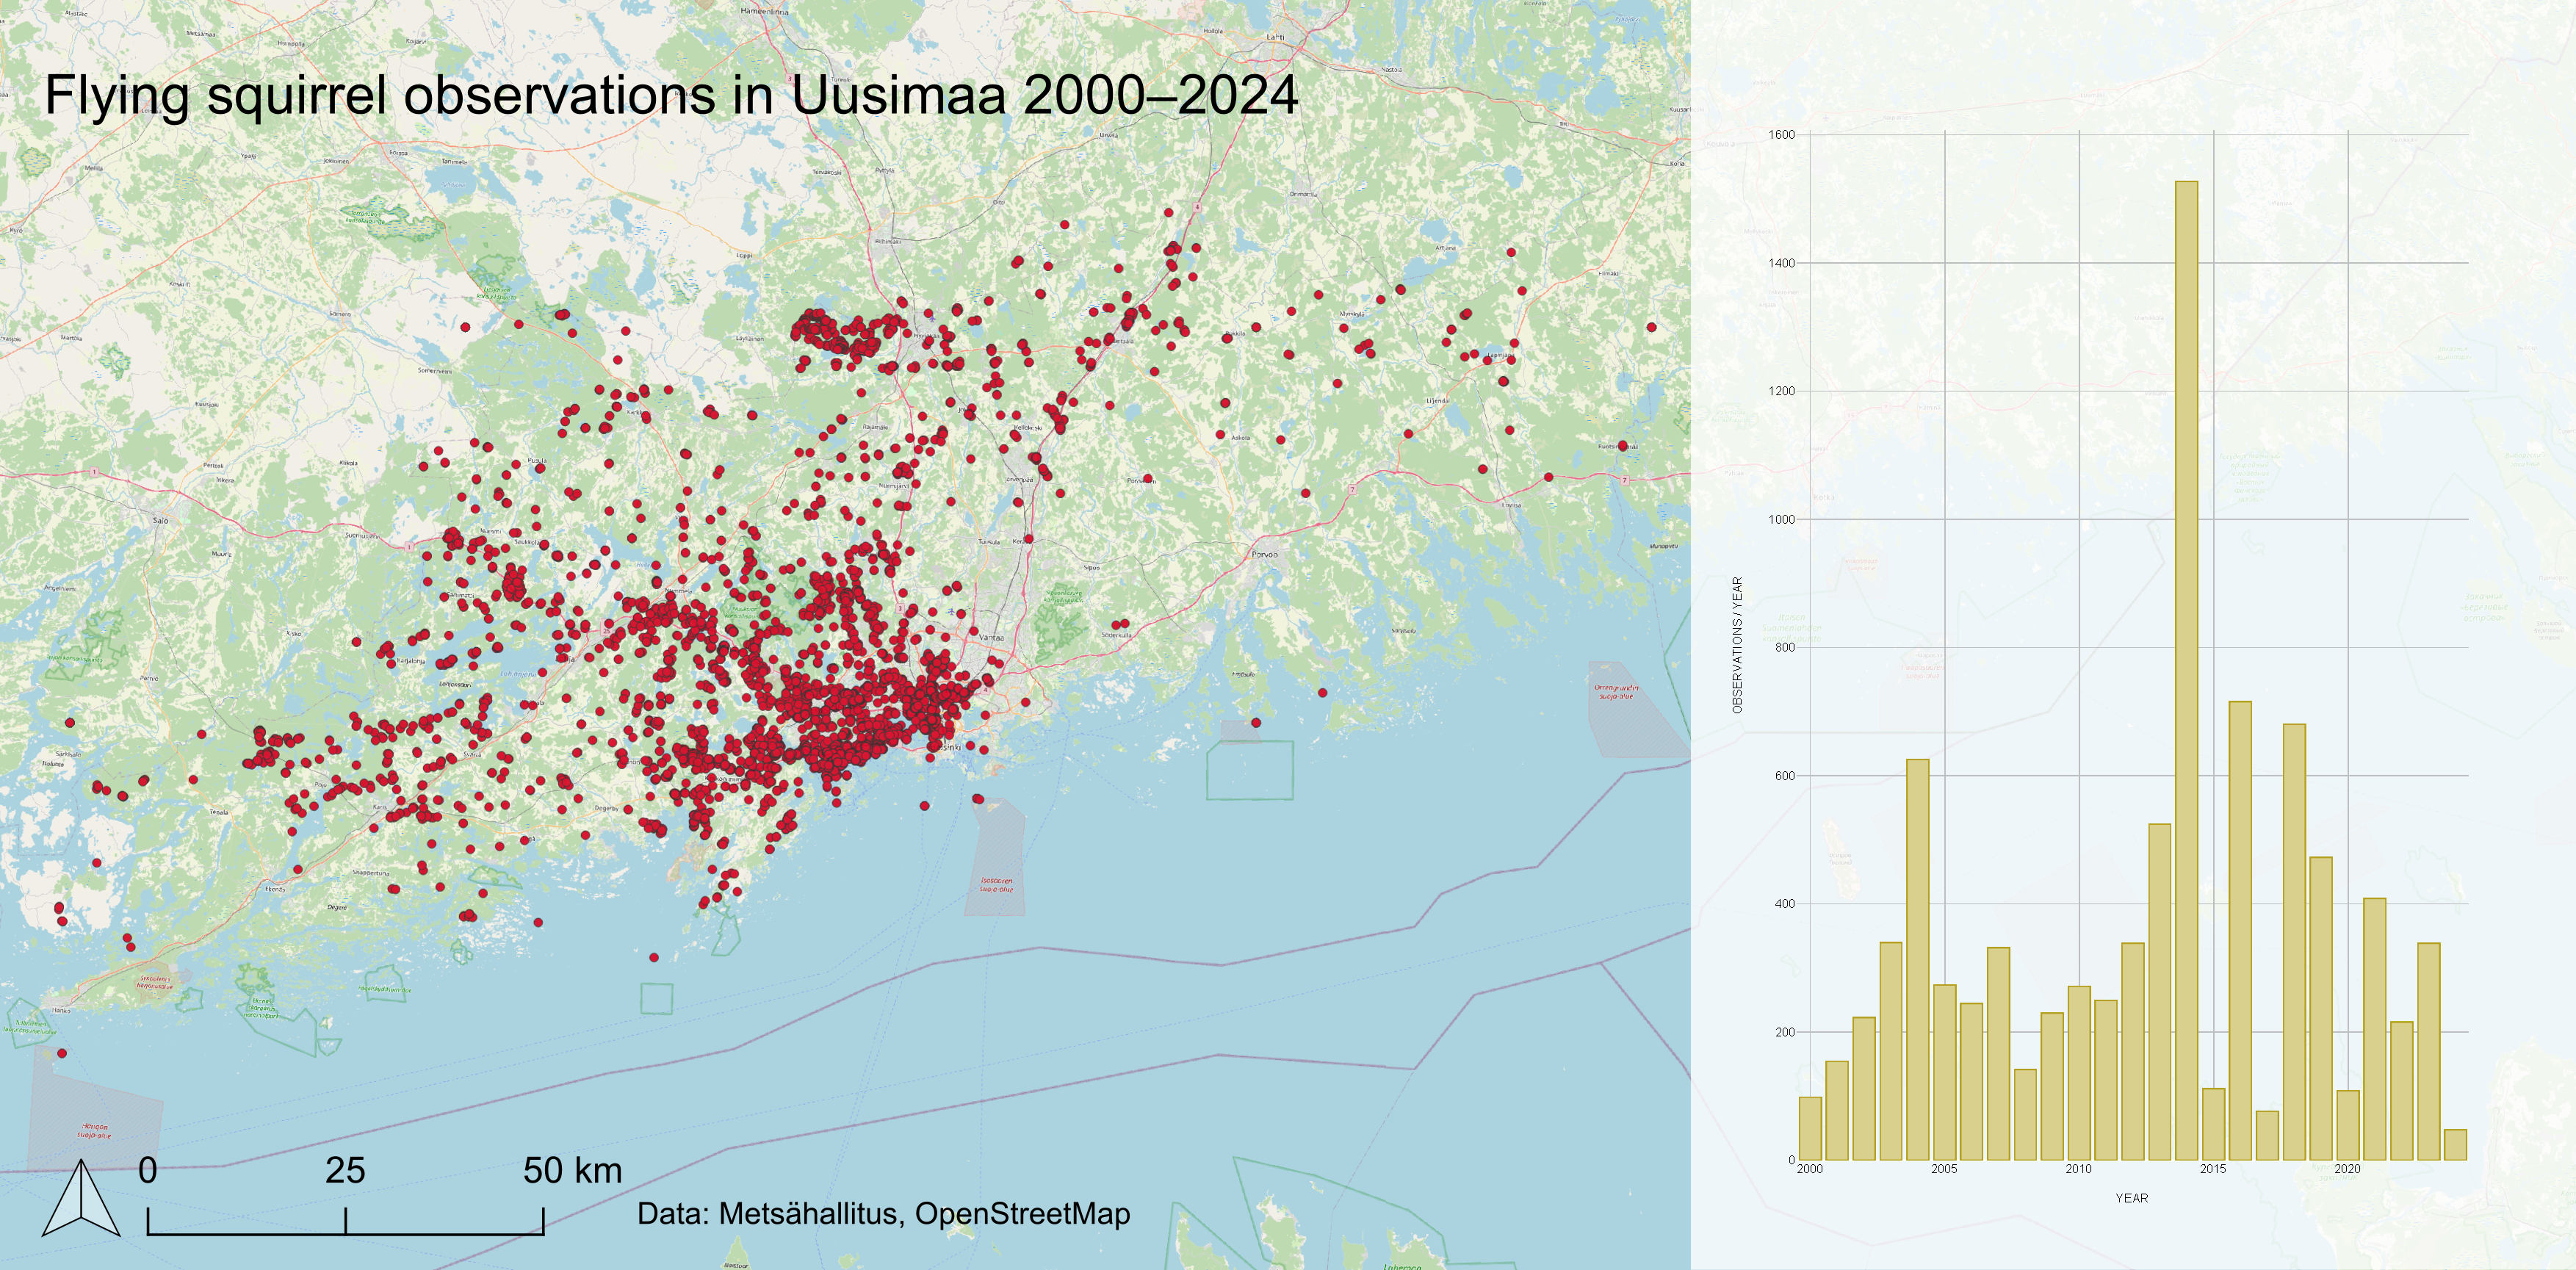
In fourth week I produced two visualizations. The first one includes flying squirrel observations between 2000 and 2024 with a histogram displaying the yearly variation in observation amounts. The second map is an interactive webmap displaying all flying squirrel observations in all of Metsähallitus data from 1853-2024 by municipality. However it only has observations for the Uusimaa region.
Reflection about the course content
During the four-week course I learned more things about cartography and cartographic visualisation than I had anticipated on, which is very nice thing come to think of it! The first week was a bout colors which are very important when building a map from the ground up. Red is especially one of the ’attention colors’ that draws viewers gaze to itself and therefore the colors usage should be considered deeply. Same thing applies to also to the color yellow. Cooler blueish shades are better suited generally to elements where one does not want the reader focusing.
Colors are also muy importante to consider when thinking about the media where the created map is going to be published at the end. Colors printed rarely look the same as in an electronic screen if one has not changed the color space to CMYK from RGB. Also the export resolution and format affect how the map can look, and they also need to be chosen carefully.
Map projects like colors matter very much also as we georgaphers tend to know. All projections have different properties and some are more usable than others, and it very much depends by usecase which is and which isn’t. When projecting the whole world a compromise projection like Winkel Tripel 3 could be usefull, but it would not be suitable for large scale map of Helsinki.
Another important tip is not to overcrowd your map. Usually less is more, and too many elements within a single map can make it difficult to convey the most important message of the visualization. Simplicity is the key. Also it is important to keep the export scale in mind when deciding how detailed map elements to use. If you refer to my week 2 world map I chose to use too detailed world map which makes some islands colors unreadable. I have since learned from this and in the final work chose to use more general base for the maps according to the maps scales.
During the course I also learned many new things that QGIS is capable to. I learned it can do beelines (or great circle lines), webmaps, graphs, edgebundling and even animations and temporary exploration. These new skills have widened my GIS skills a lot. These new skills could be taken further by learning the ways to do it in Python, but that for me is going to be a project for another time. However I noticed that with my limited Python knowledge some operations were so much simpler and faster to execute with Pandas than QGIS. Atleast the Python script does not crash every few minutes…
Final work
For the final work of the course, I decided to take a closer look at of certain animal observations. This animal, or should I say bird, is synonymous with a country like no other animal in the world. This bird symbolizes freedom to the nations people. I am, of course, talking about the Bald Eagle (Haliaeetus leucocephalus) which is the national bird of the United States of the America. The main identifying characteristic of a bald eagle is it’s white head and yellow beak. Since I am an avid bird watcher myself, I would love to one day go to the US and see this glorious apex predator with my very own eyes, and therefore I am here making this analysis, to best idenify where and when would be the best place and time to make it happen.

The bald eagle is a native to the North American region and it’s habitats are found allthroughout the region. Only during the year 2023 there were in total over 768 000 sightings of this majestic bird within the boundaries of the United States out of roughly 945 000 total sightings (GBIF). I am set on going to the United States since this is the only North American country to where they fly direct flights from Finland and it is also the country that is most symbolized by the Bald Eagle. Transfering while flying is always also a pain, especially when you realize at your destination that your bird-watching binoculars were sent onboard a plane to Sydney.
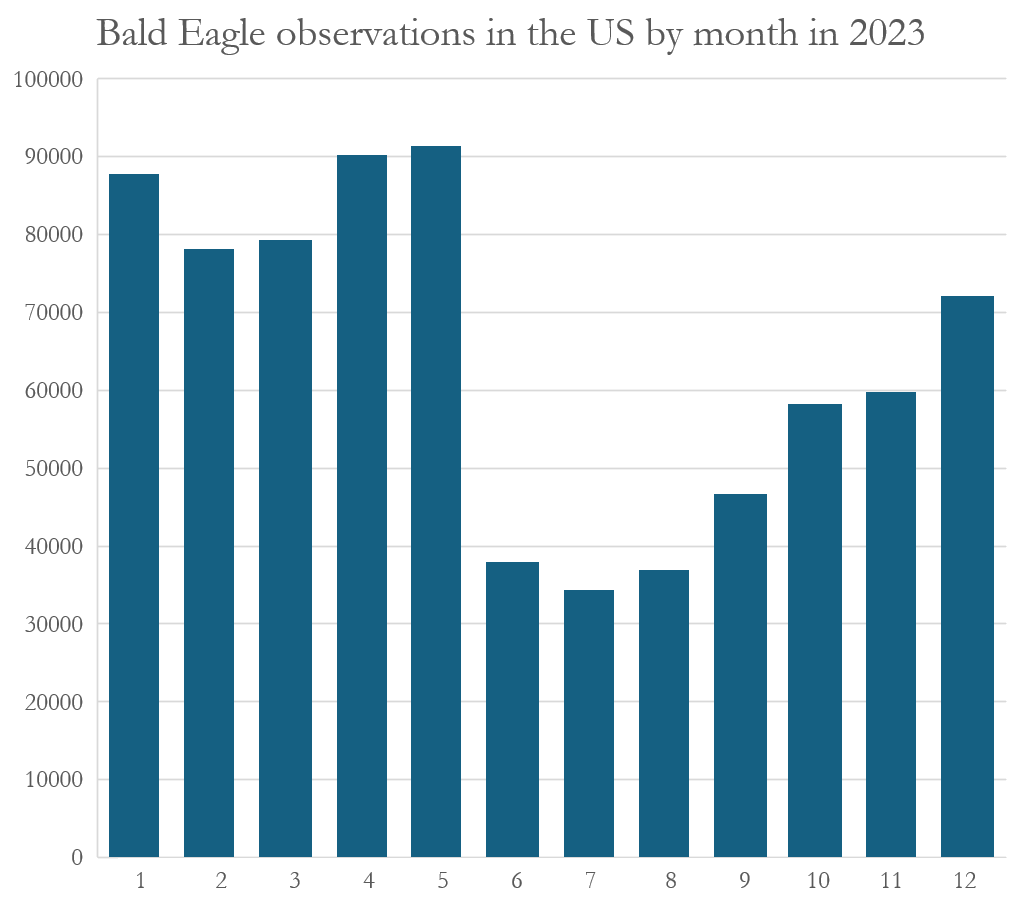
The most observations of the Bald Eagle are usually gathered between the months of December and May (below), so I would propably want to time my trip into that window. But before making any decisions on where I should book my plane ticket, I should first get a closer look at where the eagle can actually be spotted.
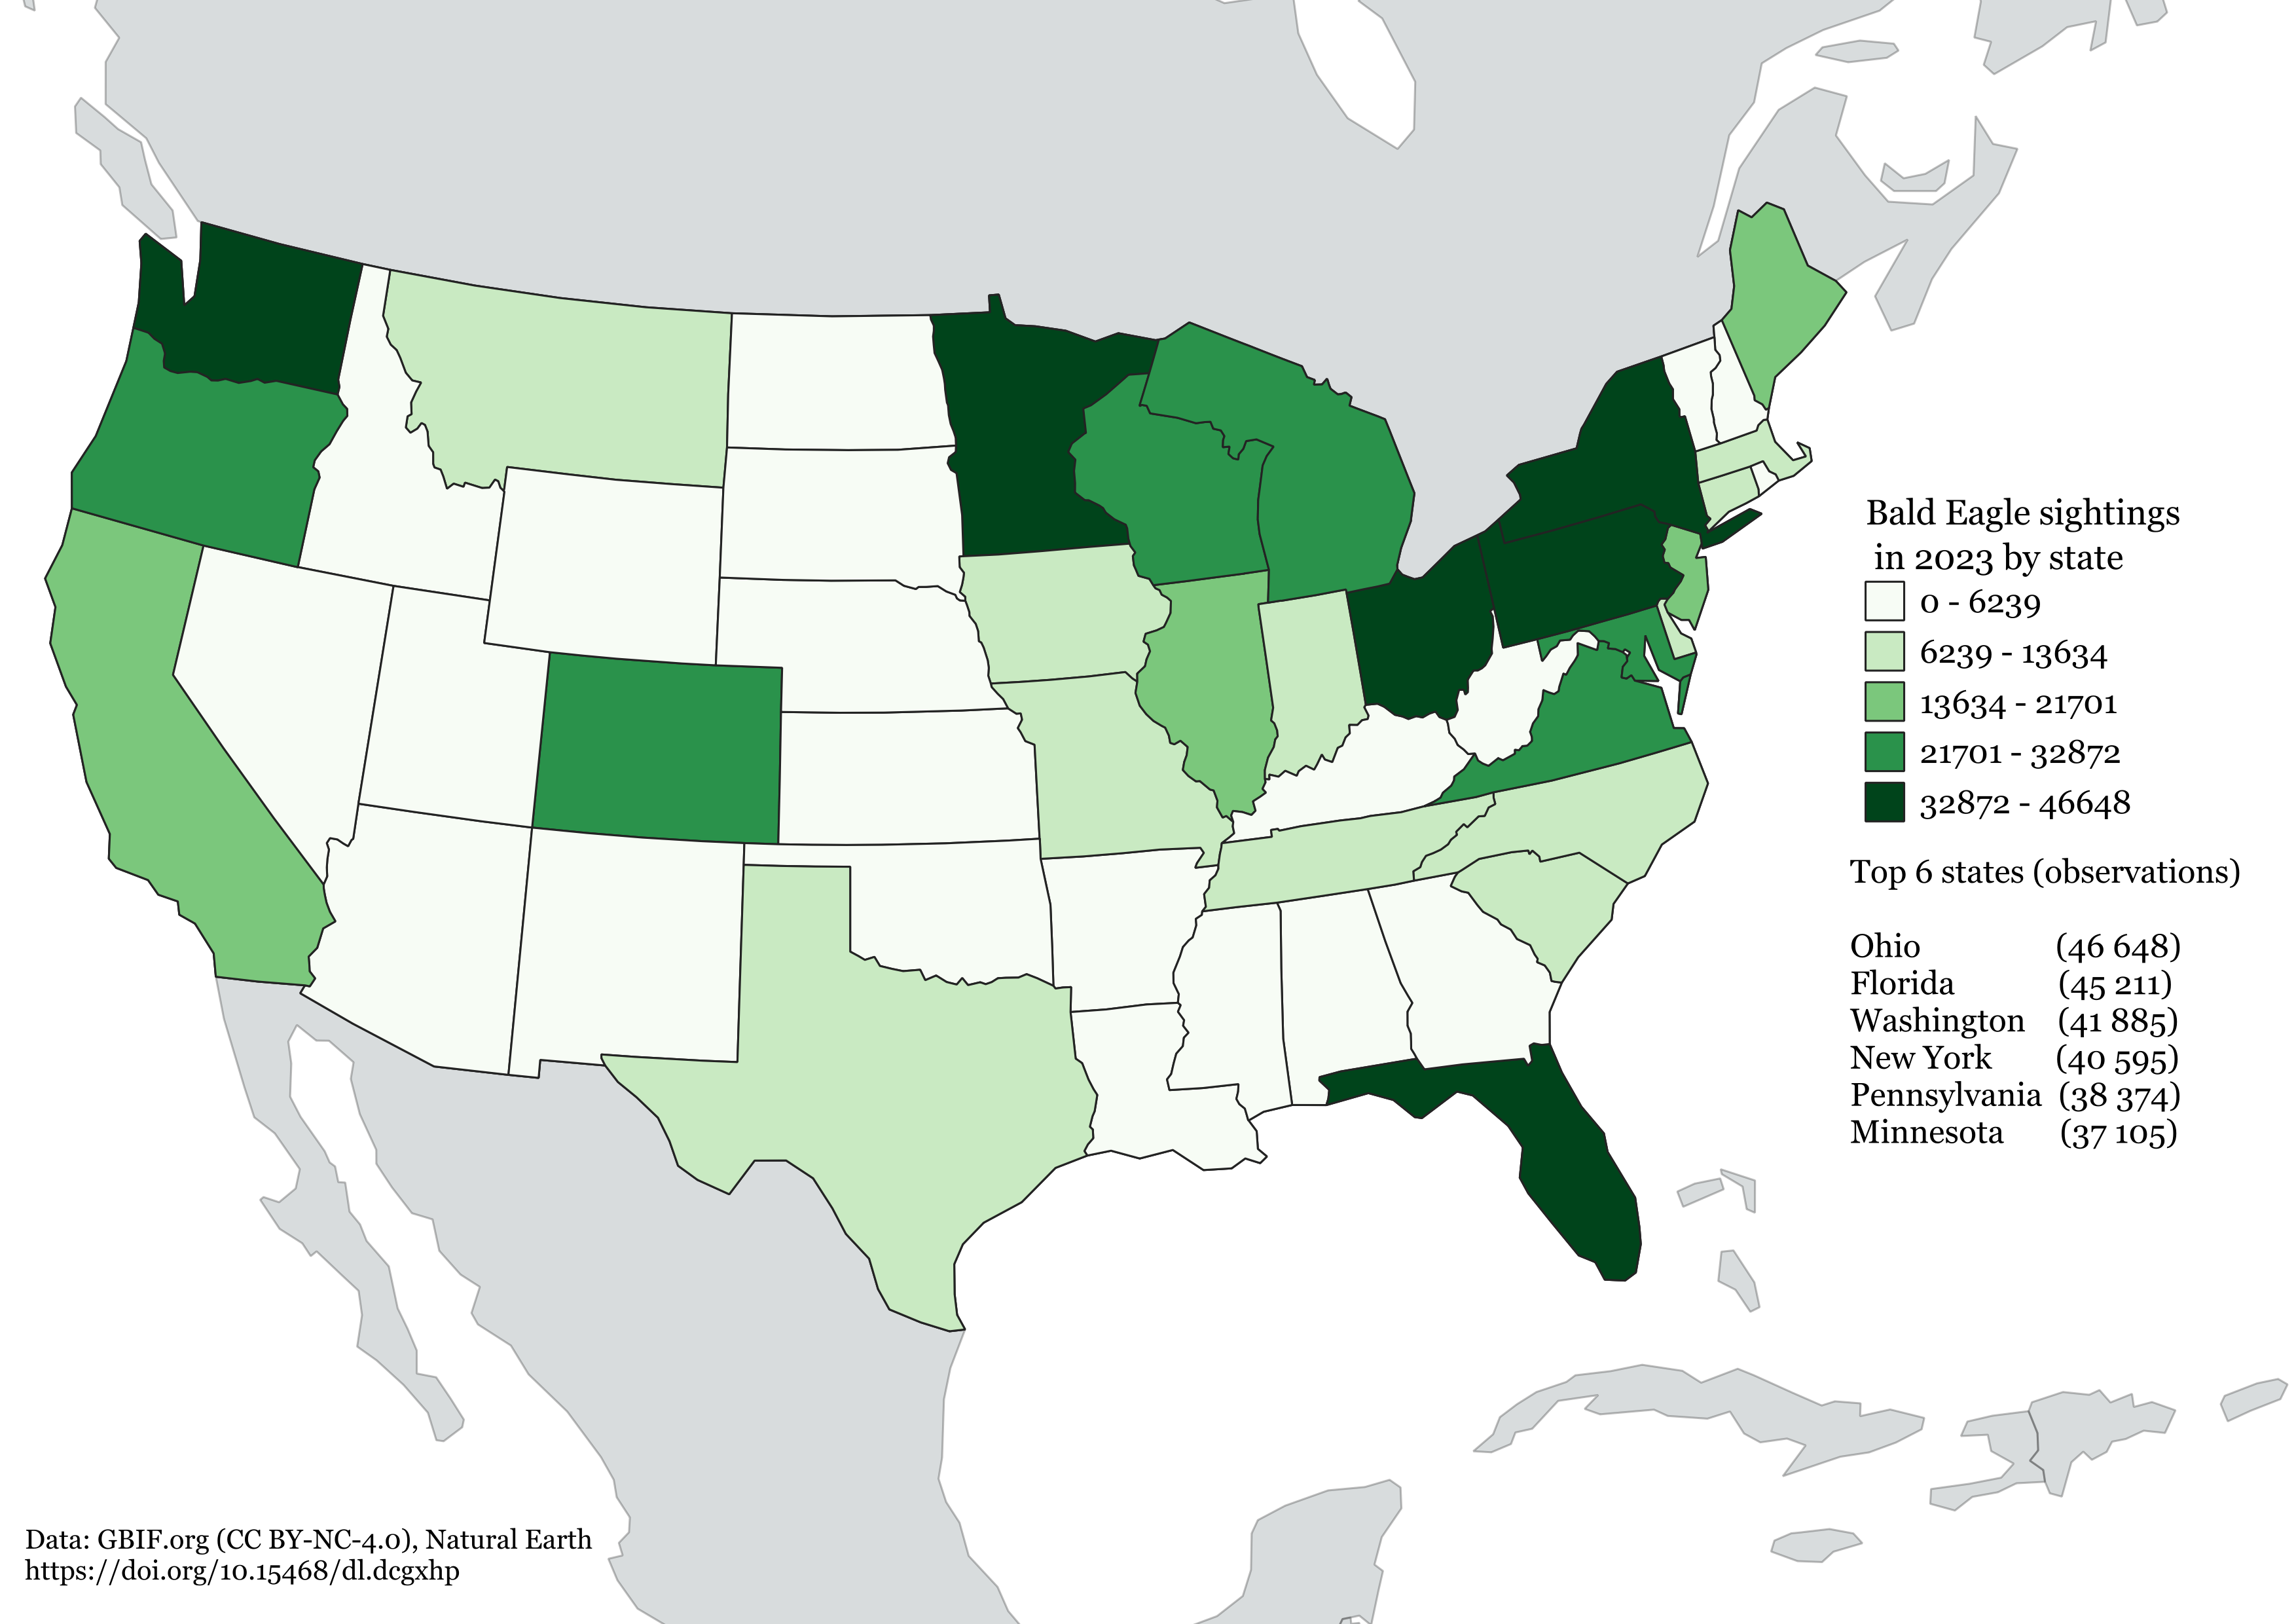
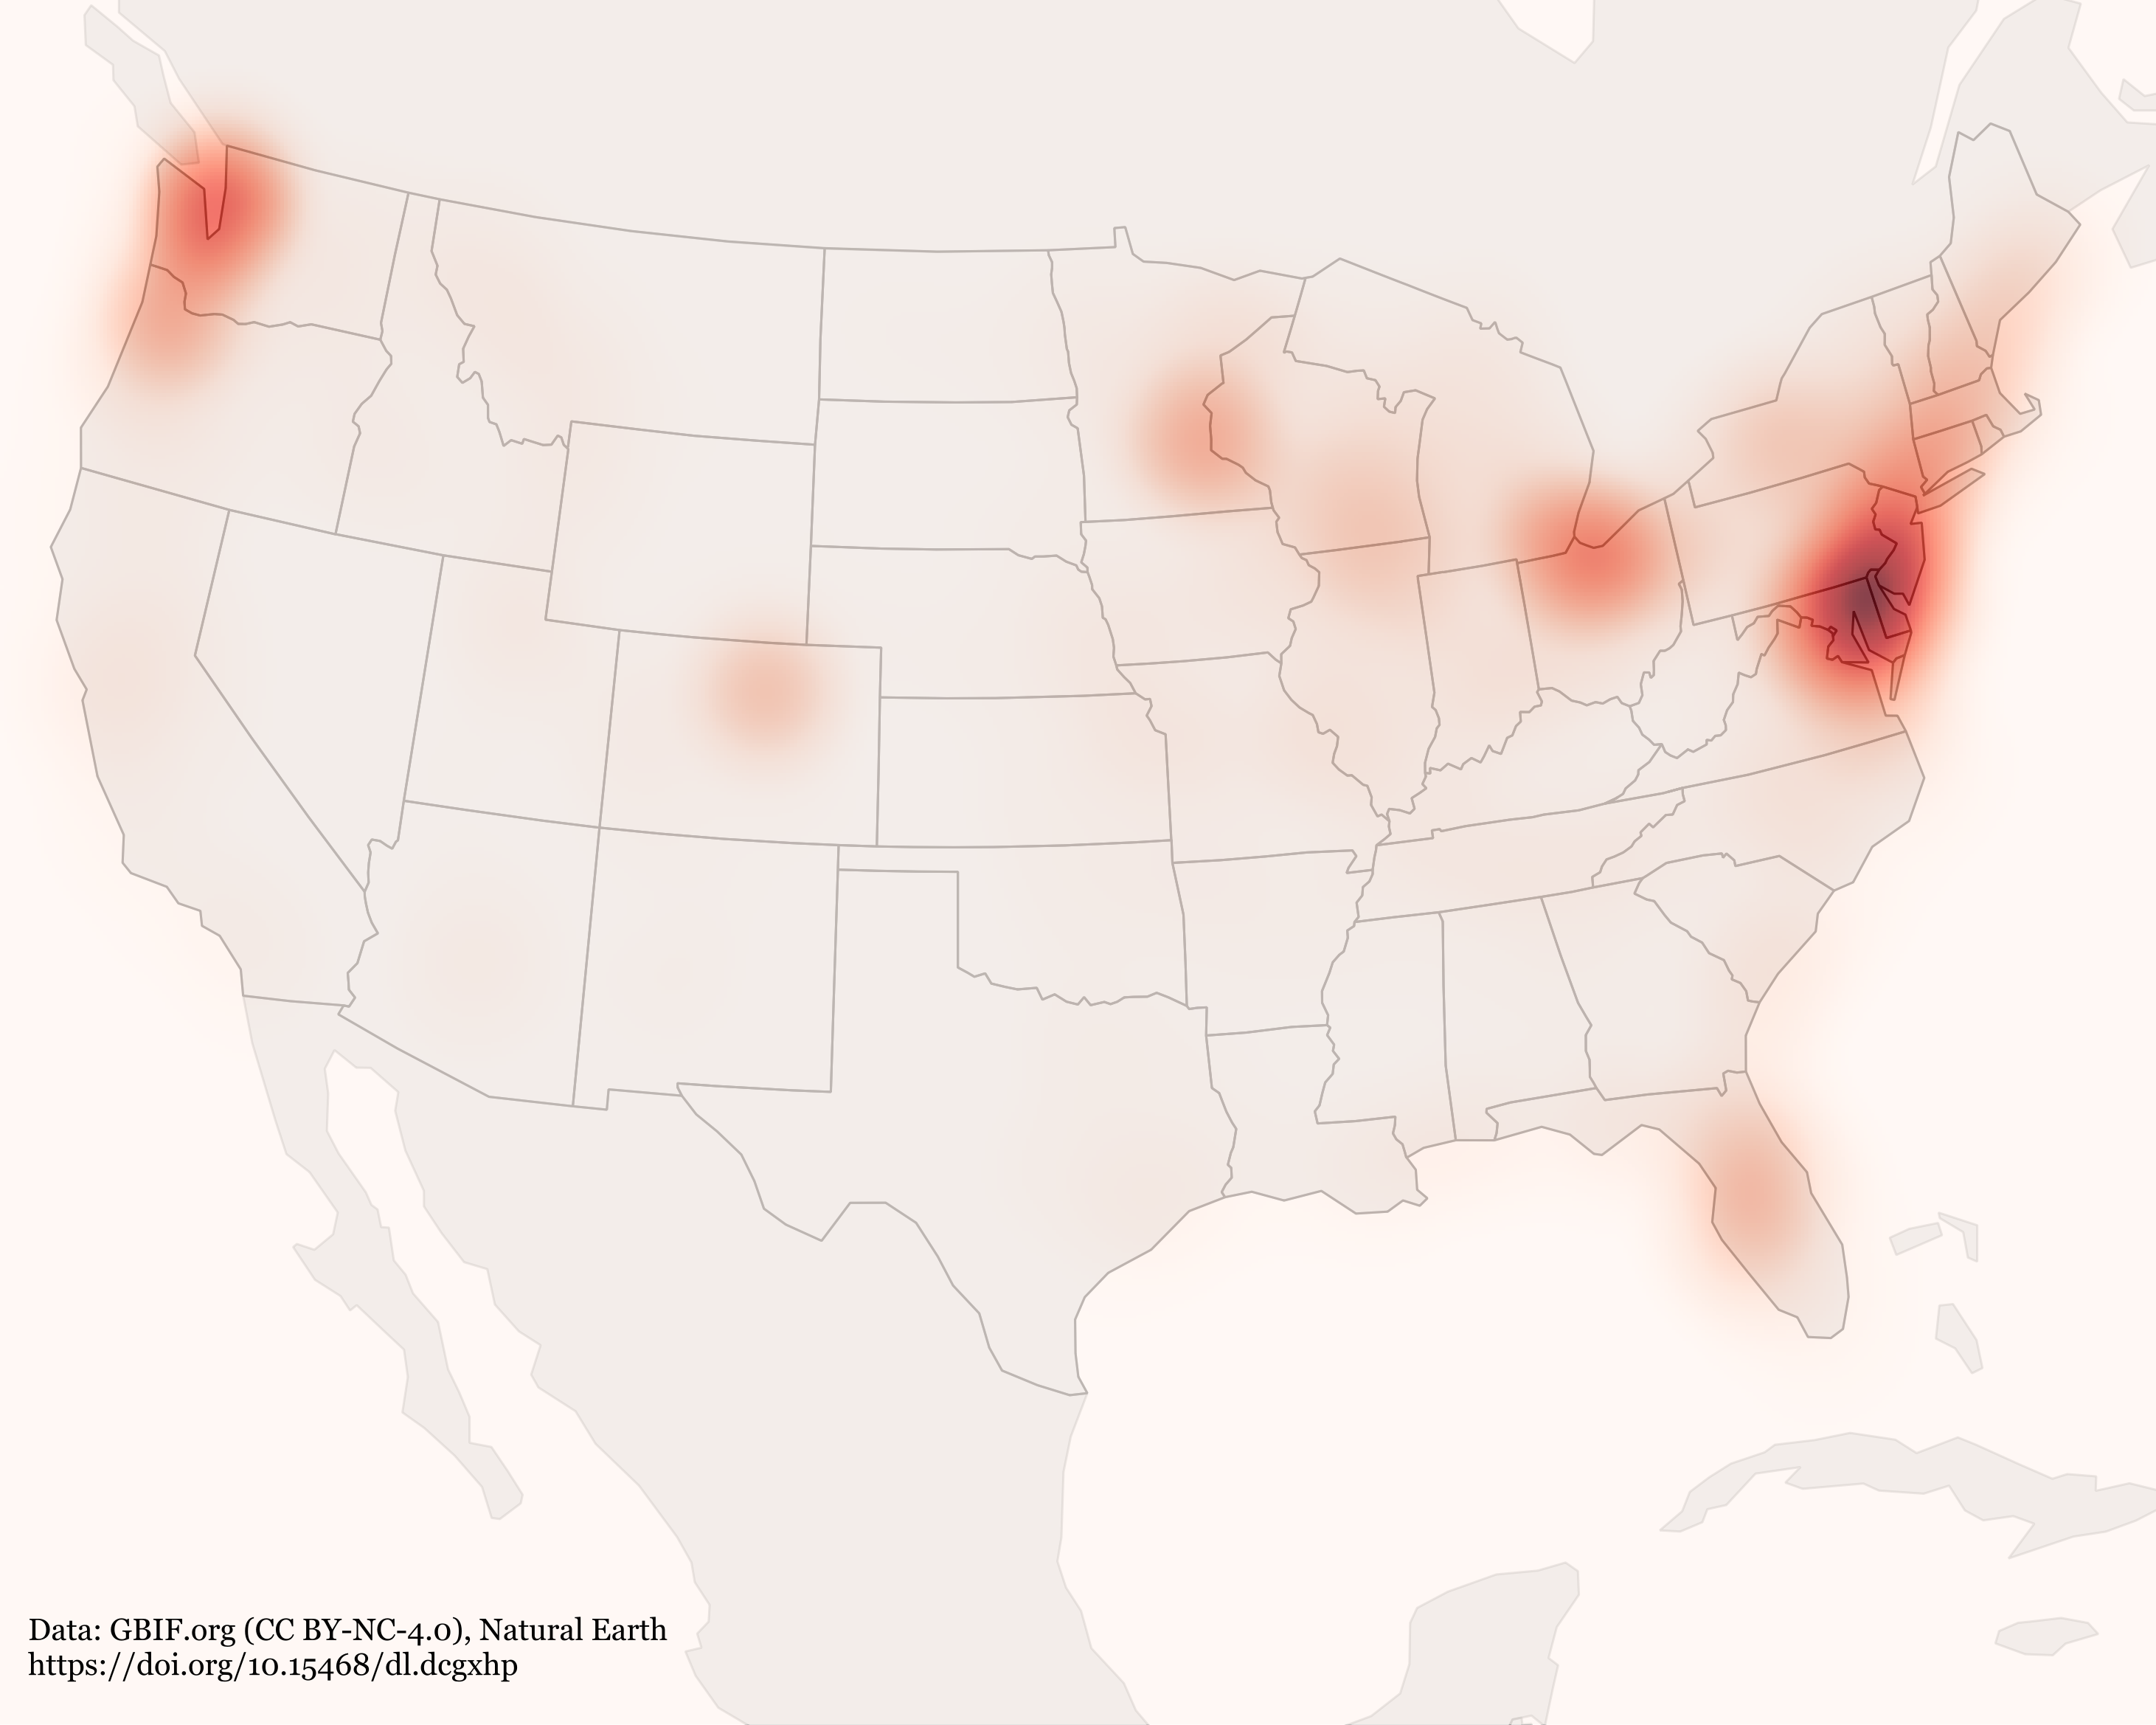
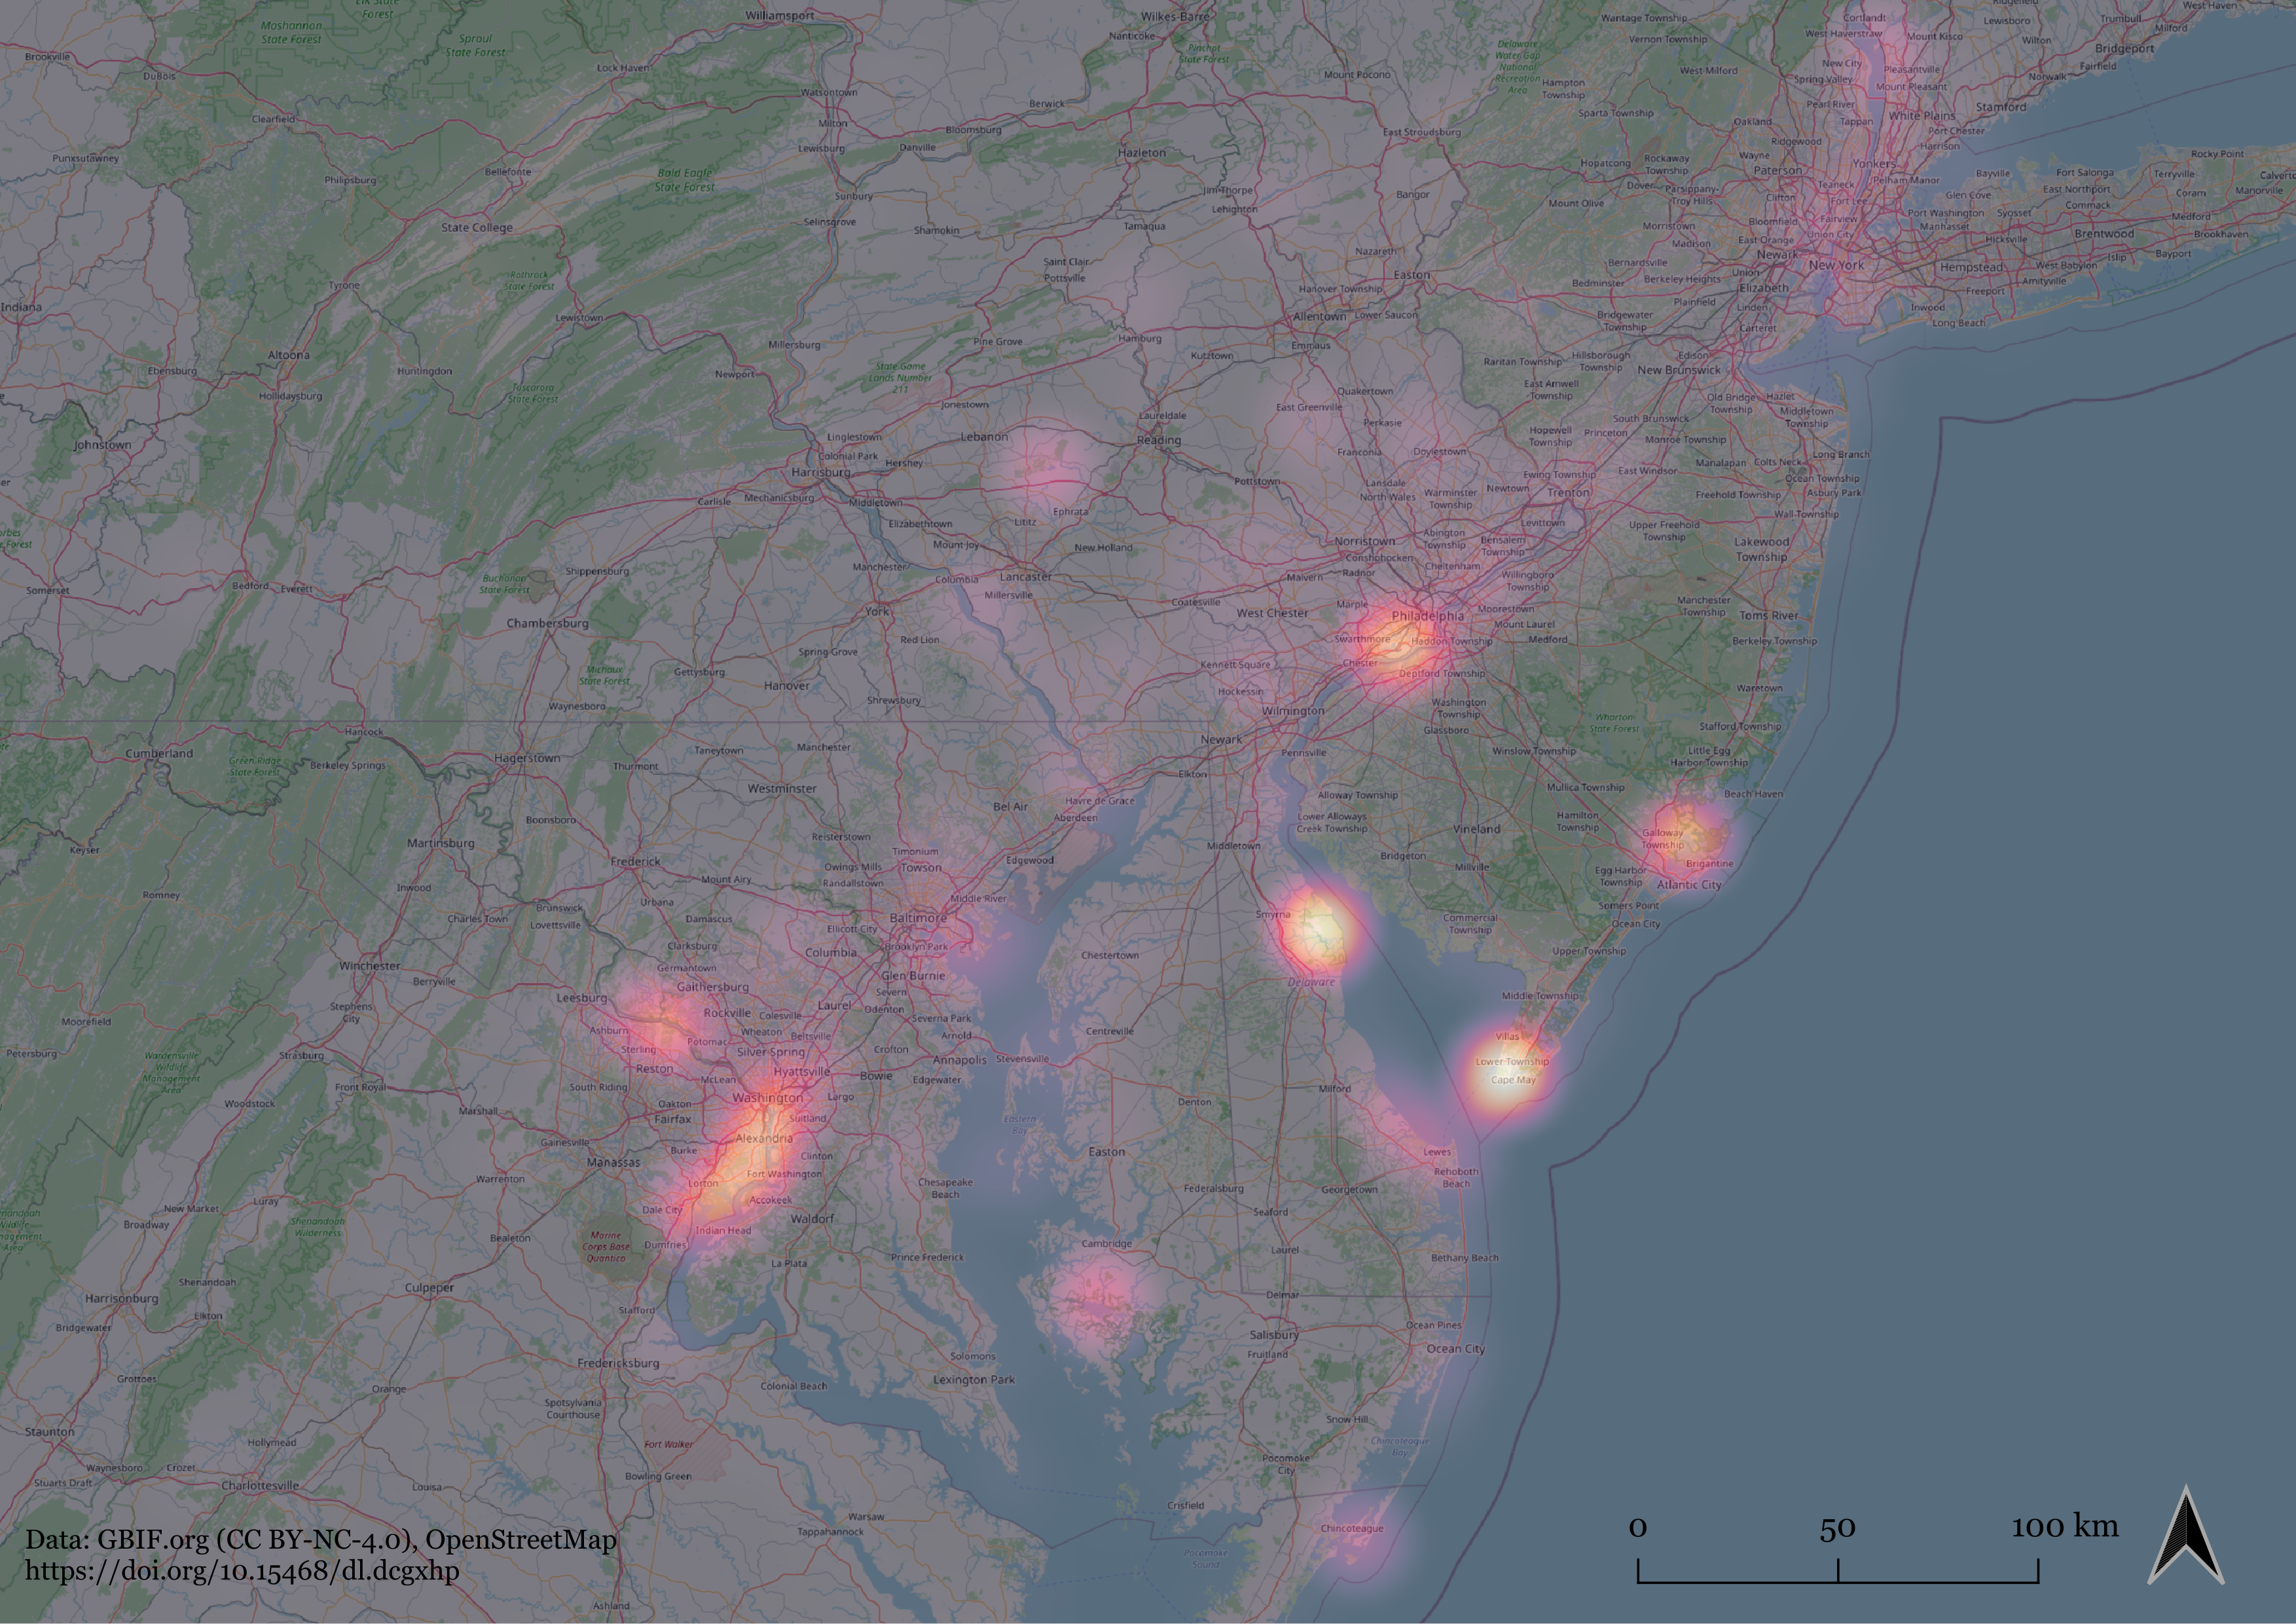
Let’s start by figuring out what are the best states to go if one wishes to see Bald Eagles. According to the map above, the states with the most sightings are Ohio, Florida, Washington, New York, Pennsylvania and Minnesota in that order. This map is very much in line with a heatmap that was derived from all the obervations (below). The largest consentration of observations appears to be to the south from New York in Maryland and Delaware. Another potential concentration of observations lies in the Seattle area in Washington and a third close by to the Canadian border in northern Ohio.
Finnair flies direct services from Helsinki to New York, Washington and Chicago that are relatively close by to the hotspots of observations. In my analysis I am really trying to find a place that has a large amount of observations in a relatively small area to really highten my changes of seeing the Bald Eagle. Let’s take a look at these hotspots more closely so I can decide where should I actually go.
The hotspot in Ohio
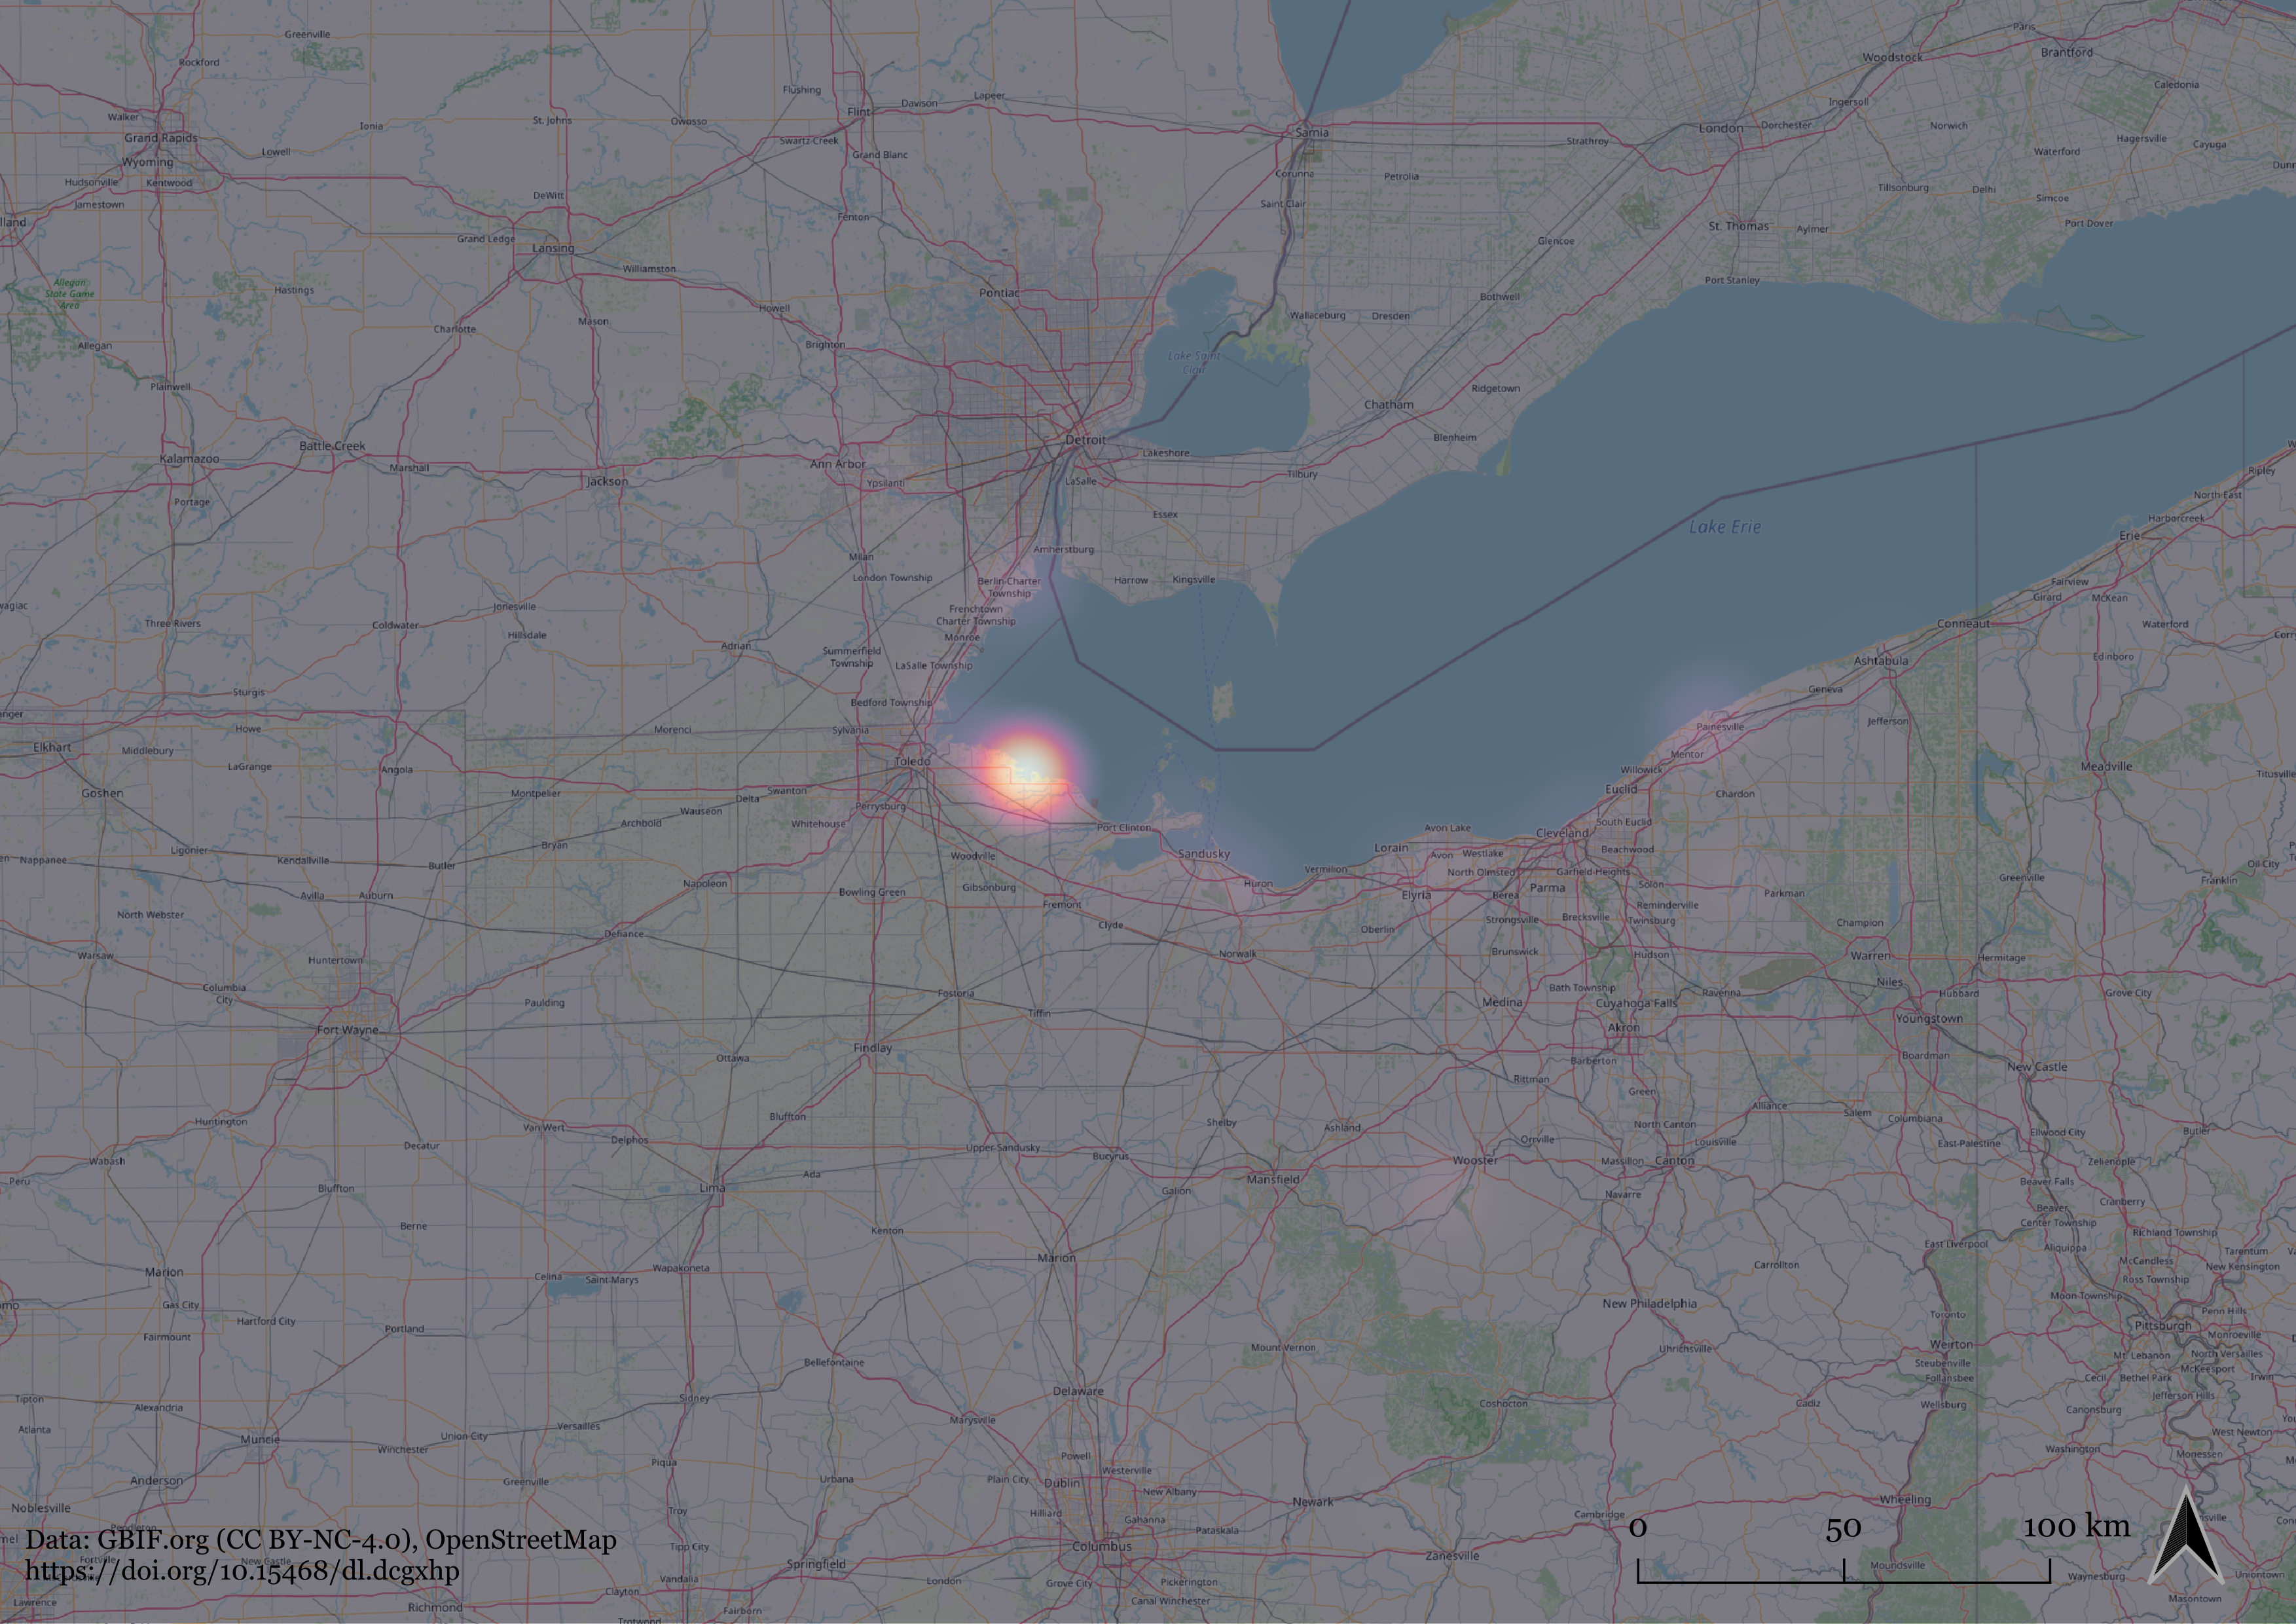
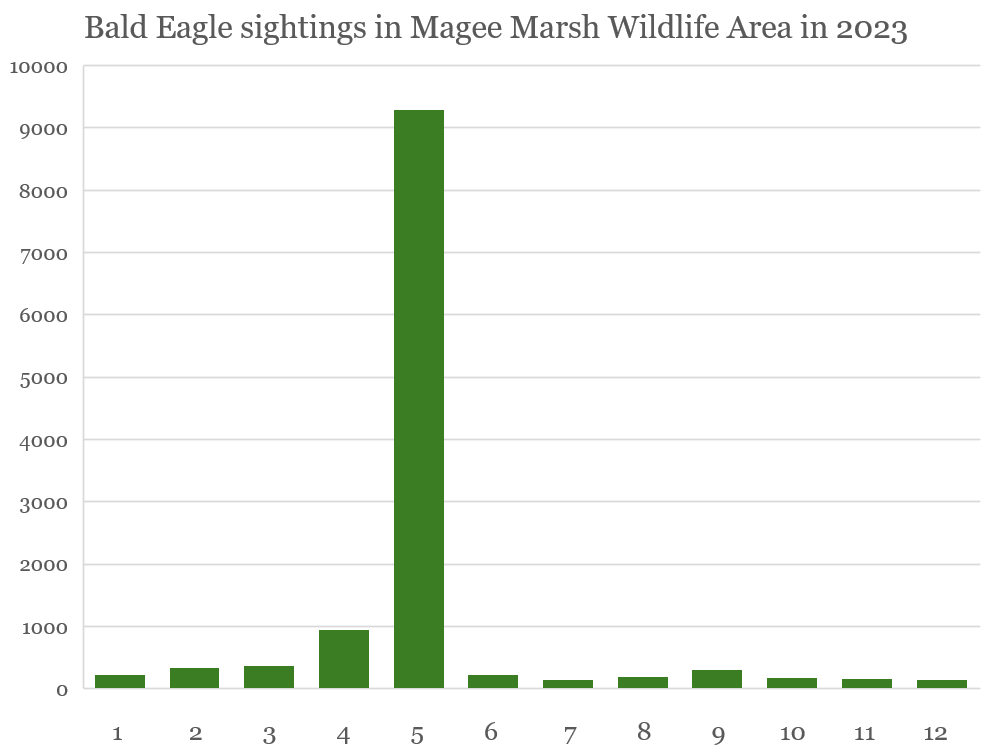
The hotspot of observations in Ohio is located in the border area of the Lucas and Ottawa counties, around 30 kilometers east from the city of Toledo (above). In this area there lies the Magee Marsh Wildlife Area. Only within this 35km^2 area over a fourth of Ohios Bald Eagle observations have been gathered (12 531 or ~27 %).
Within the wildlife area the observations are by far the densest in May with over 9000 observations within the month (below). That is roughly 300 observations per day, which at least to me seems very promising place to go to see eagles. In the wildlife areas website they also highlight that many different bird species can be observed there and visitors have been reporting great facilities. The wildlife area has also gained a whopping 4,8/5 Google rating highlighting the places greatnes.
Average direct Finnair ticket to Chicago is around 650€ for a round-trip in may 2025. From Chicago it is relatively short 4 hours drive to Toledo, OH.
Summing up Ohio
Best month to visit: May
Theoretical obs. / day (May) : ~300
Distance from airport: ~4 h
Price of plane tickets: ~650€
The hotspot south of New York
The largest group of observations according to the nationwide heatmap lies to south of New York. The one huge hotspot has now been dissolved to multiple smaller one (above). Especially the two hotspots (one in the middle and second around 50 km SE from the first one). These two areas appear to be the best places to see eagles in this part of the country.
The first hotspot in the middle is located in the Bombay Hook National Wildlife Refuge in Delaware. The second hotspot is in the Cape Island which is in the souther tip of New Jersey. For the followup analysis I have chosen the Cape Island since there have been more overall observations in a smaller geographical area compared to Bombay Hook.
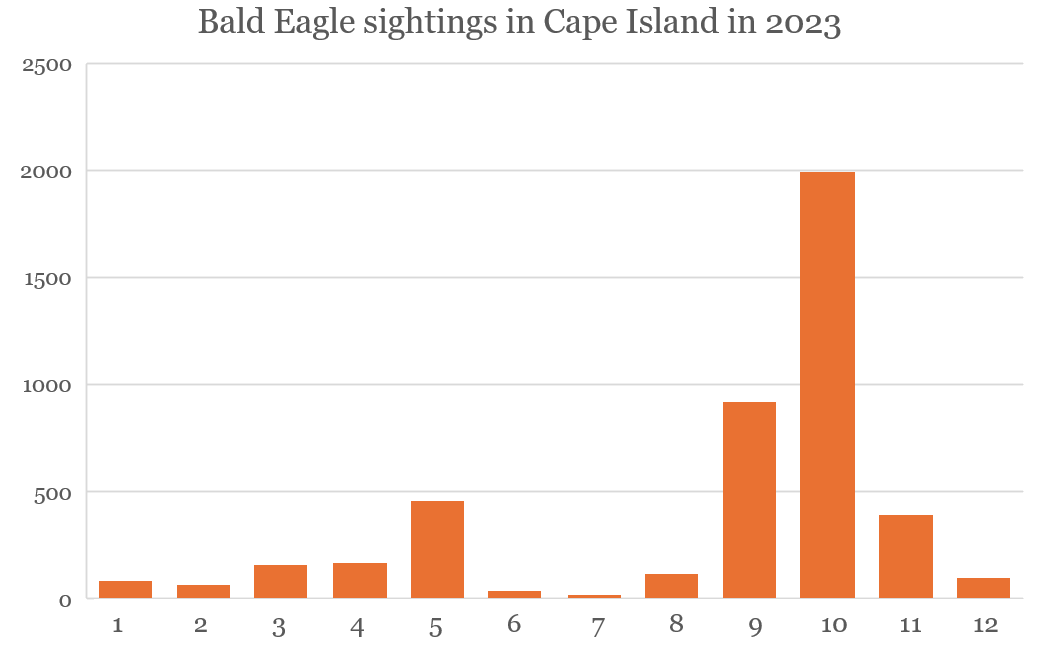
Cape Island, NJ is a small island, around 27 km^2. In the island there are residential neighborhoods as well as multiple state parks and relatively large Higbee Beach Wildlife Management Area. Total observations in the area from 2023 were 4524, which is significantly less compared to the counterpart in Ohio. The monthly distributions of observations is also more widespread this time October having the largest share with close to 2000 observations which is roughly 65 observations per day falling short yet again.
If one still wants to go to Cape Island, one must fly to New York. The price of the plane ticket with Finnair is similar with 650€ for the round trip, but with the flight being 30 minutes shorter, and the drive from the airport also 1 hour shorter.
Summing up Cape Island
Best month to visit: October
Theoretical obs. / day (October) : ~65
Distance from airport: ~3 h
Price of plane tickets: ~650€
The hotspot in Washington
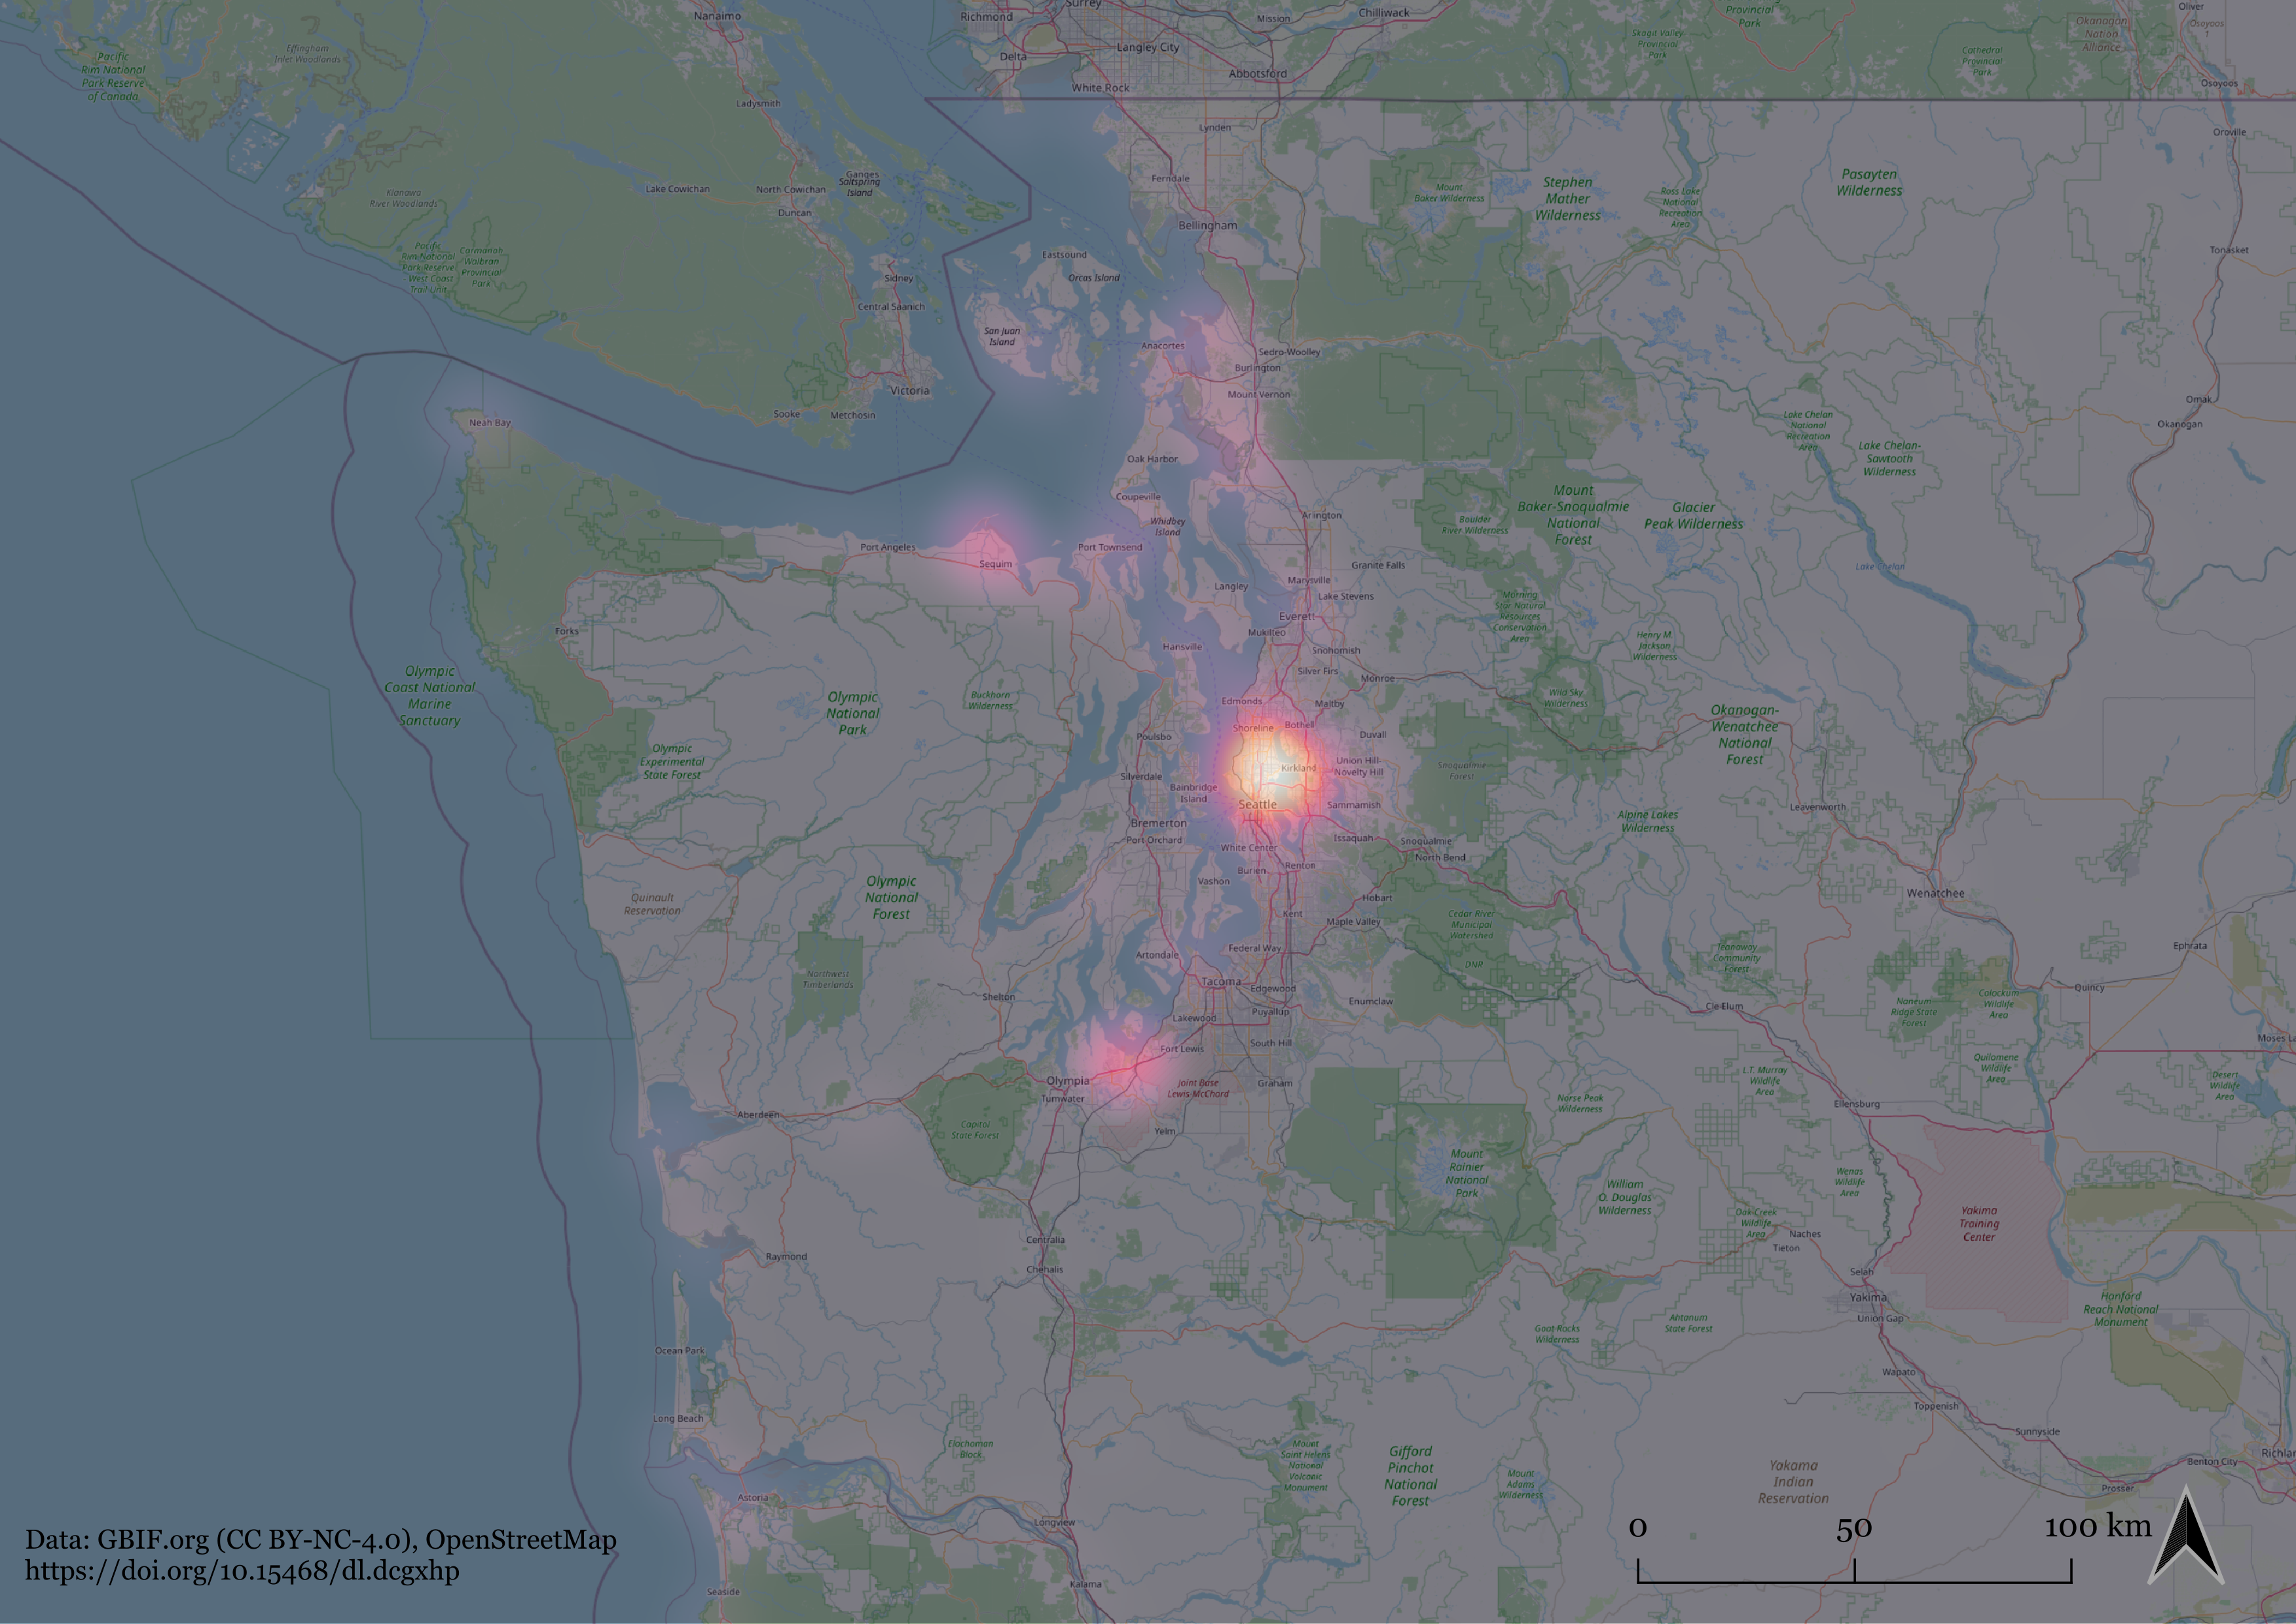
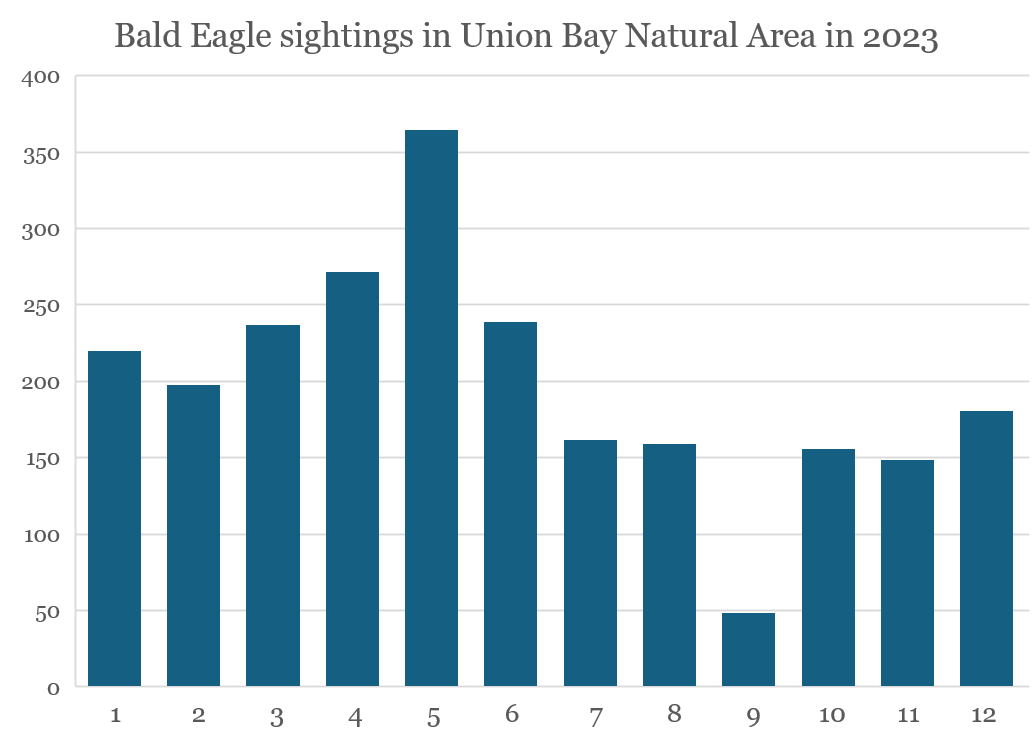
Last one of the three biggest hotspots appears in Washington state (not to be confused with Washington D.C.) close to the city of Seattle, the states capital. Infact the hottest spot is in central Seattle which makes it different compared to two previous candidates and their more remote locations (above). The main area where the sightings are from is only 0,5 km^2 making it smallest of the ones covered. This again is a natural conservations area and called the Union Bay Natural area.
Central city location makes the park ideal for a birdwatcher who also likes to take into a big city. It also makes it very easily accessible. But sadly the Area lacks in a major way for me, and that is the low amount of sightings with only 2387 making it again lowest of the three. The ’hottest’ mont for spotting eagles is again May which is the same as Ohio. However the average daily sightings during may is only around 12.
Finnairs direct flights to Seattle cost a whopping 750€ for a round-trip making it also the most expensive destination. However the drive to ’see the eagles’ is only 30 minutes.
Summing up Seattle
Best month to visit: May
Theoretical obs. / day (May) : ~12
Distance from airport: ~0,5 h
Price of plane tickets: ~750€
Comparing available options
All the three locations discovered and analyzed appear quite appealing to me with all having different pros and cons. Some of the locations are more accessible and some more remote, which may need access to a car. All three cities are large and have their fare share of attractions and interesting things to see. Lets do a quickc comparison:
Ohio pros:
- By far the most eagle sightings
- Possibilities to spot a lot of more species as well
- Relatively affordable
- Chicago style deep dish pizza
- Highly rated natural reserve area
- Temperarutes of 22 degrees Celsius tops
Ohio cons:
- May require a car to visit
- Distance from airport is the longest
- Summer time weather can be hot
New Jersey pros:
- Second most eagle sightings
- Relatively affordable
- Manageable temperatures in October
- New York with all its attractions
- $1 pizza slices in New York City
New Jersey cons:
- Relatively remote location = car?
- Distance from airport still quite long
- Close to Atlantic City = gambling
Washington pros:
- Area in Seattle city center = accessible without car
- Only 30 minutes from the airport
- Cool temperatures in may (around 17 degrees Celsius)
- Operated with Finnair A350 compared to A330 for other two destinations
Washington cons:
- Sparse chance of seeing Bald Eagles, which is the main point
- Very small natural area & low chance of seeing other species
By concluding the analysis, the Ohio destinations seems the best of the bunch. It seems the best option having the largest natural area where an avid finnish bird watcher can surely see many many new birds that do not appear in the northern Europe including the Bald Eagle with relatively high chance. This bird watcher also likes to watch the big metal birds, and Chicagos airports being the busiest of the bunch offer that ability as well including the best pizza invention ever, the Chicago style deep dish pizza (below). Now that it is settled, I can start to plan my trip to Magee Marsh Wildlife Area in a more detailed way, and I have plenty of time to do it before the next May comes around. I hope that my exploratory analysis gave you, the reader, as well some key tips on where to see the majestic Bald Eagle within the United States.

Deep dish pizza, https://www.flickr.com/photos/carlos-pacheco/6038581597 (CC BY 2.0)
Data used in the final work:
- GBIF.org (16 June 2024) GBIF Occurrence Download https://doi.org/10.15468/dl.dcgxhp
- OpenStreetMap
- Natural Earth