Assessing differences in spectral irradiance is at the heart of our research group’s work, and yet considering entire spectra at once is not something that is straight-forward to do. Traditionally, most research has broken-down spectra into their component regions in order to compare one light environment with another, but looking at the whole spectrum has the potential to yield much more detailed information.
Our open-access paper just out in Ecology & Evolution considers ways to quantitatively assess differences between entire solar spectrum. This approach is illustrated by tracking changes in the forest canopy through the spring and amongst stands dominated by different tree species.
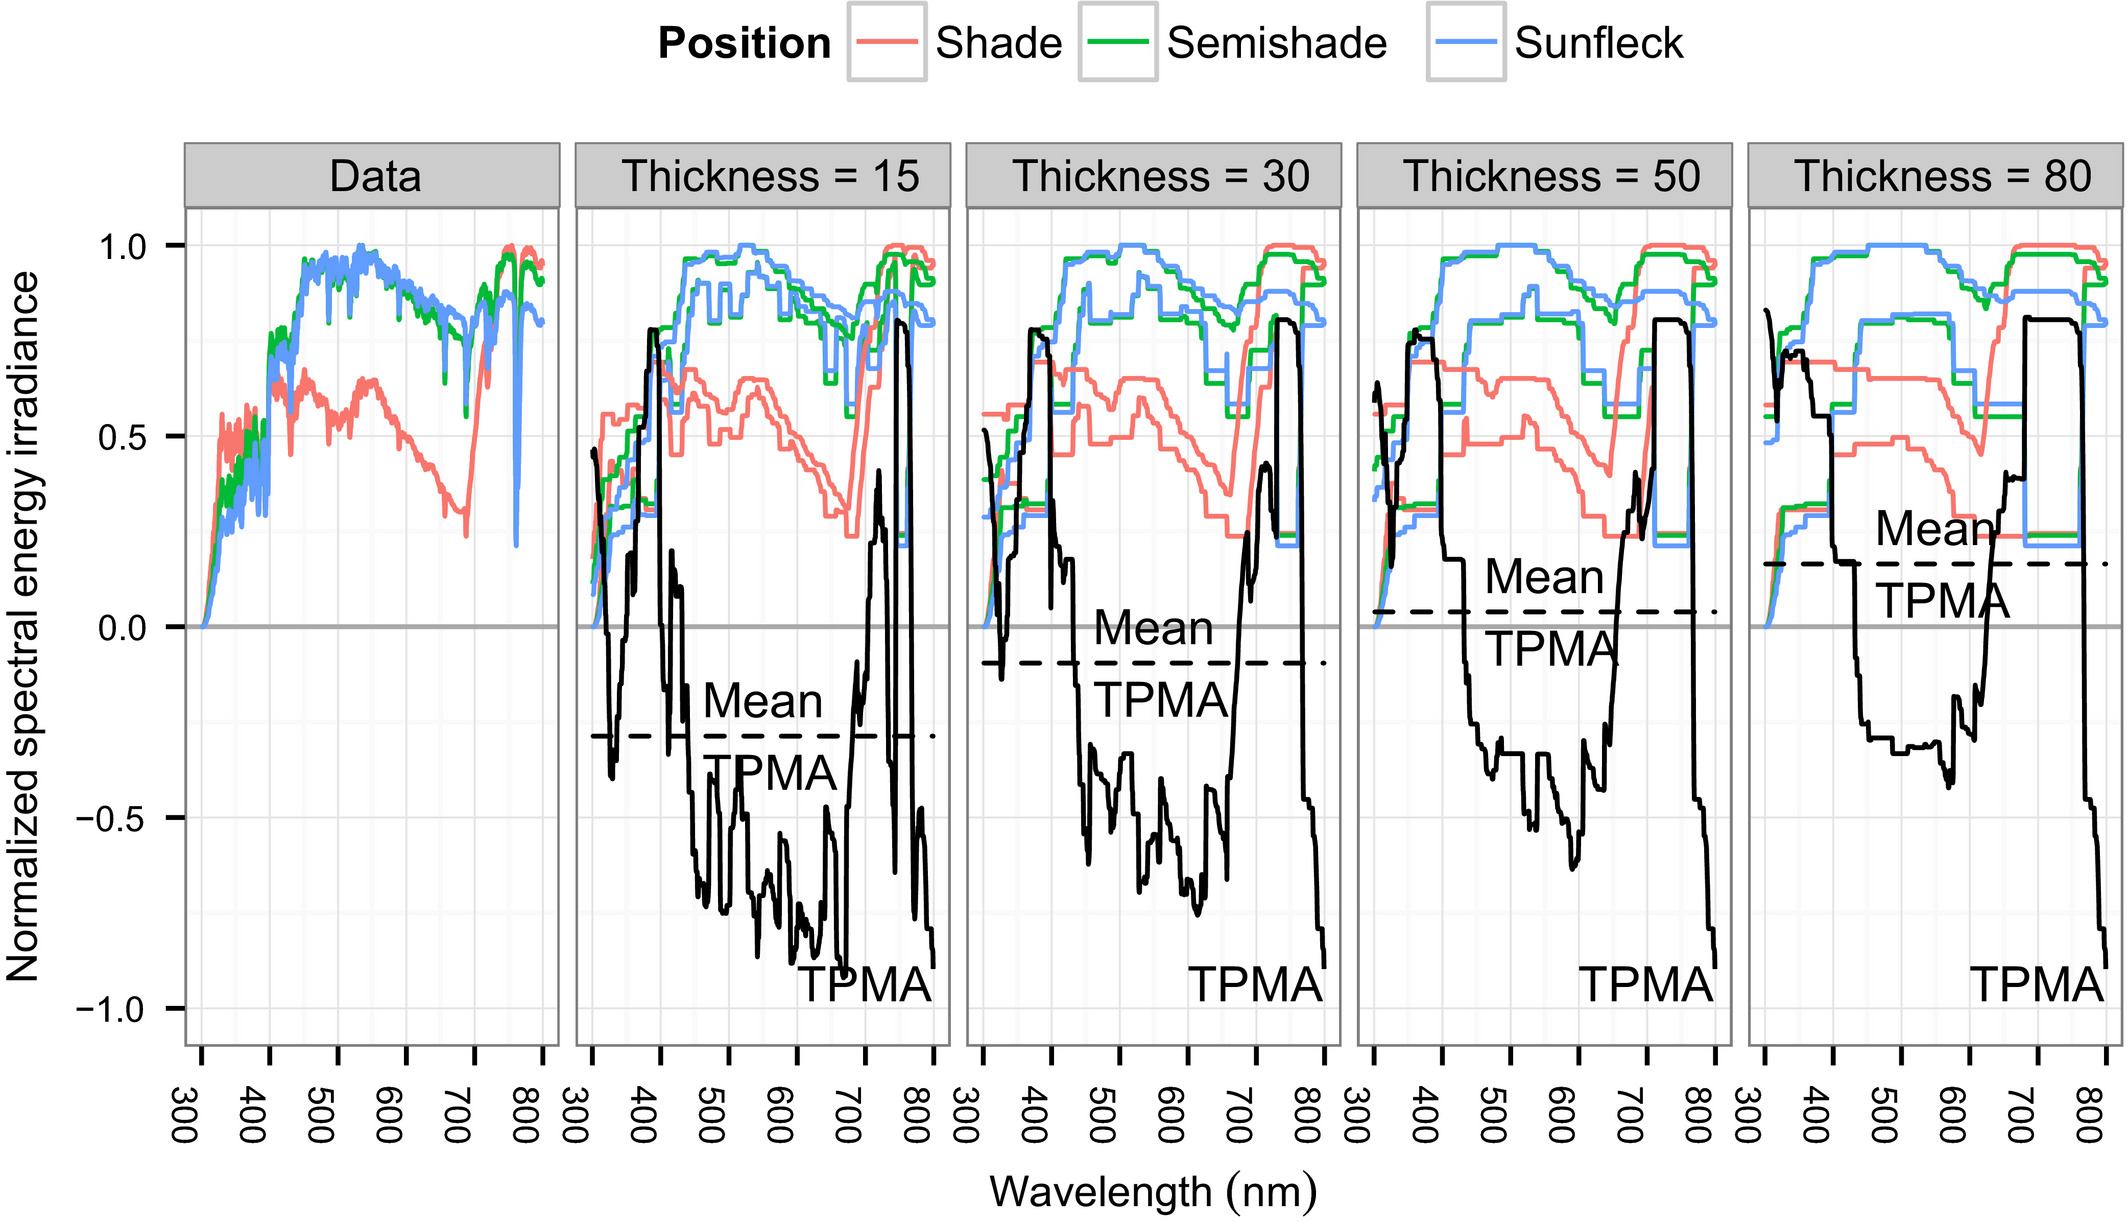
The method we used, called thick pen transform, involves redrawing our spectra of interest with increasingly thick lines and then comparing their similarity. This allows the coarse and fine features of spectra to be compared, and a “Thick Pen Measure of Association” to be calculated to quantify their similarity, as illustrated above.
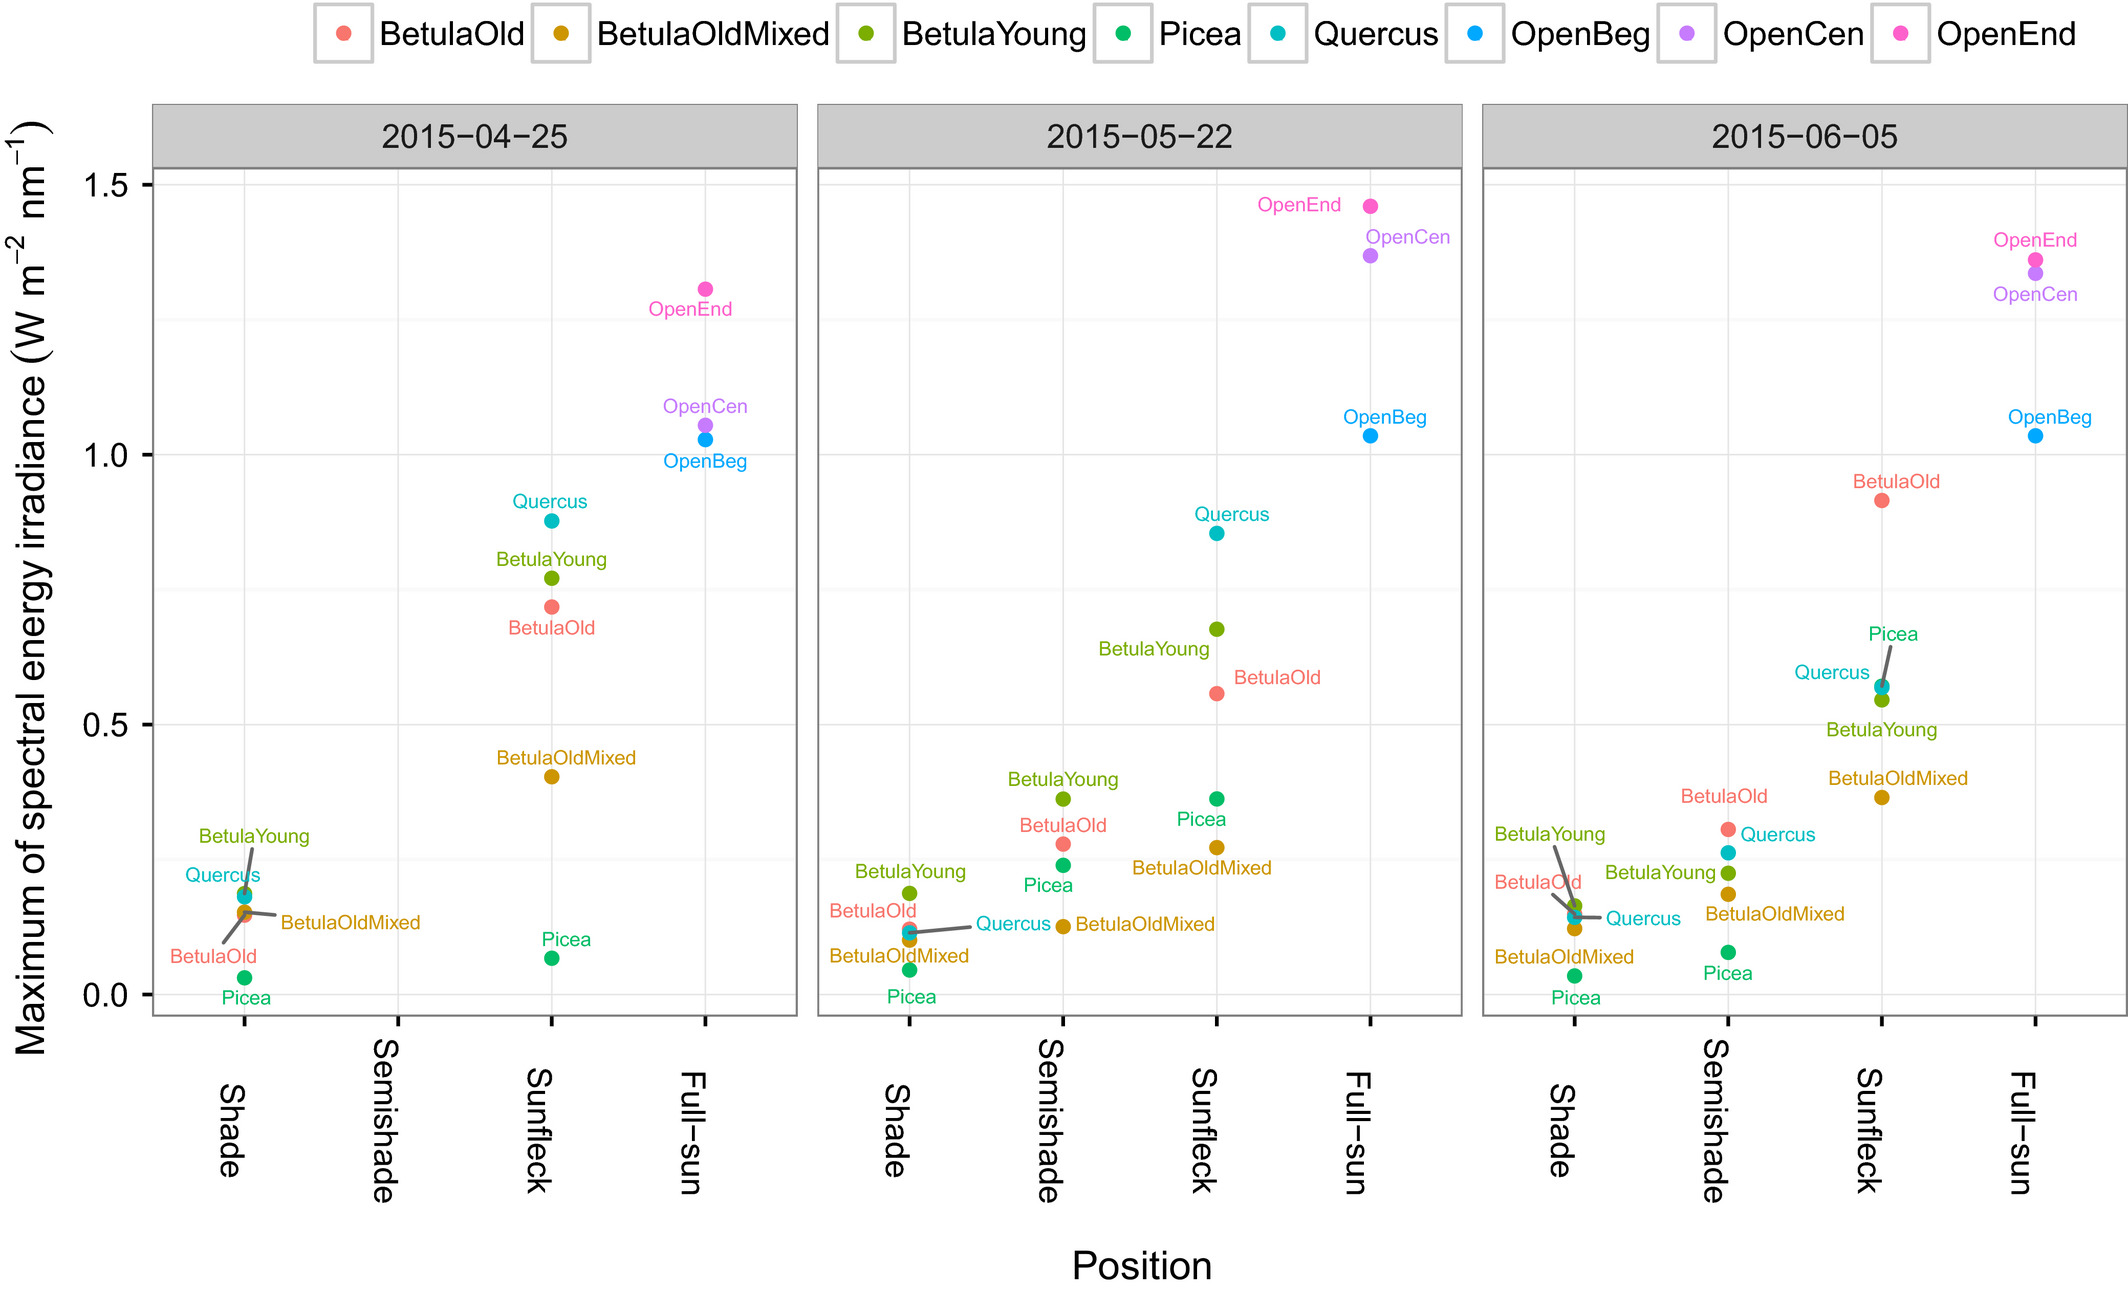 Using this technique, we were able to trace differences in the spectral irradiance at ground level between forest stands of birch, oak, and spruce at Lammi Biological Station in central Finland. This is the first time such fine-scale differences in the light environment due to the species, phenology, height and leaf-optical properties of canopies have been distinguished. By better understanding how light environments in forests differ we can start to better explain the factors that control species composition and ecosystem functioning in these environments.
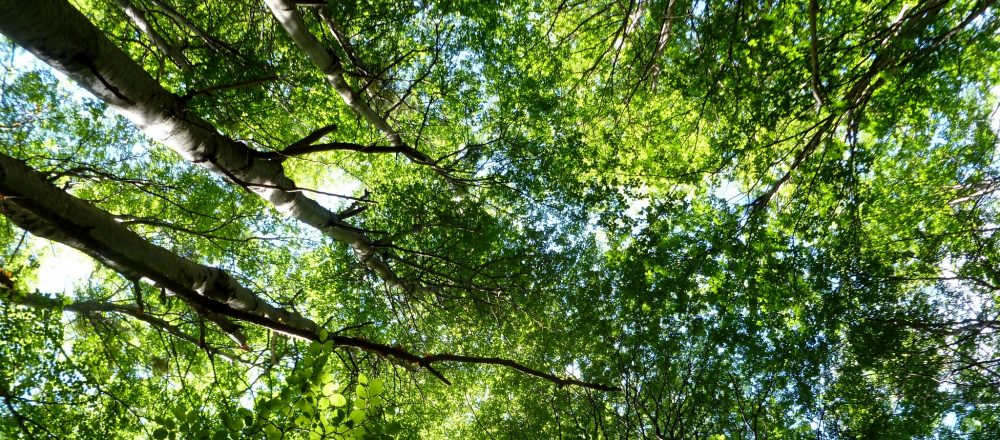
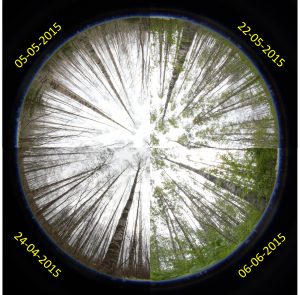
 As well as detailing the theory and methodology behind this research, the paper gives a comprehensive protocol of how to maximise the information obtained from hemispherical photos of the forest canopy. These are used to assess leaf area index and the sunlight reaching the floor throughout the year.
Read the full text at Hartikainen SM, Jach A, Grané A, Robson TM. Assessing scale‐wise similarity of curves with a thick pen: As illustrated through comparisons of spectral irradiance. Ecol Evol. 2018;00:1–13. https://doi.org/10.1002/ece3.4496