How can Big Data sources, such as georeferenced social media, be used in cross-border research? What kind of cross-border mobility patterns can be detected geographically over time? How can daily cross-border movements be separated from other movements? These were the main questions I was trying to find answers for in my Master’s thesis “Modeling Cross-Border Mobility Using Geotagged Twitter in the Greater Region of Luxembourg”.
The Greater Region of Luxembourg is the largest cross-border labor market in the European Union with the greatest number of cross-border workers in the area. European integration, the Schengen Area, and socio-economical divergences between neighboring countries have been the main factors facilitating human cross-border movements in the region and thus the emergence and expansion of the borderland community. Despite the freedom of movement, country borders still exist as well as their socio-economic differences. We witness the growing trend of people migrating to the other side of the country border while still working in Luxembourg. This actuates daily cross-border mobilities, which are not well known, to date. Thus, there is a distinct need to understand cross-border mobility dynamics in the region, especially border crossings on a daily basis.
Present-day landscape patterns may provide information on past dynamics of the landscape. Spatial ecologists have taken advantage of this for a long time, for instance to infer colonization rates and dispersal distances of species from their present-day spatial distributions and occurrence patterns.
Inferring past dynamics from present-day patterns gets more complicated if multiple landscape elements have been simultaneously on the move. In this case, it may be helpful to reconstruct and simulate past landscape dynamics, to understand how different dynamic elements must have interacted in the past to produce the present-day pattern. Methods that reconstruct past interactions may help us to understand complex dynamics, without having to wait for years for the accumulation of time series data.
In our recent publication in the field of spatial ecology, we tested this by using data on a well-studied epiphytic lichen, Lobaria pulmonaria. For our study area, fire scar data existed on the timings and locations of forest fires for a 400-year time period. Given this known landscape disturbance history, we simulated and calibrated the dynamics of L. pulmonaria host trees and L. pulmonaria colonizations so that they resulted in patterns that match with present-day data (locations of L. pulmonaria occurrences and host trees). Our resulting colonization model of L. pulmonaria performed well against a model fitted to time series data.
We hope to inspire further studies on complex dynamics that utilize multiple types of information contained in present-day landscapes.
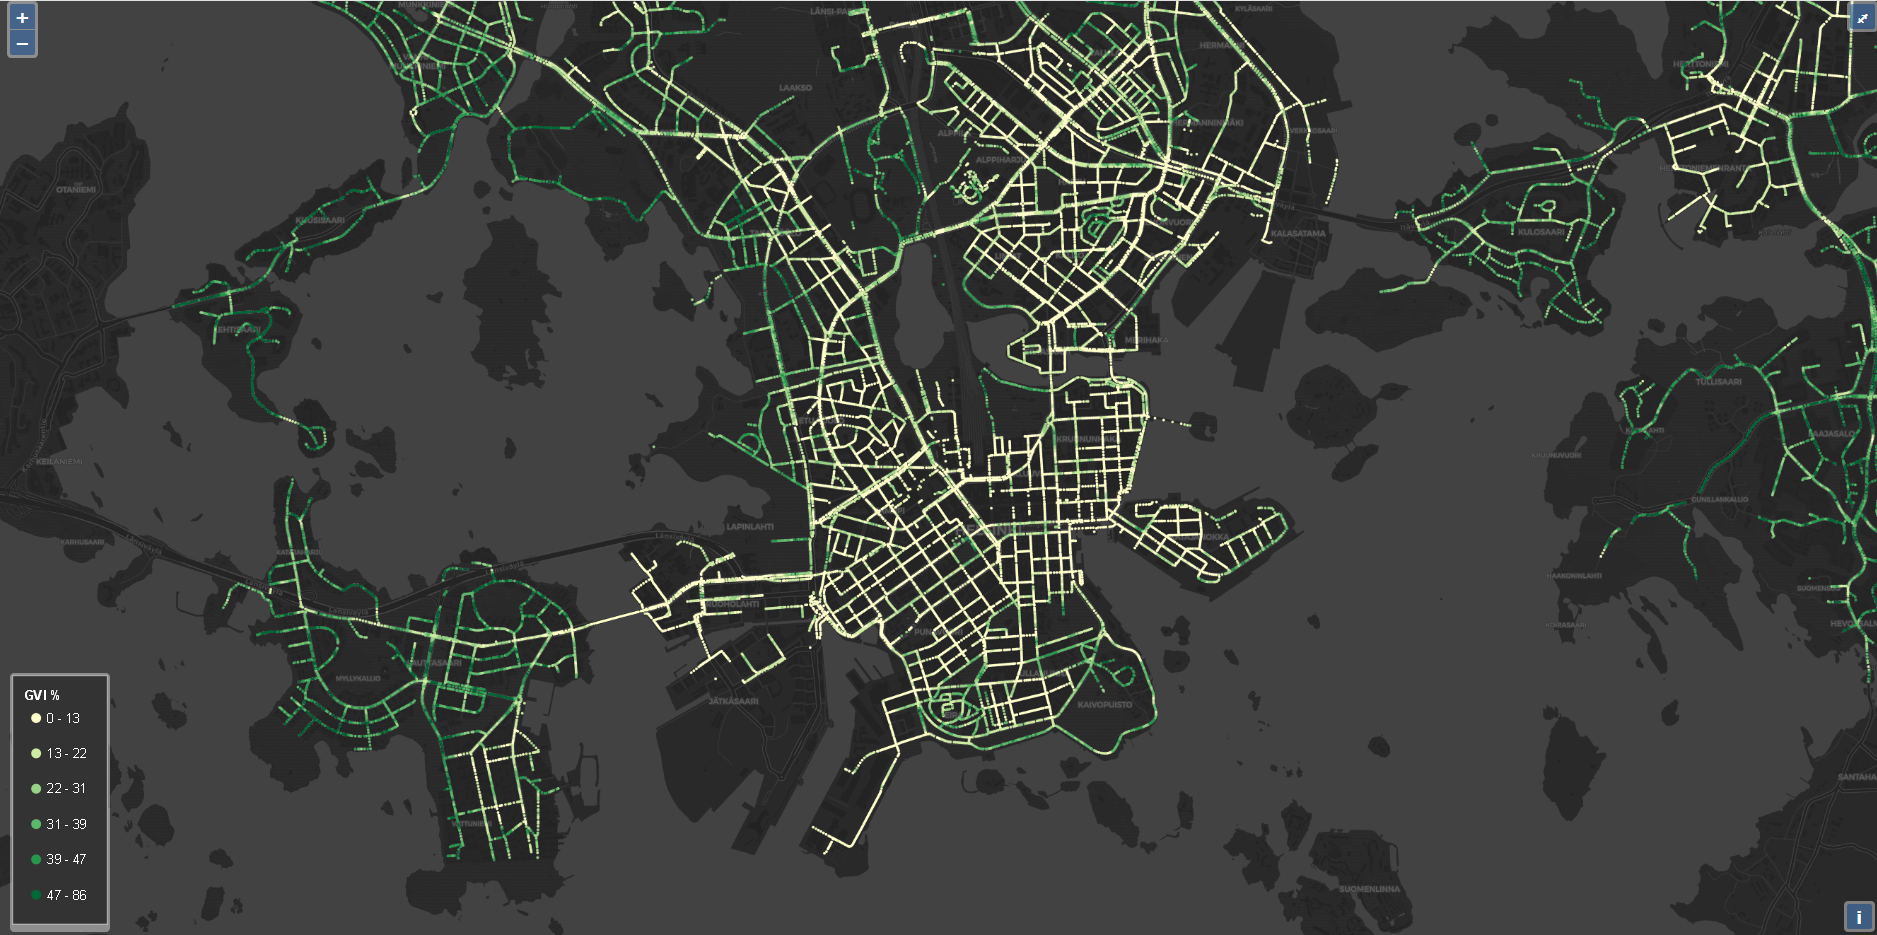
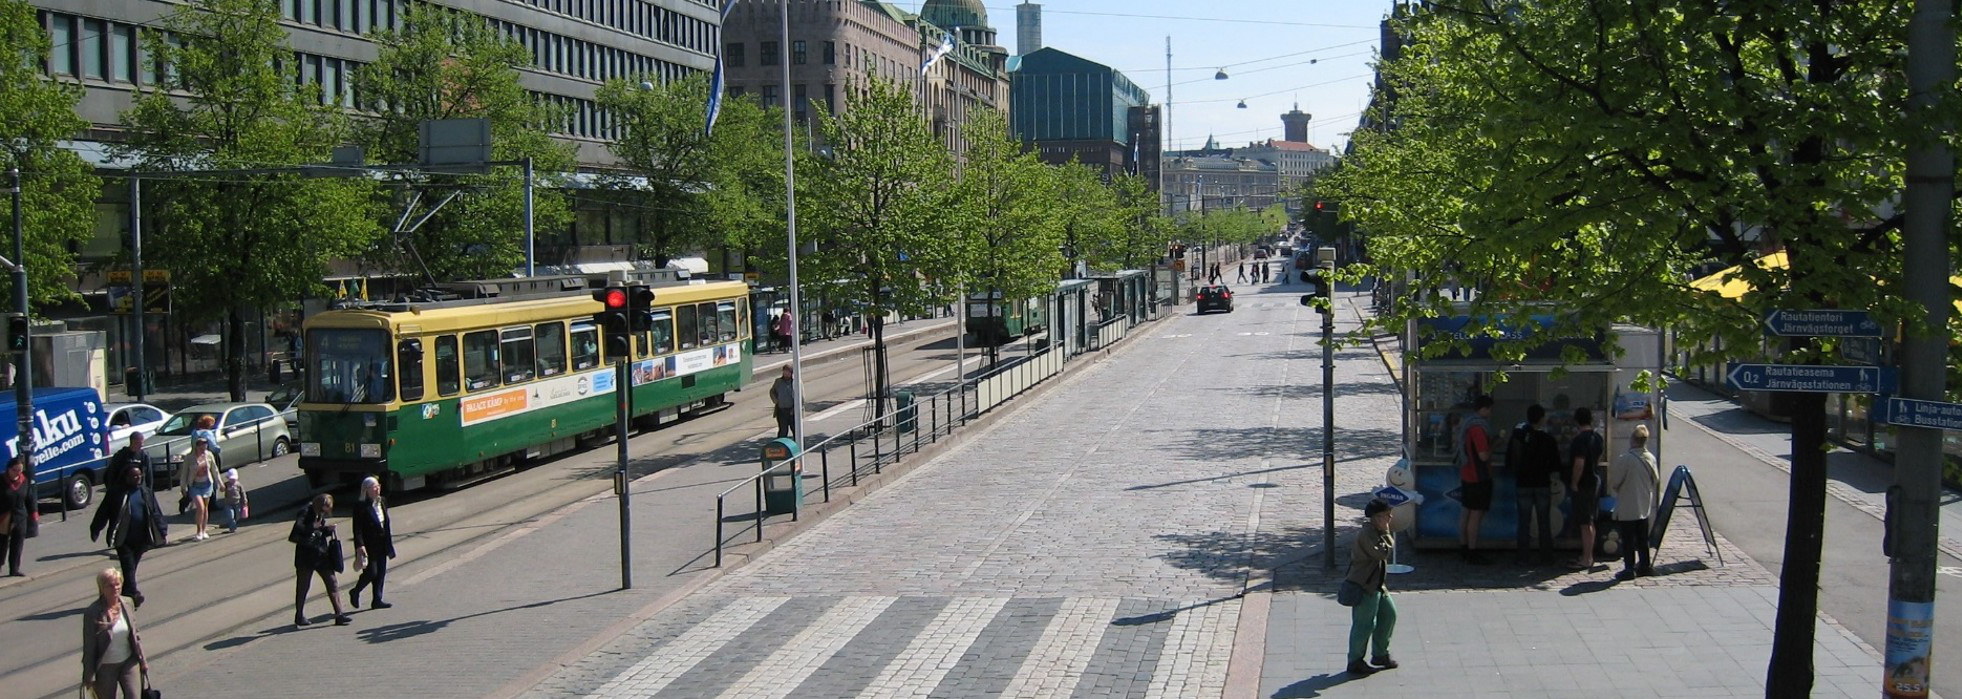
Urban vegetation has traditionally been mapped through traditional ways of remote sensing like laser scanning and aerial photography. However, it has been stated that the bird view examination of vegetation cannot fully represent the amount of green vegetation that the citizens observe on street level. Recent studies have raised human perspective methods like street view images and measuring of green view next to more traditional ways of mapping vegetation. Green view index (GVI) states the percentage of green vegetation in street view on certain location. The purpose of my thesis was to create a green view dataset of Helsinki city using Google street view (GSV) imagery and to reveal the differences between human perspective and aerial perspective in vegetation mapping.
Earlier this week, Henna Fabritius took part in the environmental dialogues -event to discuss biodiversity-related modelling tools in urban greenery planning.
More information, and a recording of the event is available here (in Finnish):
The event was organized by the Forum for Environmental Information (Ympäristötiedon foorumi in Finnish), which is a non-profit organization that aims at increasing interaction between the producers and users of environmental information in order to support national policy making in Finland, while keeping in mind the global significance of environmental problems.
Read also Henna’s blog about getting better at supporting urban biodiversity (in Finnish):
https://www.nessling.fi/ymparistodialogeja/mina-vaitan-luonnon-monimuotoisuutta-voitaisiin-tukea-kaupungeissa-nykyista-enemman/
In this blog, we share latest news about our research activities, teaching, GISviz and so on! For more information about Digital Geography Lab, please visit our webpages at helsinki.fi/digital-geography.
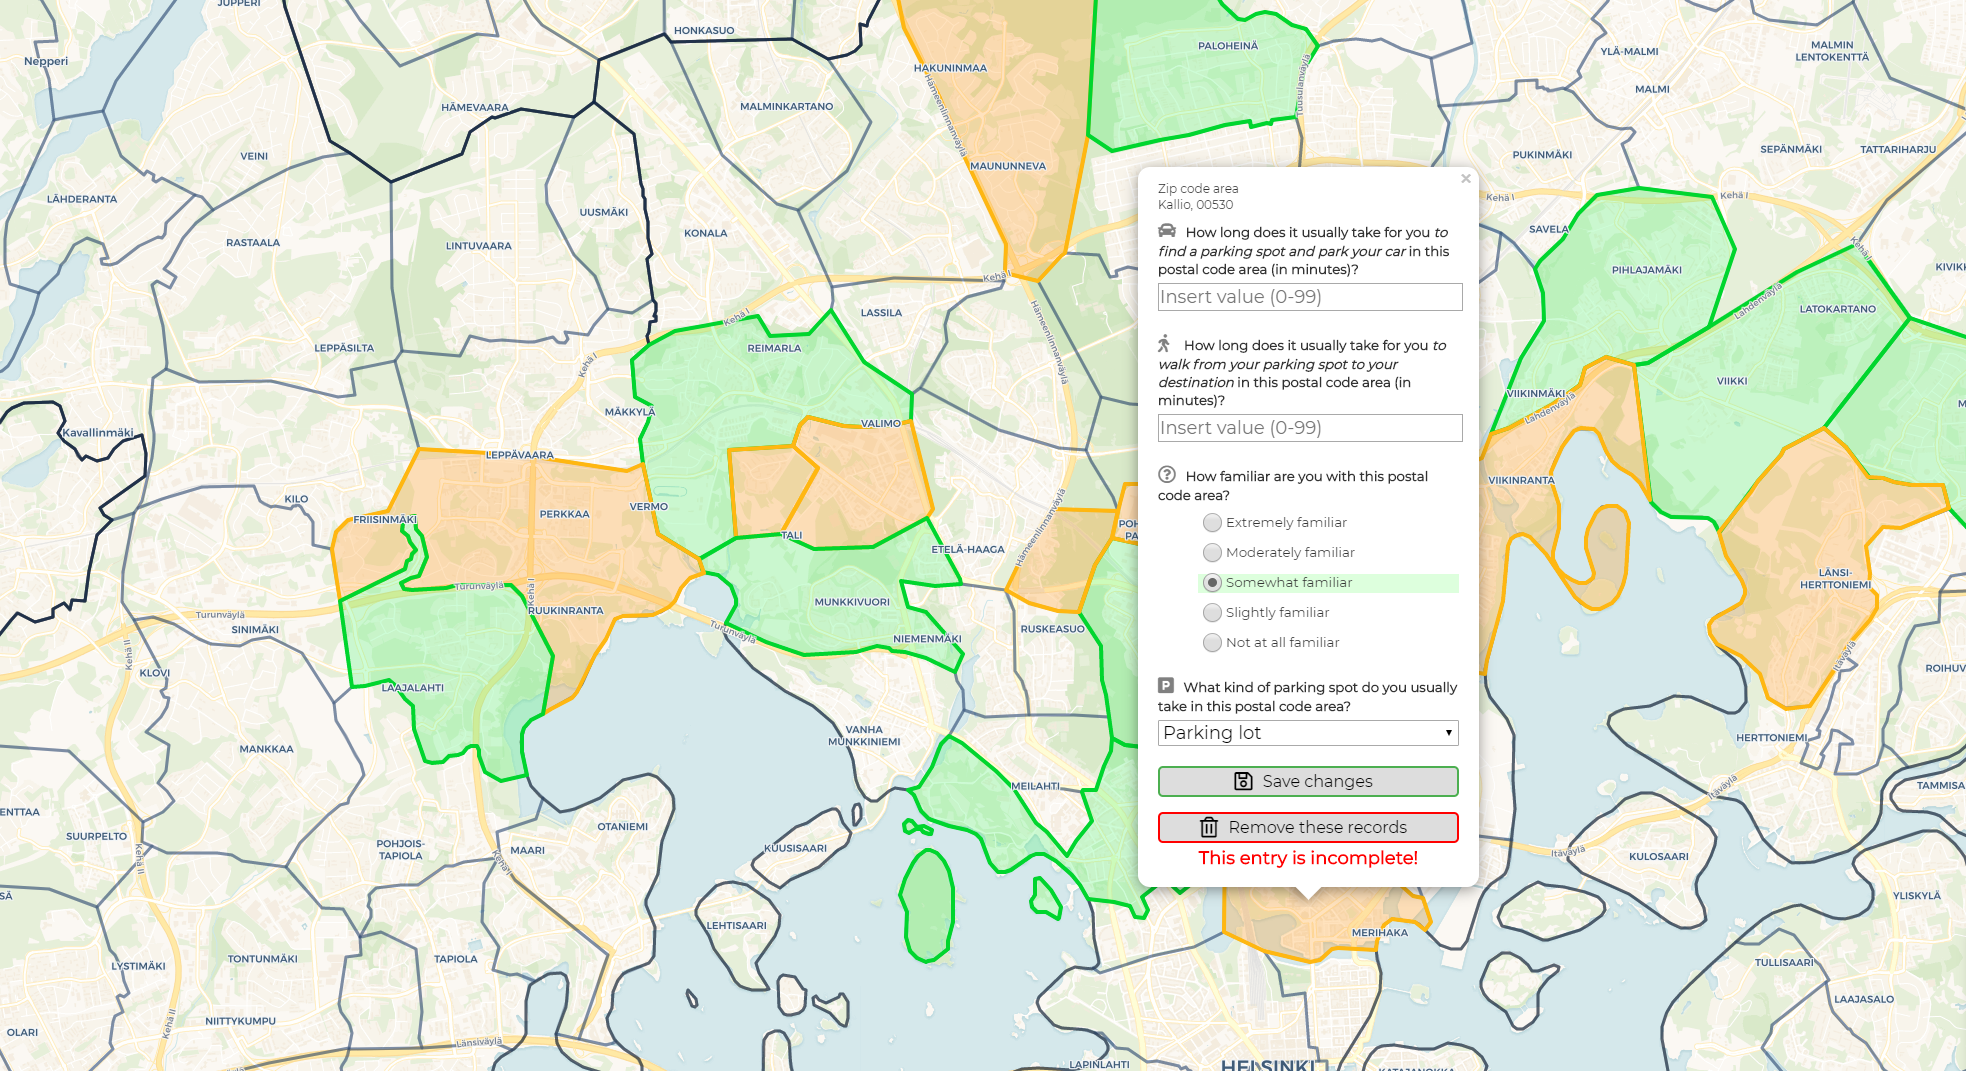
How long does it take to park a private car in Helsinki Capital Region? Is there variation in parking times in different districts of the Capital Region? How can we explain the hypothetical variation?
We are now researching how long does it take for a private car to find a parking spot, park and walk to one’s final destination in different areas of Helsinki Capital Region using a map based survey. In the survey linked below the user chooses postal code areas where they remember having parked in the last two years. For each postal code area user is asked to fill a short form how their parking experience usually is in that area. The survey is created in such a way that data can be sent from as many postal code areas as the user wants – all in one session.
Please find the map based web application survey here. We ask you to answer to the survey latest at 30th June 2019. The survey starts up by default in English. If you wish to fill out the survey in Finnish, you can change the language by clicking the EN/FI button located in the upper left corner of the screen.
About the research
This survey research is a part of the Master’s thesis of Sampo Vesanen. The work is connected to the Helsinki Region Travel Time Matrix, a tool created by Digital Geography Lab which represents travel time distances between statistical grid cells in Helsinki Region by public transport, walking and bicycling. The values in the travel time matrix are calculated using the door-to-door approach. For private cars this means that searching for parking, the parking proper and walking to one’s destination is a part of the travel time. Up until now the time it takes to carry out this process has been a singular estimation deployed to the entire Helsinki Capital Region. This does not represent reality well enough.
The data collected from this survey are used to answer the following questions: what is the variation in parking times between postal code areas in Helsinki Capital Region, what could cause the variation and what is the significance of the parking time in the context of the total travel time of a private car in Helsinki Capital Region. The finalised results of the Master’s thesis will be used to supplement the private car parking process data in the Helsinki Region Travel Time Matrix.
Filling the survey
In the survey the user is asked to estimate how their parking experience usually is in each postal code area. Please answer to each question using your best judgement and answer to each postal code area only once. We seek responses not older than two years because the urban structure of Helsinki Capital Region experiences constant change and possibilities for private car parking change with it. If you require additional information about the questions in the survey, please refer to the information dialog window in the survey. This window will appear on the screen of your device at survey start-up.
You can use a desktop computer, a laptop or a mobile device to fill out the survey. It requires 1-10 minutes of your time. On desktop or laptop it is important you use the latest browser software, recommendations being Chrome or Firefox. On mobile devices it is recommended to use a device that runs Android with Chrome being the browser software. If you wish to fill out the survey using your mobile device (especially if using an Apple device), please read the mobile usage instructions in the information dialog window.
Usage of gathered data
The data gathered in this survey do not reveal any personal information about respondents because of the general scope of the questions used. The web application running the survey will save your IP address for tracking user activity. In the analysis phase of the thesis all collected IP addresses will be altered into random and anonymous string of characters and all the IP addresses will be deleted. The survey web application uses cookies to save user preferences. If you do not delete the cookies manually, they will expire 90 days from their creation.
Further information
In any inquiries regarding the surveyor the research, please contact Sampo by email: sampo.vesanen(at)helsinki.fi.
Digital urban spaces of Helsinki seen from Instagram data have high language diversity, the topics of Finnish and English posts differ spatiotemporally and content-wise to some extent and more is discovered in my Master’s thesis. Finnish and English language posts dominate different areas of Helsinki and topics of Finnish posts have connections to everyday life while English topics are influenced by tourists
With ubiquitous internet access and increasing amounts of social media users and content, an ever larger part of social interactions and common discussions are being augmented with digital means of communication. This renders social media data valuable for scientific inquiry in order to understand contemporary societies, cultures, and phenomena. Social media data is being produced constantly in vast quantities and is mostly produced by users living in urban areas. The data produced in social media can have a reference to a real-world location e.g. in the form of a geotag or geographic coordinates enabling spatiotemporal analysis. In order for scientific knowledge to keep up with the quick changes in society and cultures enabled by the internet and social media, social media data sets need to be investigated and doing this requires powerful novel and interdisciplinary methods.
In my thesis, I delved into the digital urban space of Helsinki by applying topic modeling to Finnish and English Instagram posts’ captions from Helsinki. By looking at the topics of Instagram posts made in both English and Finnish languages, my aim was to discover how language affects Instagram topics, the spatiotemporal distributions of these topics and whether linguistic technologies are applicable in geographic research. In order to do all of this, a number of preprocessing steps were required. The language of the posts had to be identified in order to separate Finnish and English posts from another. After this, the caption texts were lemmatized to make LDA topic modeling viable. Lemmatization is a natural language processing technique with which inflected words are returned to their basic ‘dictionary’ form. For topic modeling of morphologically rich languages, such as Finnish, this is a critically important step without which LDA topic modeling would not yield sensible results, but it is recommended for English as well. Then the lemmatized captions were vectorized and fed into an LDA topic model which modeled language-specific topics for the Helsinki area and a few city districts.
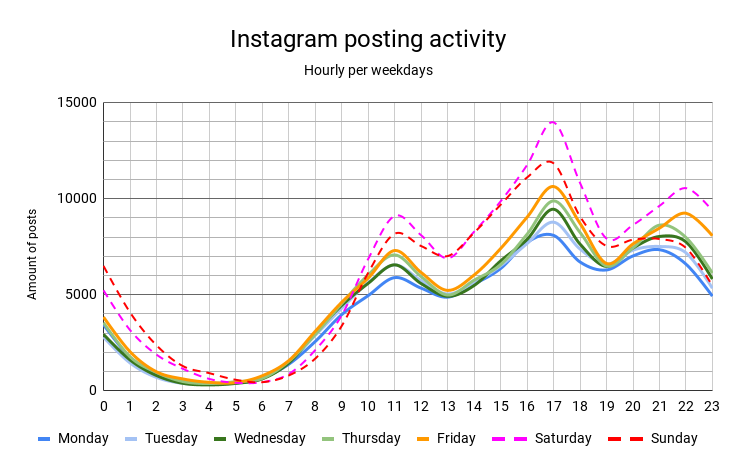
Instagram posting activity in Helsinki follows three-peak rhythmicity.
Plotting the hourly Instagram posting activity by each weekday reveals that Instagram posting frequency in Helsinki follows a three-peak rhythmic structure: peaking at common meal times each day of the week. The temporal structure also shows that Saturdays and Sundays are the most popular days to post on Instagram in Helsinki. These findings hint at a connection between Instagram posting in Helsinki and leisure time activities quite strongly, suggesting Instagram data might be suitable to find out where Instagram users are and what they’re doing on their own time.
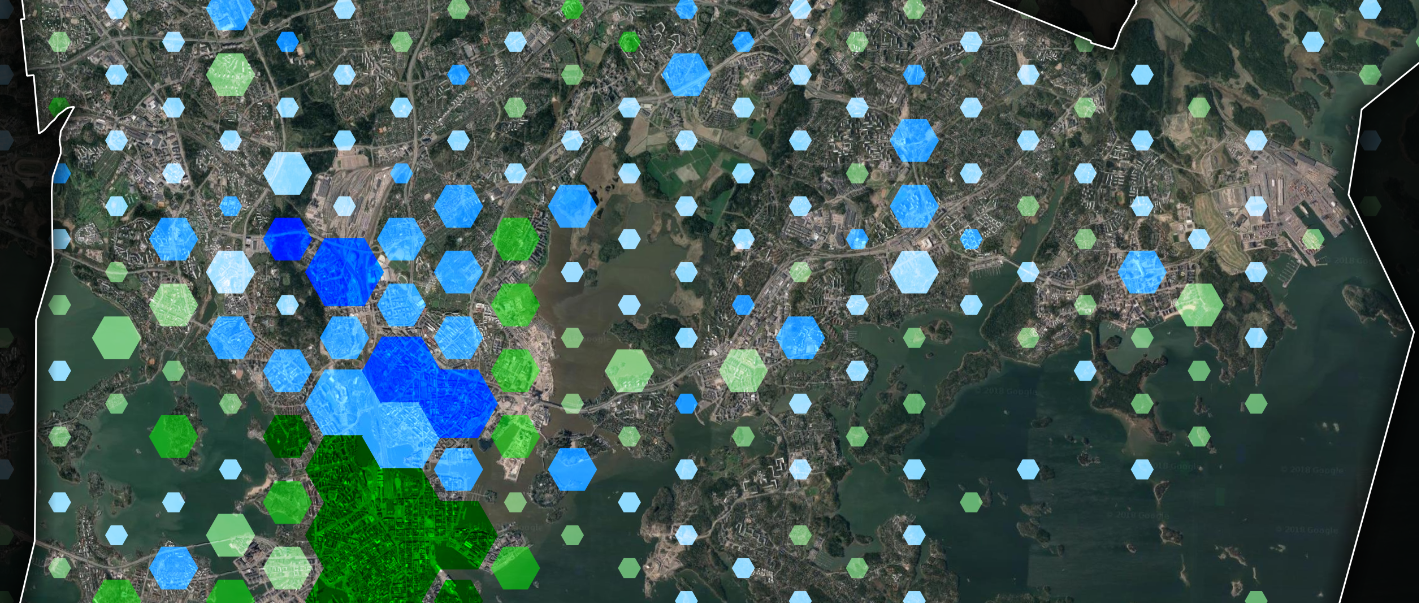
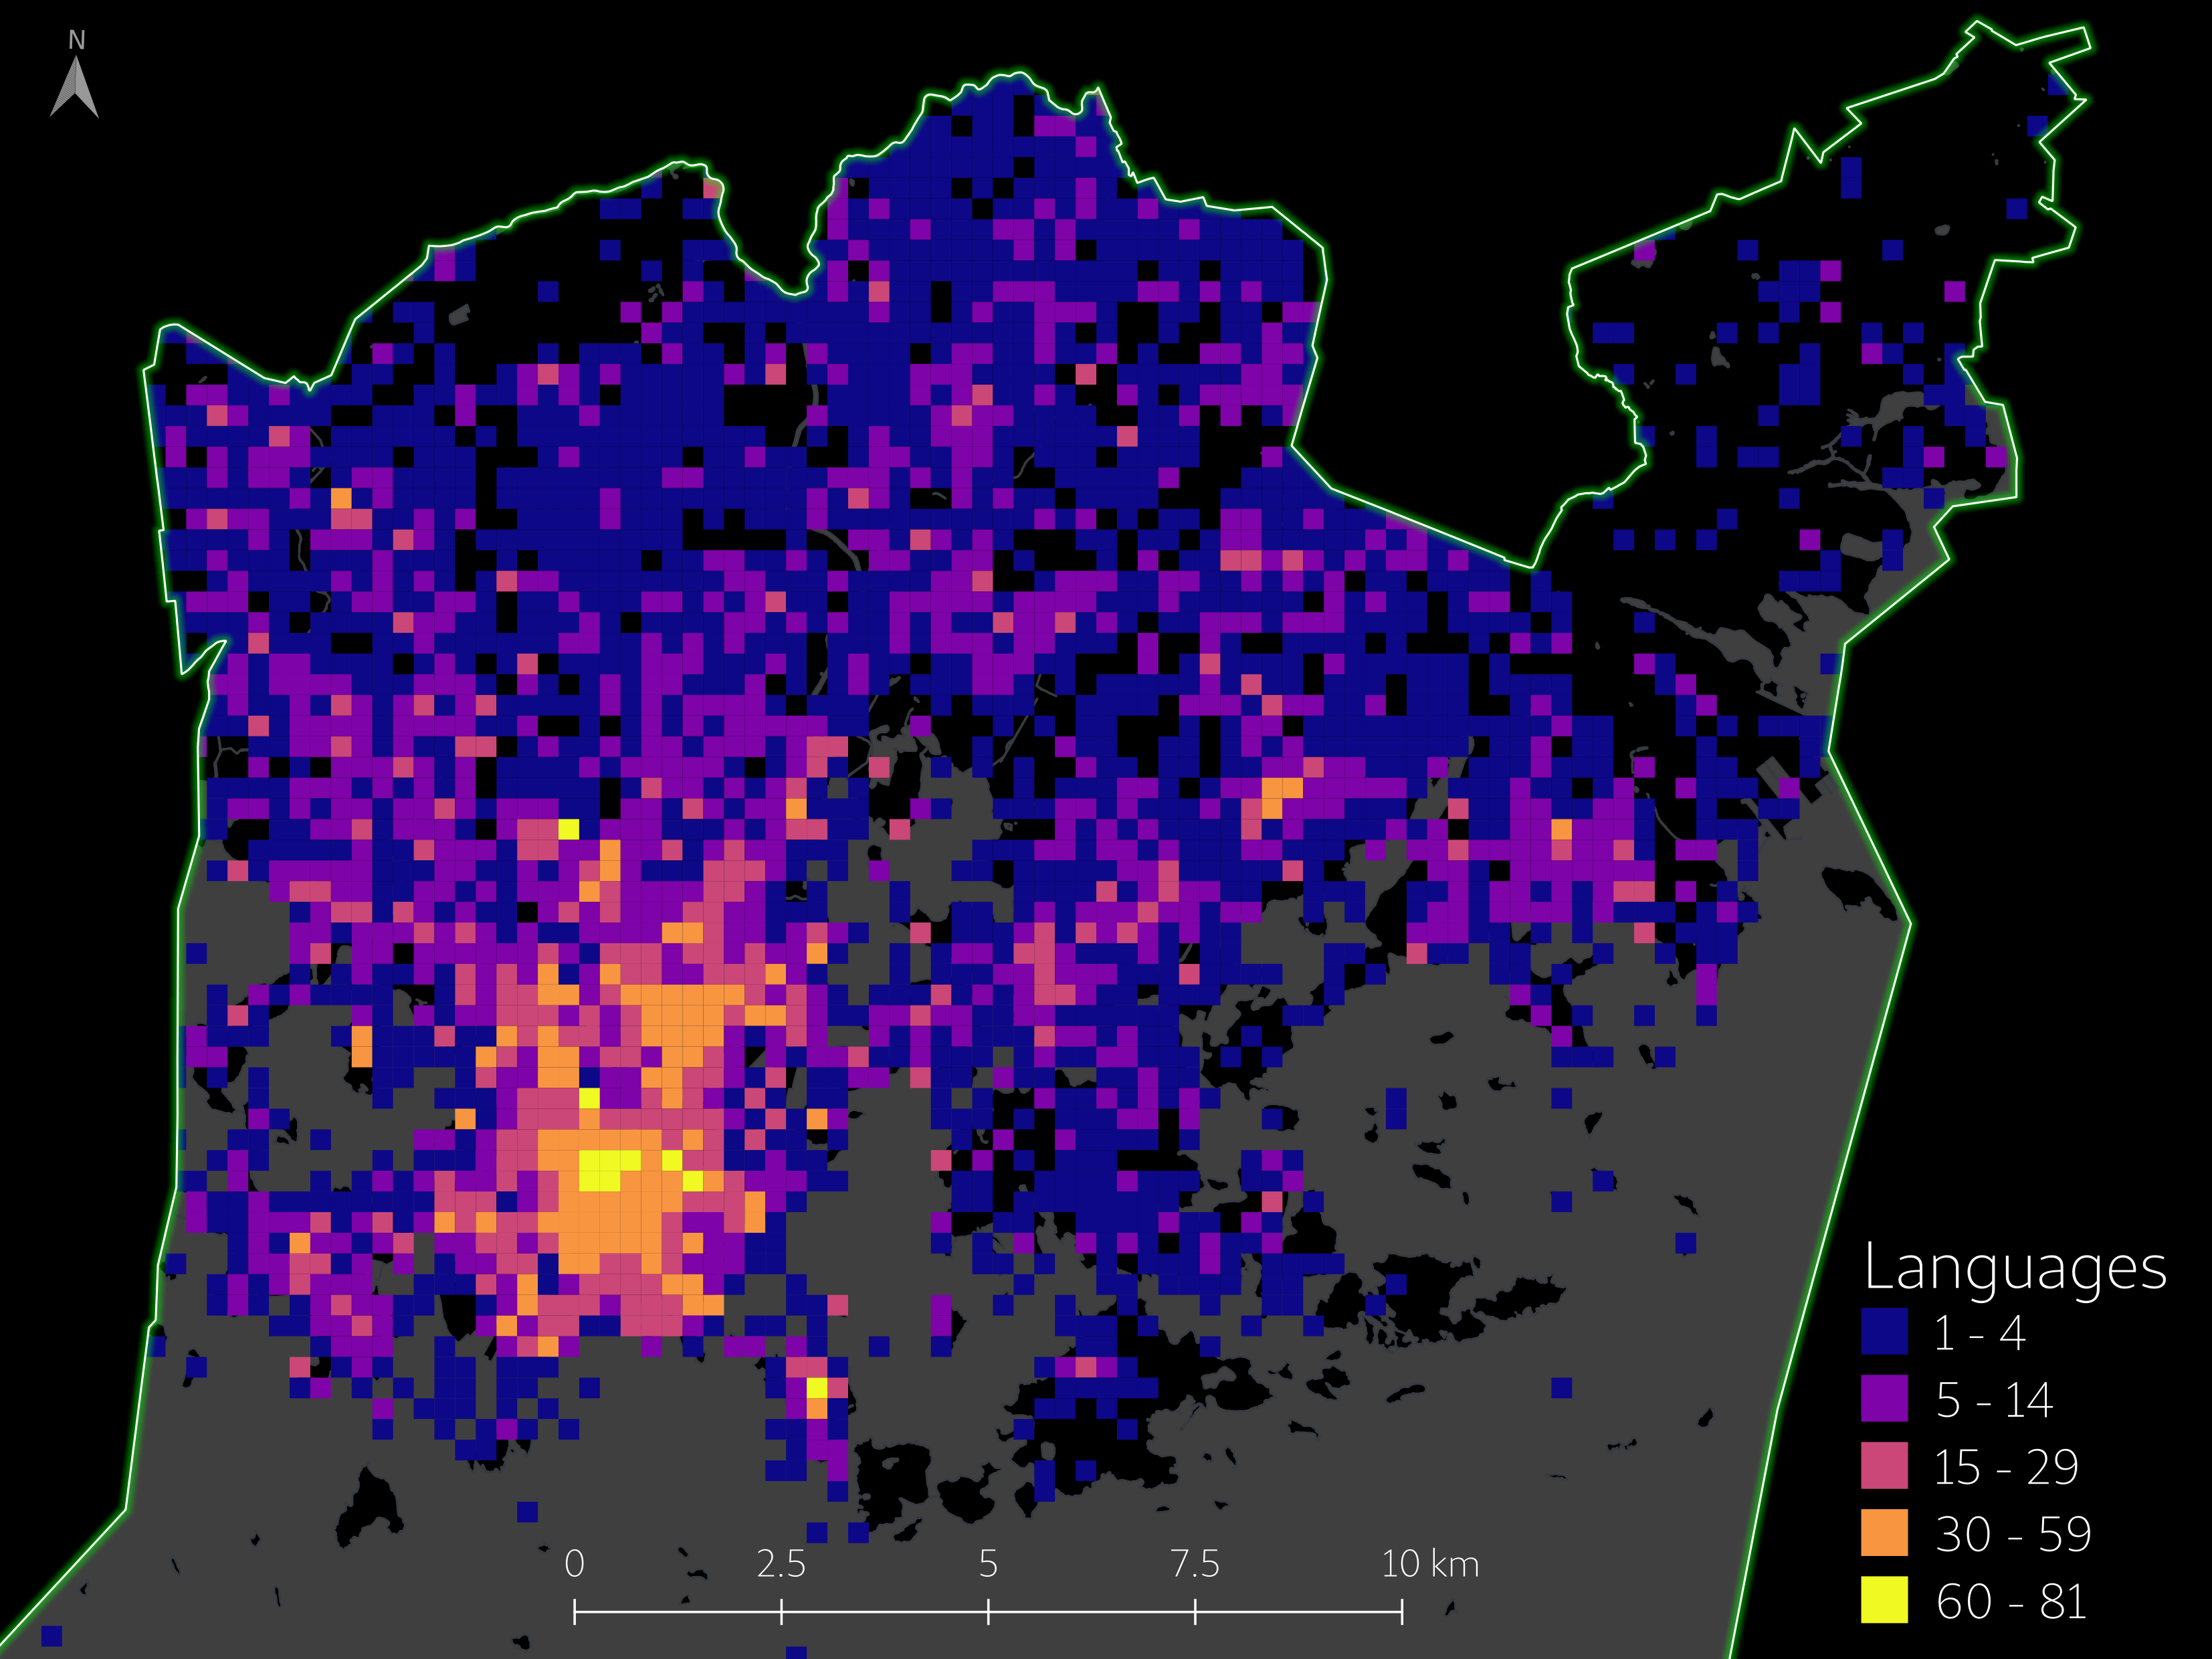
The linguistic landscape of Helsinki from Instagram posts.
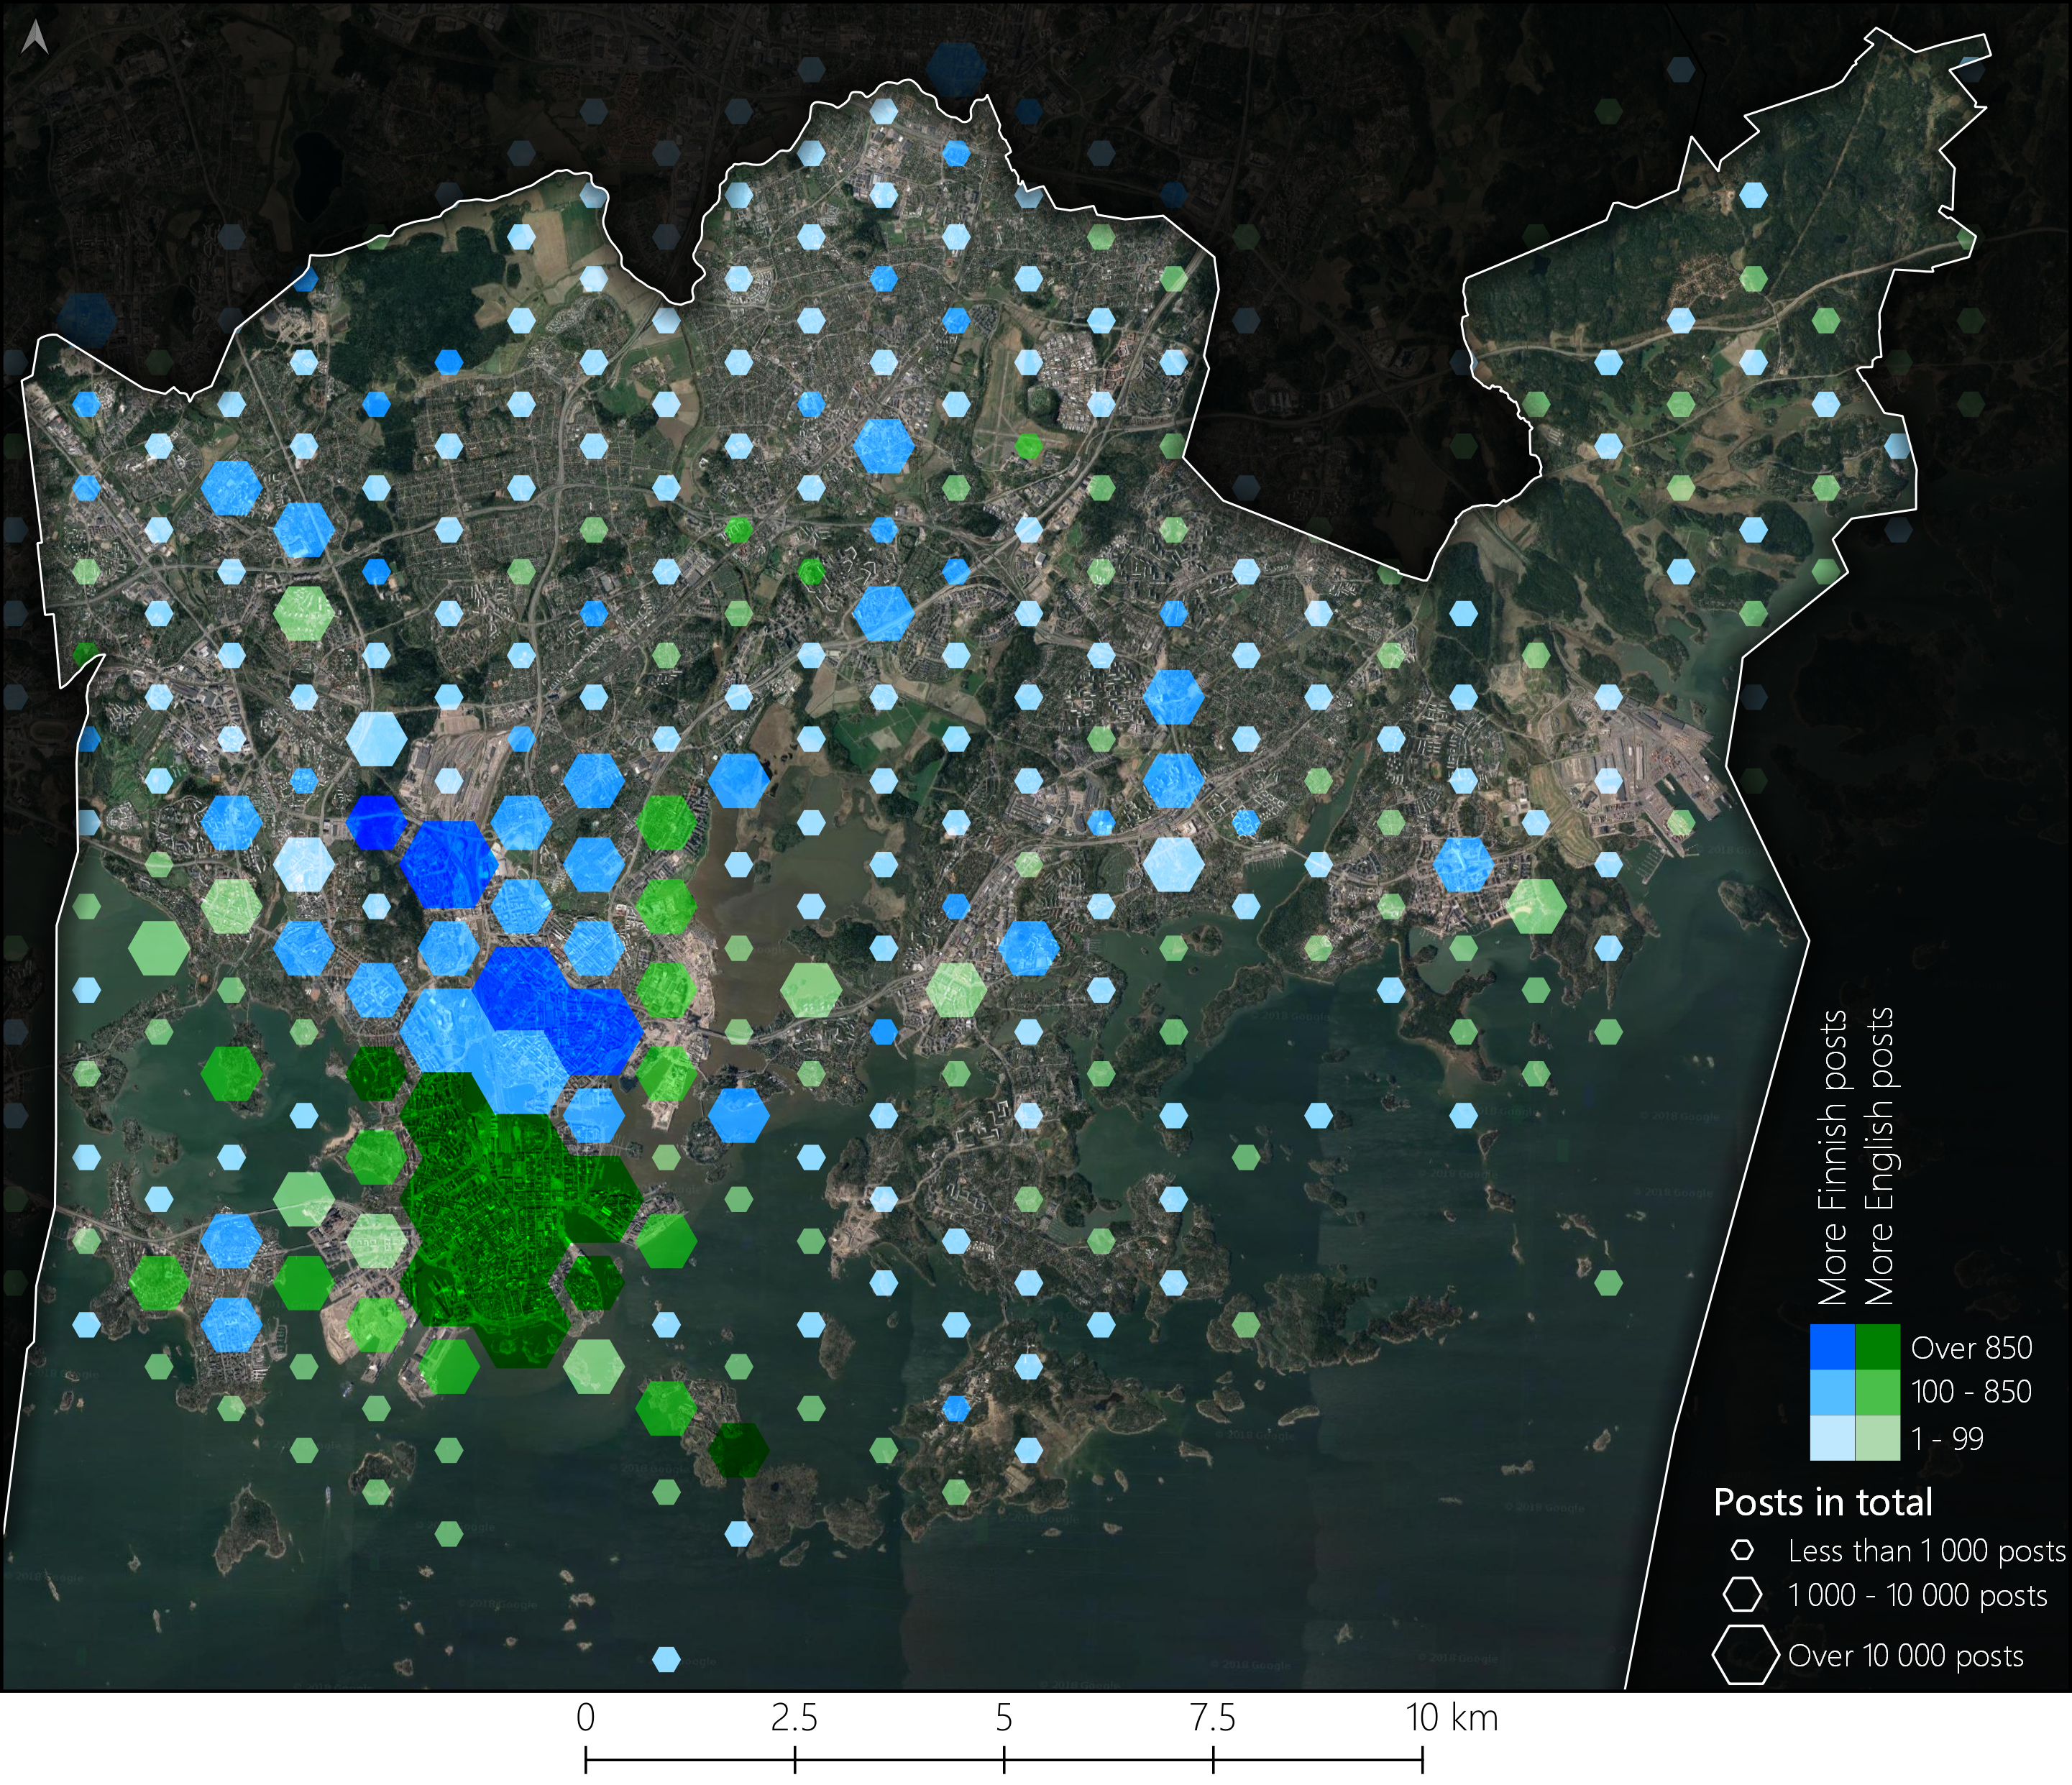
To decipher which topics are popular in Finnish and English Instagram posts, the language of the posts was identified revealing the diverse linguistic landscape of Instagram posts in Helsinki. By only focusing on Finnish and English, a lot of knowledge is lost in my analysis, underscoring the importance of a multilingual approach in future work. The geolinguistic division between Finnish and English Instagram posts in Helsinki shows a few key patterns. Firstly, the city center is the area of highest posting intensity, but smaller posting hubs appear along with major transport nodes in Helsinki. Secondly and perhaps more interestingly, central Helsinki is quite clearly divided in two between the languages. Finnish is more popular in areas north of Hakaniemi, while English comes out on top in the southern parts of the center. The main dividing line seems to be Töölönlahti and the small channel connecting Töölönlahti to the Baltic sea, which has historically been the dividing line between the working class in the north and the bourgeoisie in the south. The biggest relative differences between the languages are in peripheral areas with very low post counts suggesting that popular areas for posting are popular for both languages.
Two most common languages of Instagram posts in Helsinki divide the city.
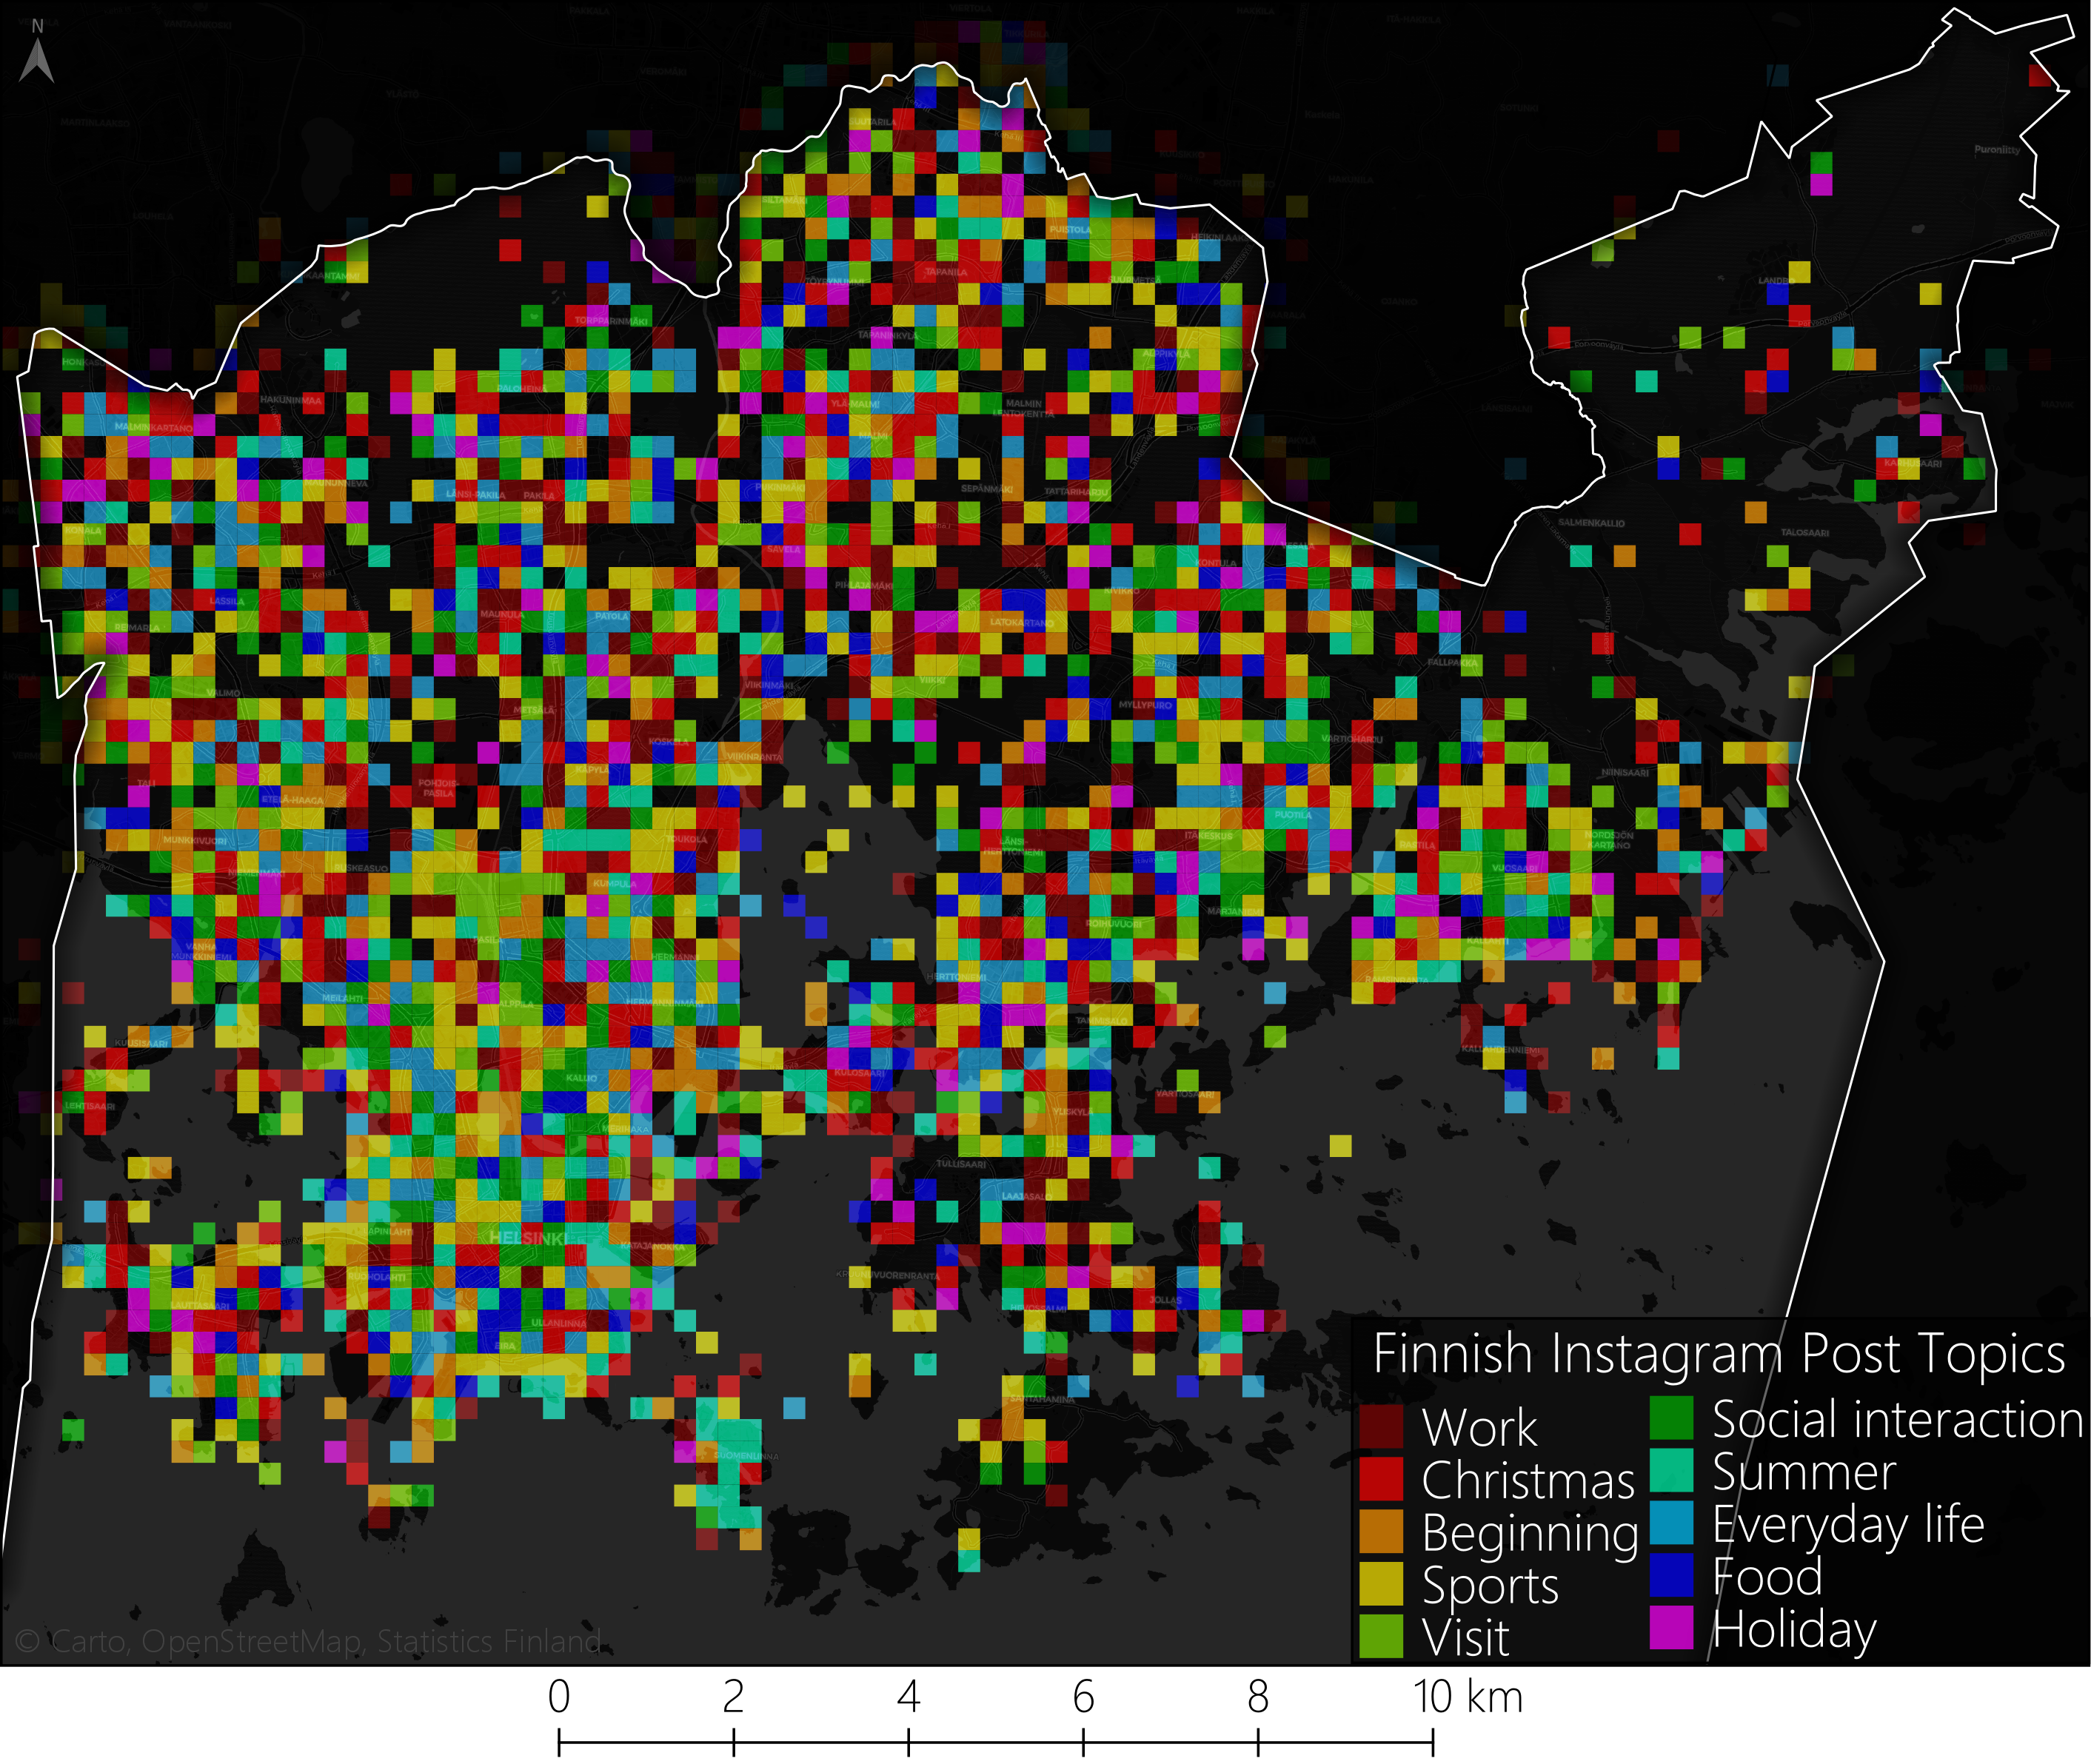
Finnish and English Instagram posts’ topics differ both spatially and temporally at different scales, even though Instagram data was shown to be similar in content and temporal rhythm between the languages. Posts in both languages mostly deal with leisure-related topics, but Finnish topics have several references to everyday life, while English topics do not. Also, Finnish posts didn’t have one numerically dominant topic while as English posts did: ‘morning’. The spatial structure of the topics reflects the complexity of social media content, generality of the topics and the fact that posting location might not specifically relate to the topic of the post. Also, Instagram’s geotagging is based on points-of-interest which introduces slight to moderate spatial inaccuracy into the data as the exact posting coordinates are not recorded. There is, however, some spatial logic to the topics, for instance, the prevalent topic of Suomenlinna island is ‘summer’ for Finnish posts and ‘New Year’ for English posts, topics around the Olympic stadium revolve around sports. Statistically validating the connection between the topic and the underlying geographic region is highly problematic if the topic is very general.
Topics of Finnish Instagram posts in Helsinki aggregated into a 250-meter grid.
The topics become more specific at city district level which is to be expected with the limited spatial extent of a city district. However, at the city district level, the POI-based location structure becomes more problematic due to the aggregation of posts under POIs. At the city district scale, English topics have clearer references to touristic sights in the city districts suggesting a presence of tourists or at least sightseeing as an activity in the data set. Finnish topics, however, maintain a connection to everyday life with topics like “work”, “family” and “everyday life” and touristic sights are not mentioned.
There are a few things to consider when doing research with social media data. First, social media posts are often about subjects the user considers positive creating a positivity bias into the data. Second, results from social media analyses only represent the users of its particular social media platform and finding out to what extent this group represents the population as a whole is difficult. Third, the locational accuracy of posts isn’t in all cases very good, because geo-tagging functionality can be based on fixed points-of-interest and not to the actual coordinates of the user at the time of posting. This means that large amounts of posts can be and are aggregated on to commonly named points-of-interest. For instance, “Helsinki, Finland” was one of the most popular location names in the data and surprisingly consisted of numerous different points across Helsinki. Fourth, social media posts are multilingual and most of the tools for content analysis have been developed for English and most of social media research deal with English content. Including minor languages into the analysis would ensure a broader and less biased understanding of what is going on in social media. Fifth, social media companies are constantly developing and changing their APIs making access to data and reproducibility depend on the whims of social media corporations. Regardless of these error elements and limitations, social media data can be a very fruitful data set for scientific analyses of the city and (some of) its people.
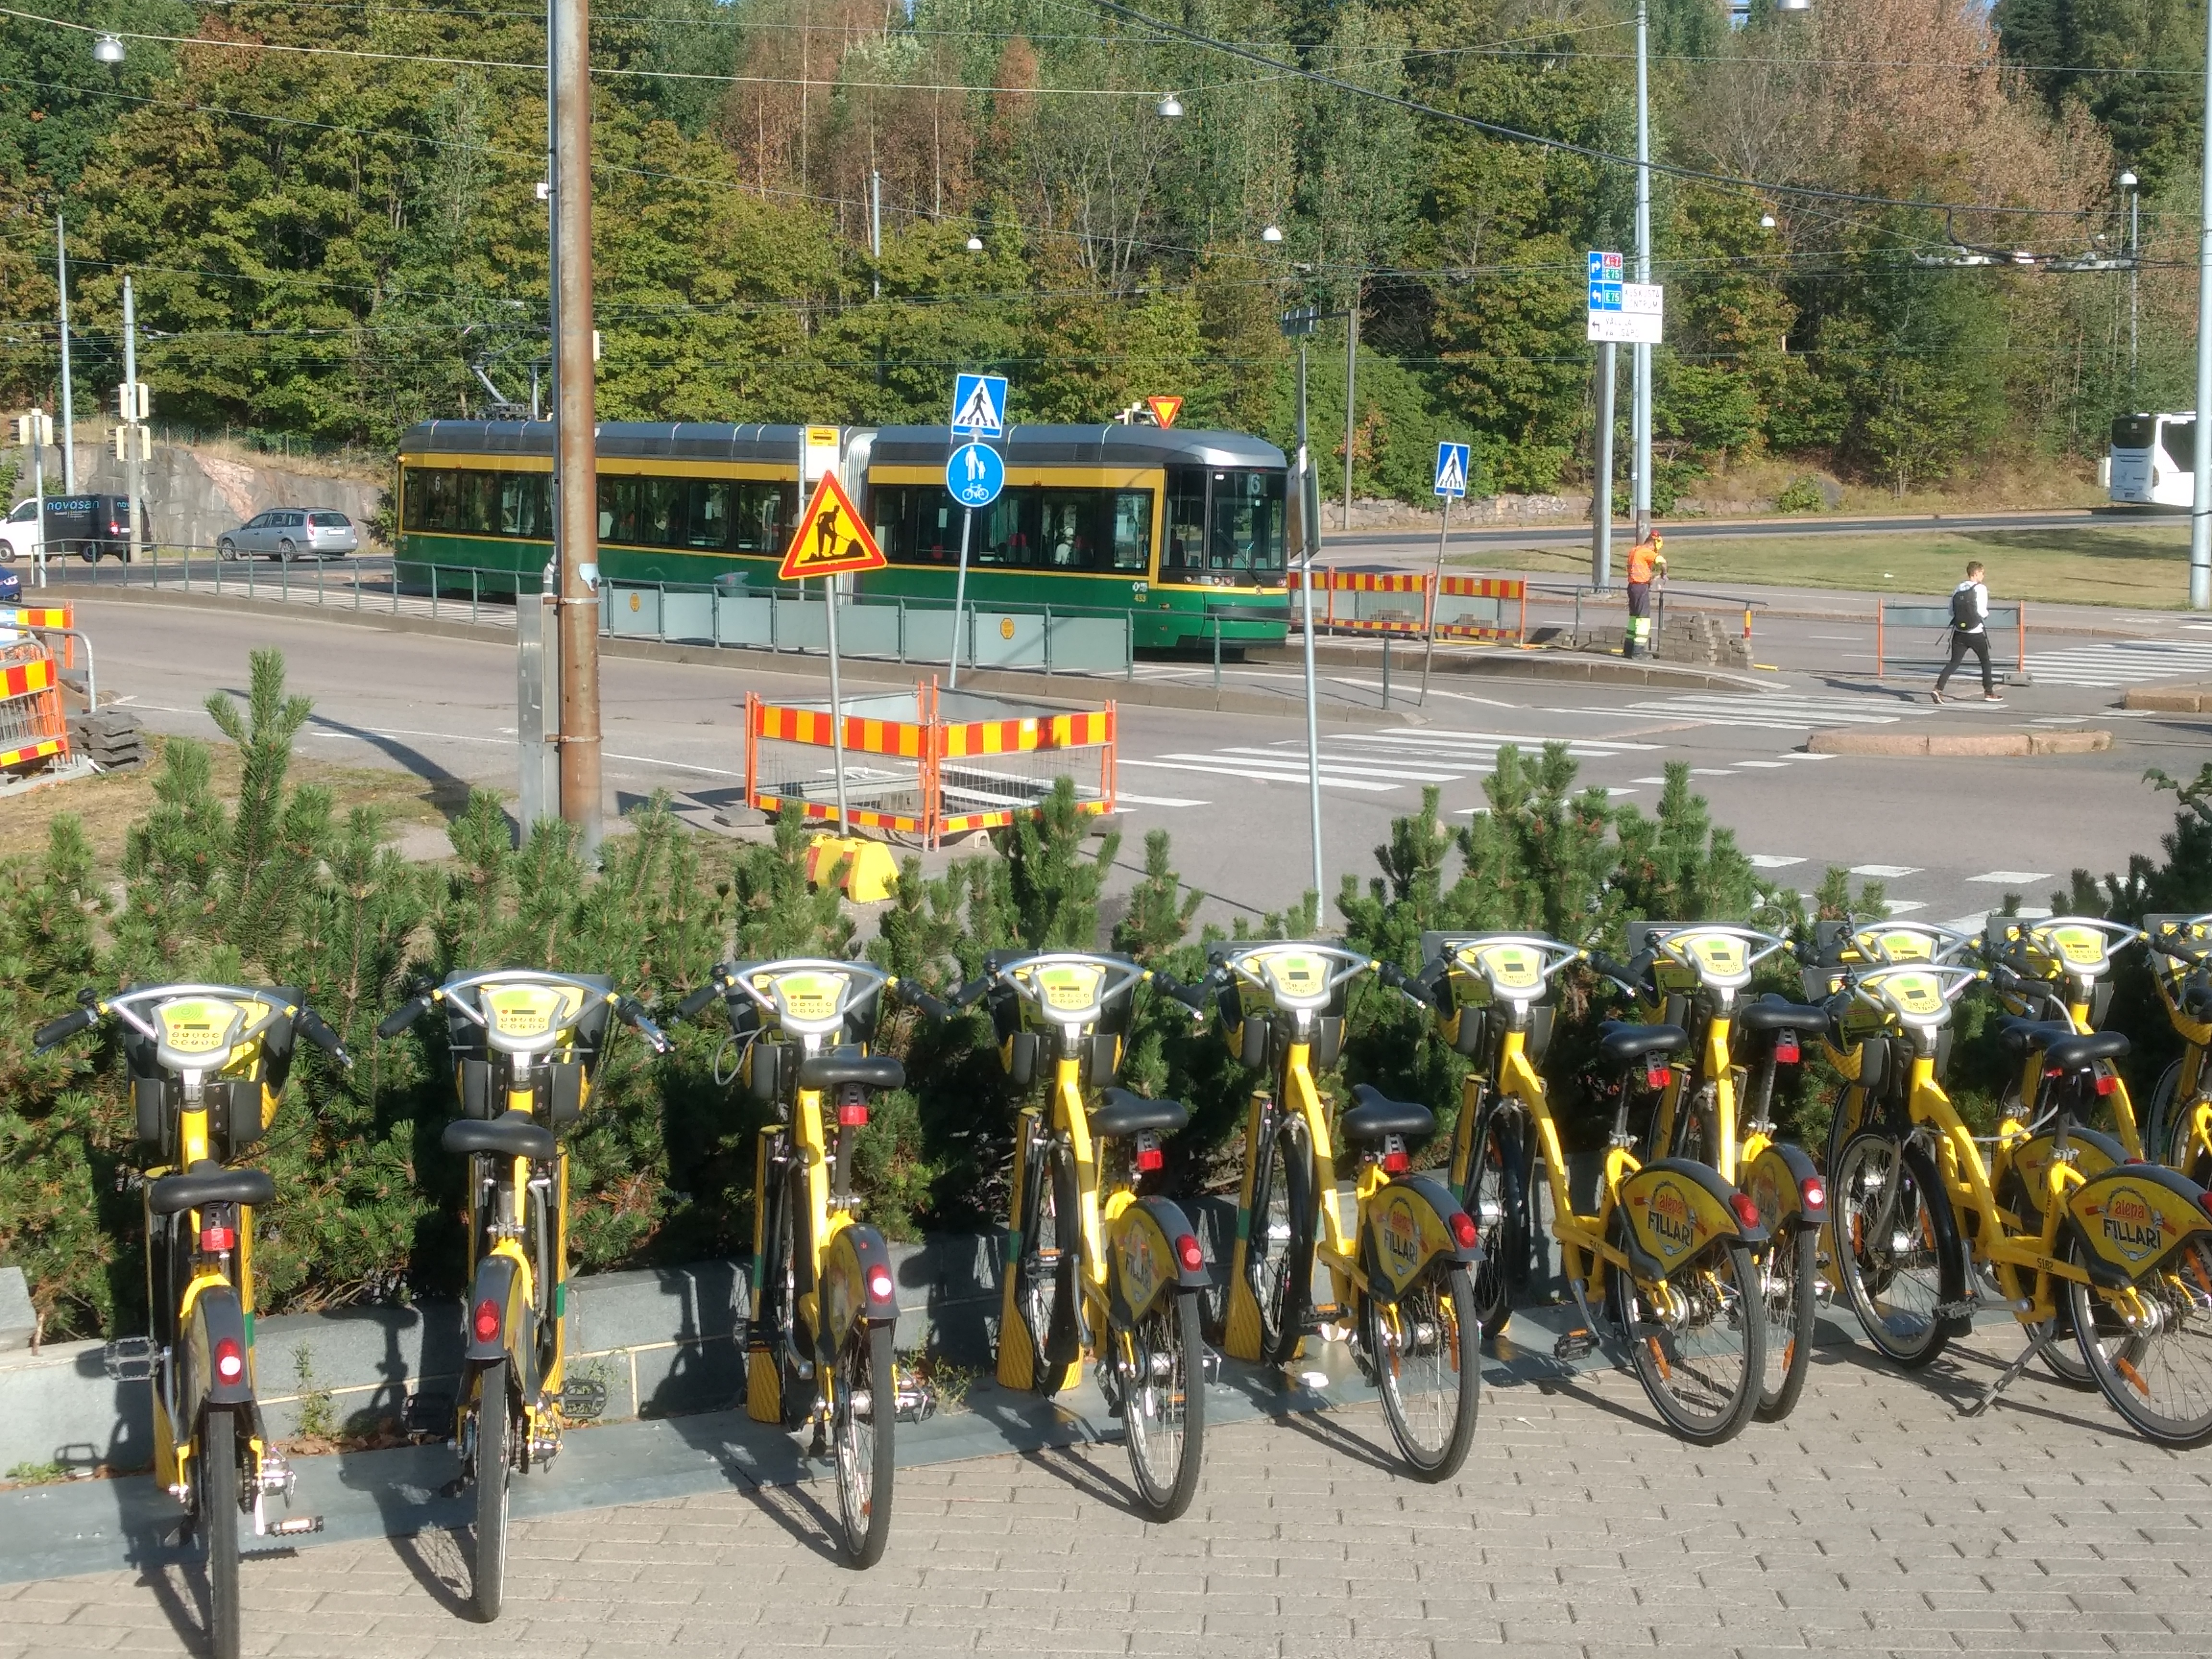
The users of the popular local bike-sharing system in Helsinki are mainly young adults and living in the downtown shows my recently finished master’s thesis. Almost 80 % of the trips were made by the users who were living in a postal area with at least one bike station in 2017, which shows how the service has been embraced especially by those living in the central ares of Helsinki.
The new bike-sharing season is here again and the system coverage are has expanded In Helsinki! Bike-sharing systems have become popular and attracted wide interest in Finland and elsewhere in recent years. Many cities have employed shared bikes, which aim to provide new mobility option for citizens. Shared bikes are also strongly linking to targets to increase the share of sustainable travel modes in cities, which partly explains their enthusiastic reception by many.
My master’s thesis titled as ”Bike sharing as part of urban mobility in Helsinki – A user perspective”, which examined bike-sharing users is now accepted and published. The work, accepted with the highest grade, focused on bike-sharing users, usage patterns and how equally the system is serving the citizens. The aim of the work was to bring new information to support planning and development of the bike-sharing systems in Helsinki and elsewhere. I used a data set provided by Helsinki Region Transport and City Bike Finland, which contained all the bike-sharing trips (~1.5 million) from 2017. Before the data analysis, I had systematically reviewed almost 800 scientific articles focusing on bike sharing.
Internationally, bike-sharing system have been hugely popular and in the public discussion, the systems are often covered positively. Meanwhile, there has been critique in the scientific literature that shared bikes would only be serving certain population groups. This contradiction got me interested in to examine the local users in Helsinki more closely.
The study showed that in Helsinki, the use of bike-sharing system has been internationally high. Young adults are emphasized in the user base and especially when comparing by the number of trips, male users are over represented. Compared to regular cycling, the profile of bike-sharing users is less diverse than among all cyclists in Helsinki. Most of use is generated by those, who have a bike-sharing station in their neighborhood. The usage patterns of these users are also different compared to those who are living outside the station coverage area. For example, the users living outside the area have significantly higher shares of potential public transport integrated trips on average. Use activity and the subscription type were also found to be important factors shaping usage patterns.
The study also showed that bike-sharing systems have been actively and extensively studied. However, the study areas seemed to be concentrated to cities where bike-sharing data were available. This observation highlights the role and the need for open data in studying new mobility modes.
The upcoming summer will be interesting from my results’ perspective now when the bike-sharing system area in Helsinki expands. It remains to be seen whether the over-represented user groups were only more eager to quickly embrace the new system in 2017 or whether the same usage patterns still prevail after the expansion. From the equity perspective, the bike-sharing system will be now available to a larger group of citizens better than before. Young adults have found the system well, but it is important to pay attention that shared bikes and cycling are being promoted among the whole population to better advance and increase their role as part of sustainable urban mobility.
Registration links to the accepted participants have been sent via email!
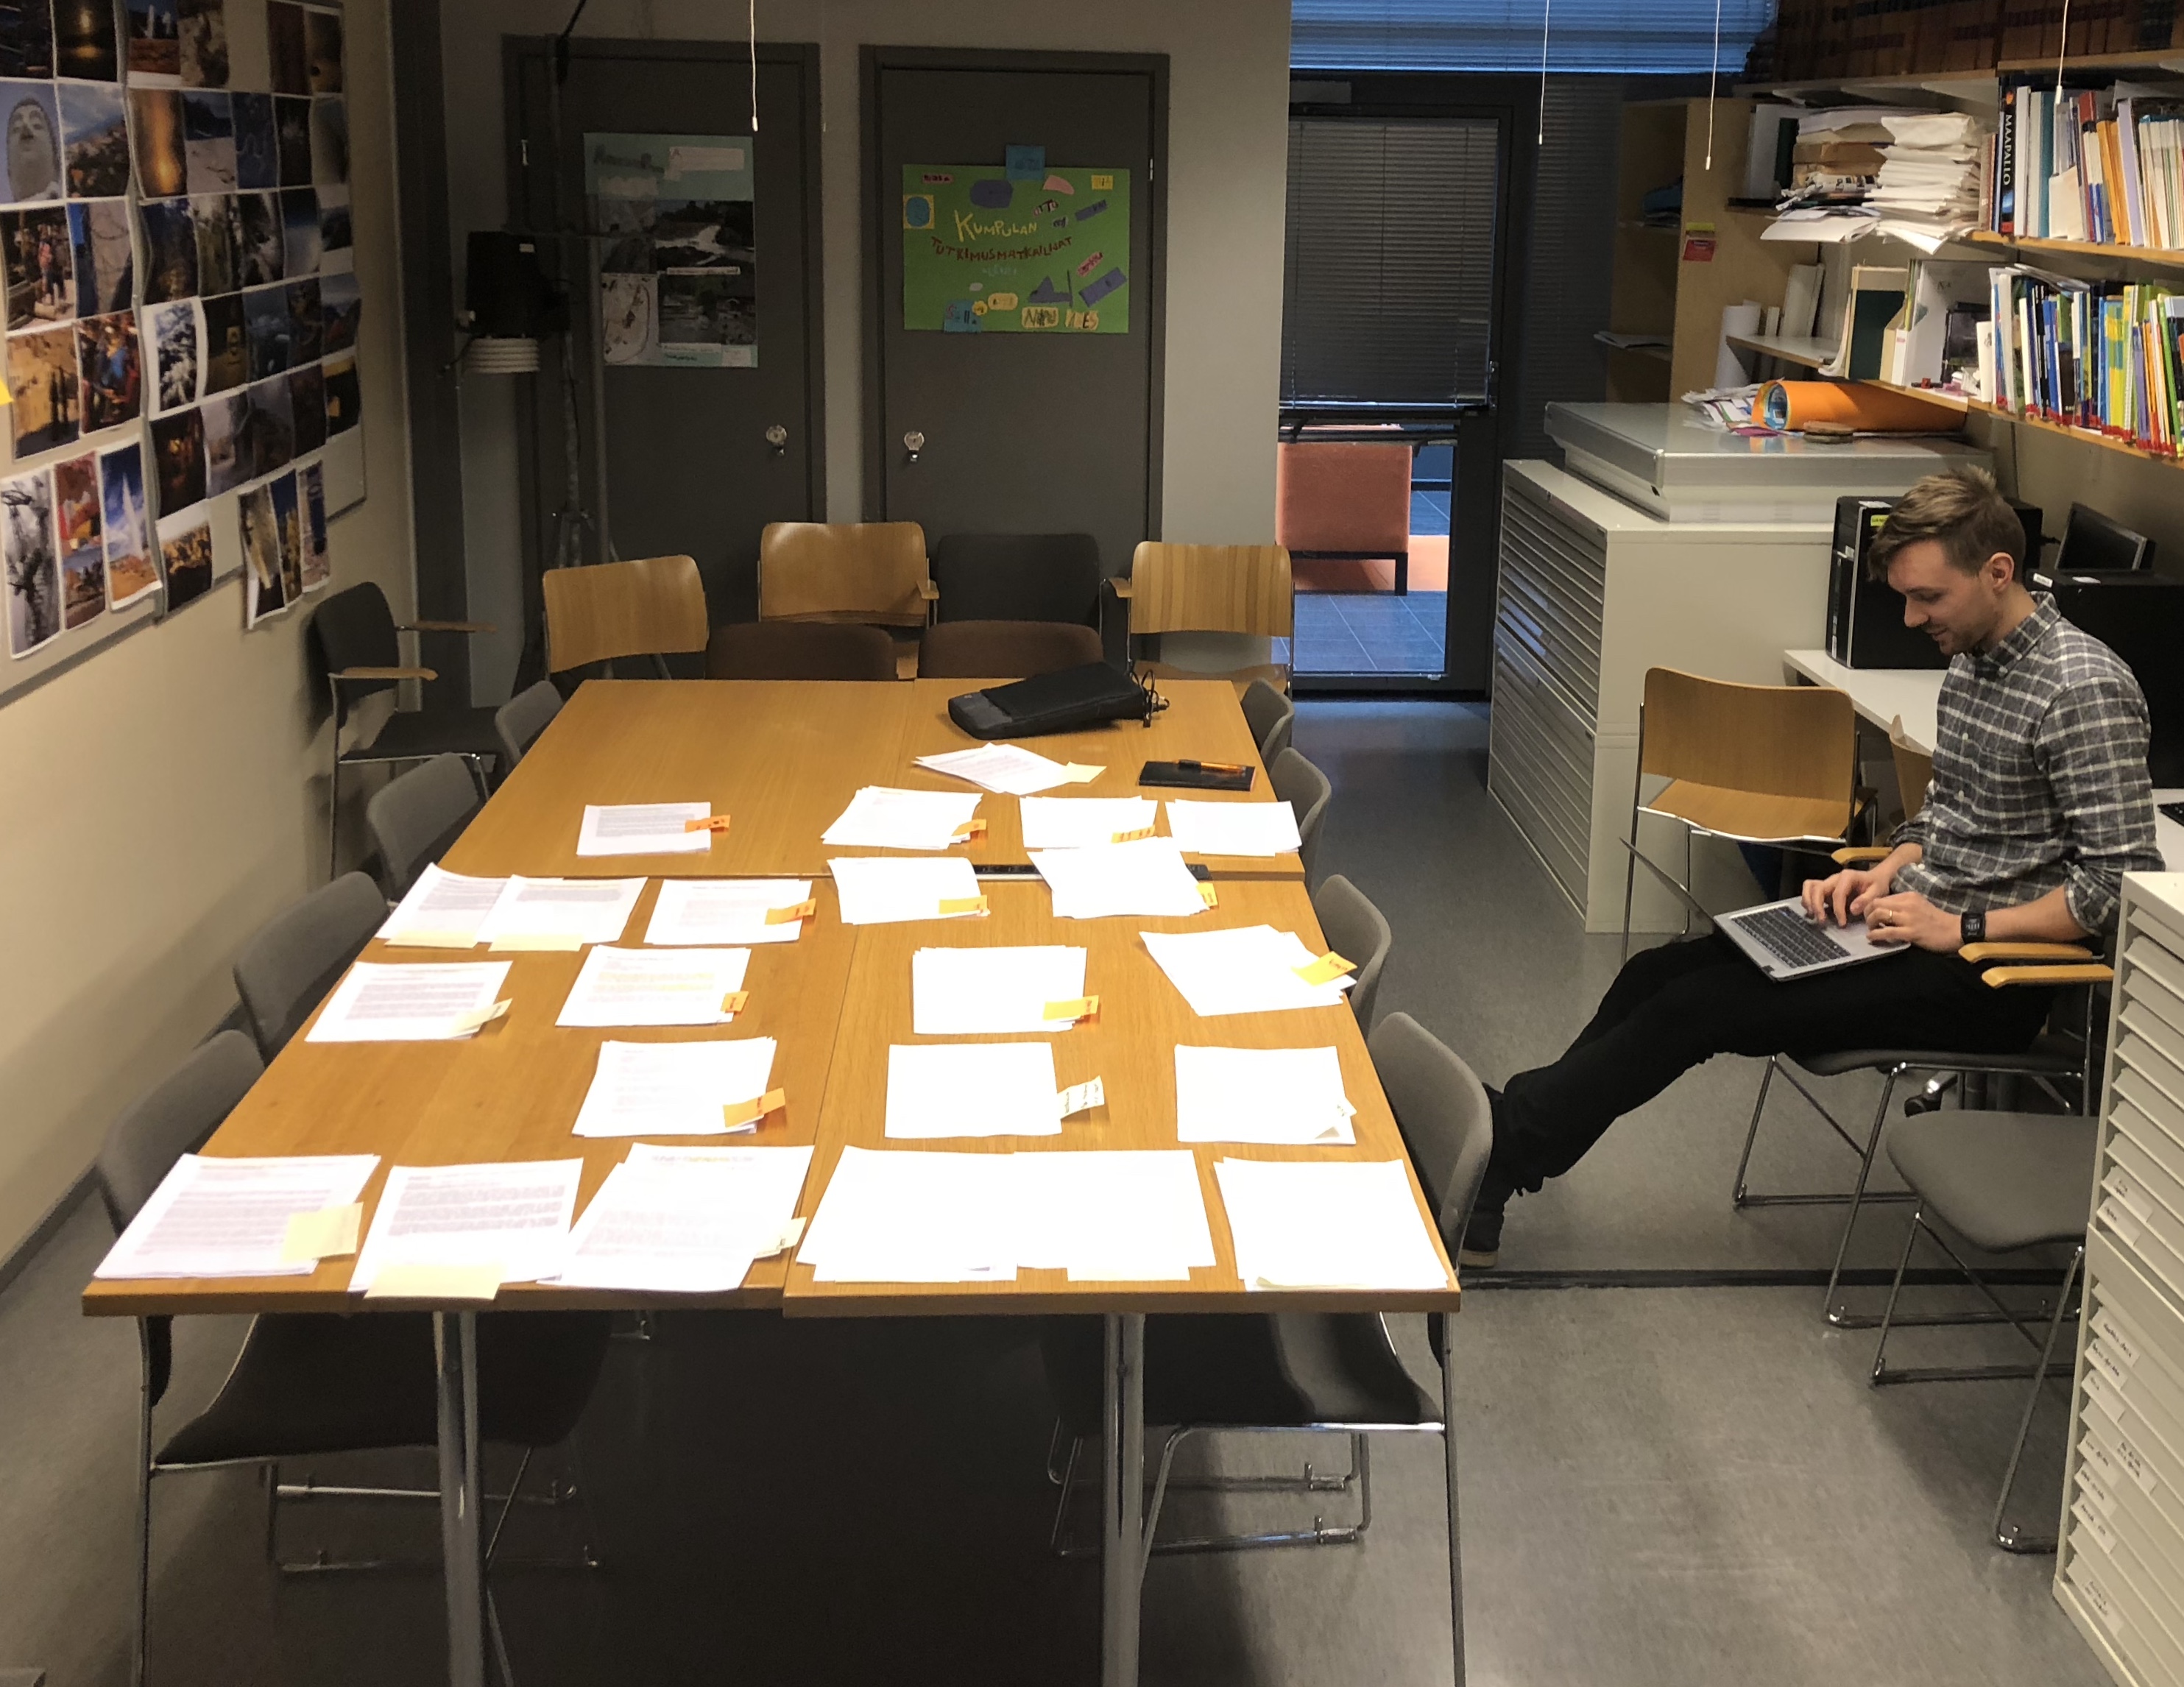
There was a great deal of high-quality abstracts and the selection process was certainly not easy. The selection was done based the scope of the abstract, scientific quality, NECTAR membership and the possibility to fit the presentation in a coherent conference session. The sheer number of papers challenged us, but as the picture shows by sticking with the good old pen and paper style we were able to handle the task!
Call for papers for NECTAR 2019 conference is now open!
Digital Geography Lab and University of Helsinki will organize an international NECTAR conference (5.-7. June 2019) in Helsinki together with the Aalto University, Urbaria and the City of Helsinki. NECTAR is a scientific research network concerned with transport and communication issues and the biannual conference brings together transport and mobility experts all over Europe and elsewhere.
We have two fantastic key note speakers in the conference, professors Jan Gehl from Denmark and Tim Schwanen from Oxford, UK.
The call for papers for the NECTAR 2019 conference has now opened, and closes on 21.1.2019.
The theme of the conference is “Towards Human Scale Cities – Open and Happy”. The conference calls for presentations on advancements in the field of transport, communication and mobility. The focus of the conference will be on urban transportation and the new possibilities that open data and digital technologies provide for mobility solutions. For example, presentations may discuss how transport policies are and should be changing, present emerging ways of organizing the daily mobility to make cities more sustainable and more pleasant or present novel ways of analyzing transportation and mobility from the perspective of people.