Open spatial data reveals 24-hour population dynamics of people in Helsinki Metropolitan Area

Press release

The researchers of the Digital Geography Lab at the University of Helsinki have published spatial data describing the daily rhythms in the population distribution in the Helsinki Metropolitan Area as open data.

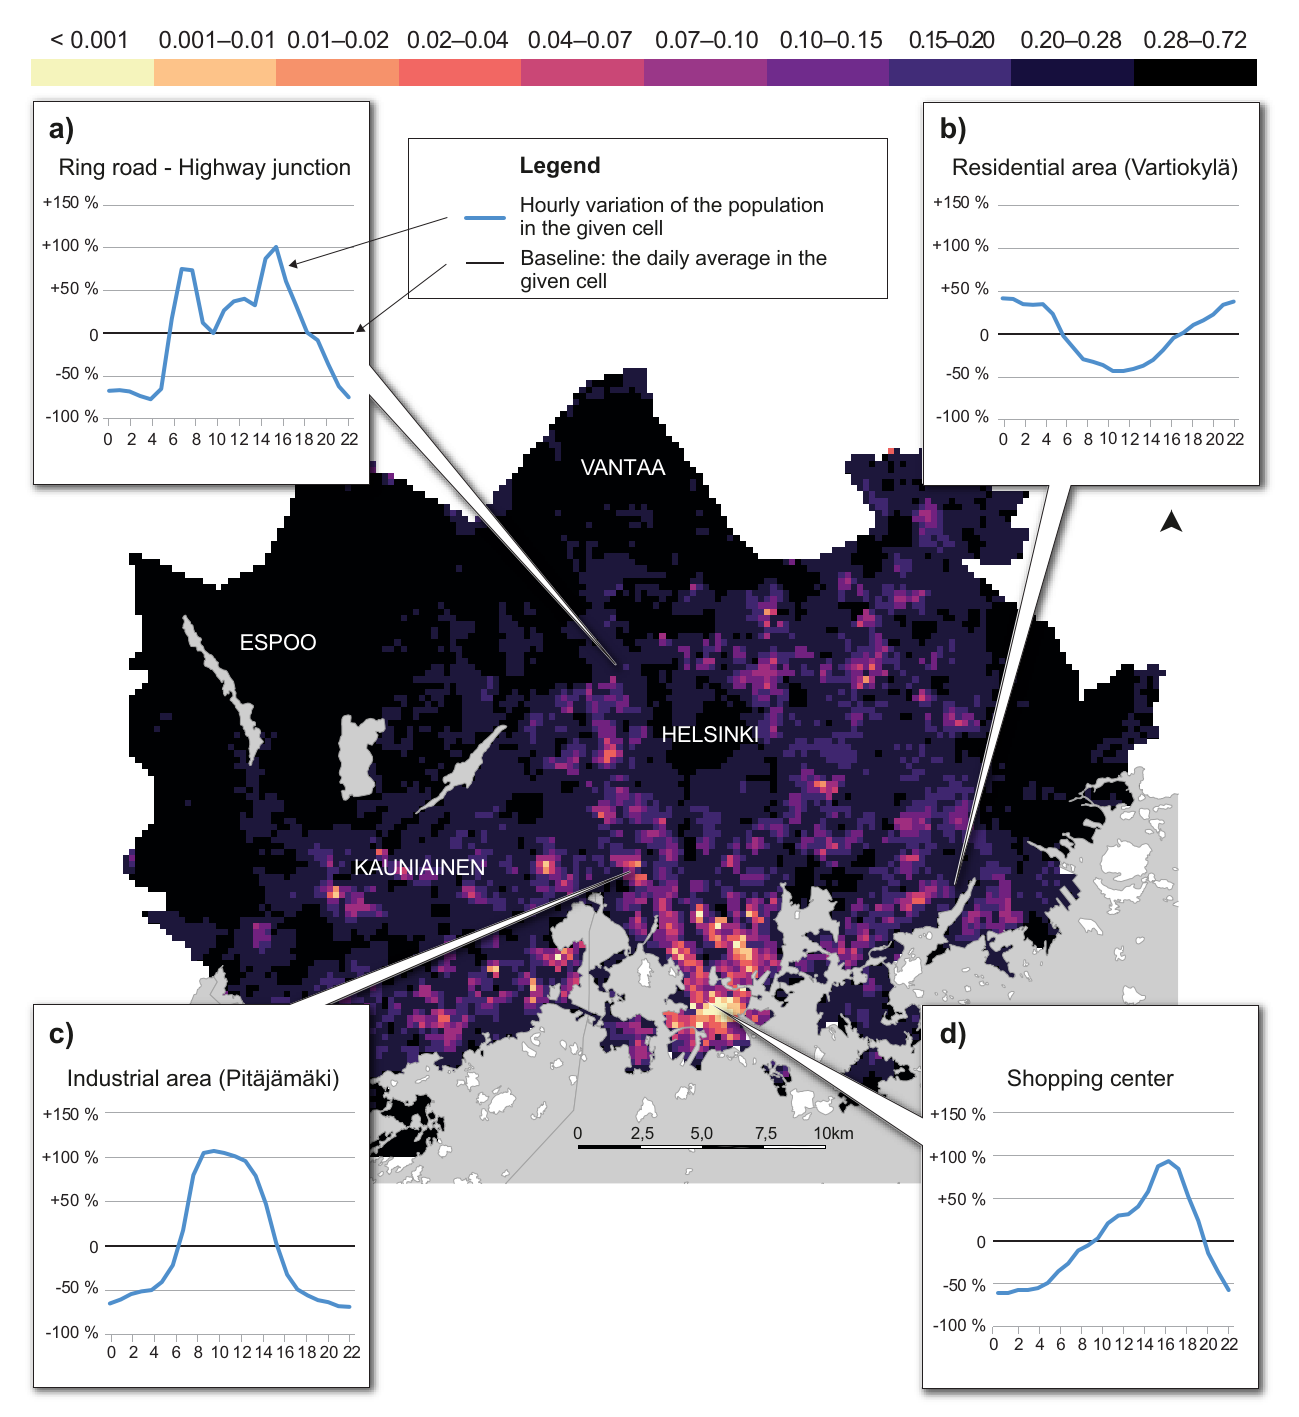
Spatial population distribution in the Helsinki Metropolitan Area between 11-12 AM on a regular workday. The diagrams show the variation of the population in given locations during 24 hours from the daily average. (Bergroth et al. 2022)

Their article in the journal Scientific Data describes how the data set was created based on mobile phone data, and how it can be used. This is one of the first times that detailed dynamic population data is released openly for any city of the world. Continue reading “Open spatial data reveals 24-hour population dynamics of people in Helsinki Metropolitan Area”

OptiSS 🧐 — A tool to optimize spatial joining of social media data

Authors: Bryan Vallejo, Olle Järv

We developed the OptiSS tool to optimize geodetic spatial joining for assigning geographical attributes to social media data in the BORDERSPACE project at the Digital Geography Lab. The tool has a user-friendly local app, yet its Python script can be easily used in any workflow.

Why we developed the tool?

In the BORDERSPACE project, we need to assign hierarchical spatial attributes (municipality, region, country) to each geo-located tweet. Mostly, geo-located tweets obtained from Twitter’s API already have geographical information such as an administrative unit and a country, in addition to exact coordinates. Yet, not all tweets have such information and, most importantly, some tweets are not located on land – some are just off the coast or somewhere at sea (Figure 1). However, geodetic spatial joining requires computational resources and is time consuming, especially when we have 100+ million geo-located tweets to handle. Thus, we created the OptiSS tool to make computation more efficient. The tool works for any social media data that have at least geographical coordinates.

Figure 1. The OptiSS tool assigns geographical attributes like municipality or country efficiently to social media posts. This is useful particularly when posts are not only located on land, but also off the coast (highlighted in red circles). Continue reading “OptiSS 🧐 — A tool to optimize spatial joining of social media data”

New project revealing multi-local living from electricity data has taken off

Authors: Janika Raun, Olle Järv

The Digital Geography Lab is taking part in the MOPA-project (Monipaikkaisen asumisen rytmit, paikat ja asiakasryhmät) to analyse the spatiotemporal patterns of second home use and its users from electricity consumption data. The project is led by the researchers from the Ruralia Institute.

Why and what we study?

The recent Covid-19 pandemic has rapidly increased the number of people spending time and working remotely in their second homes. Thus, second home tourism is increasingly blending with multi-local living – people are residing in several homes and moving often between them. To understand those dynamic changes in mobility patterns new data sources are needed, because the traditional methods cannot fully grasp the rapid changes in second home use, neither provide timeliness information for stakeholders to quickly adopt. During the last decade, mobility studies in general, have widely taken advantage of the use of different big data sets to understand human mobility. However, there is little research carried out that utilizes big data in second home research.

The aim of the MOPA project is to use primarily electricity consumption data to understand the spatiotemporal mobility patterns to second homes and distinguish between different user groups based on the consumption patterns. The data is provided by the electricity company Suur-Sävon Sähko Oy about the South Savo region that is one of the well-known second home hotspots in Finland. We also use aggregated mobile phone data to evaluate how well electricity consumption data properties reveal the presence of people. Continue reading “New project revealing multi-local living from electricity data has taken off”

MSc thesis on capturing the mobility of minority language groups in Finland using Twitter data

Author: Emil Ehnström

Why study the spatial mobility of language minorities?

People are increasingly more mobile that has led to a more complex world. One outcome of this is the linguistic diversification of societies, which has raised the issue of language groups’ integration to a society, but also of their transnationality while people in their new society are still connected to their previous society and culture. One way to understand people’s connectedness to their origin society and integration to their host society is to study their mobility patterns. With novel data sources, like geo-located social media data, it is possible to acquire information on both cross-border and local mobility patterns of language groups.

The three language groups studied in my thesis have different characteristics. Swedish is a national language of Finland and Swedish speakers are generally considered an integral part of Finnish society. Russian speakers have arrived in Finland during multiple time periods, but significantly more since the 1990s during the immigration of the Ingrian-rooted people from the former Soviet Union. Therefore, Russian speakers form a rather heterogeneous language group in Finland. Estonian speakers started moving to Finland since the 1990s and in particular after Estonia joined the EU and the Finnish labour market became more accessible for Estonians. As Estonia and Finland are geographically close, people from Estonia have moved to Finland mainly due to work, while keeping tight connections to Estonia. This has hindered them from fully integrating to the Finnish society. Continue reading “MSc thesis on capturing the mobility of minority language groups in Finland using Twitter data”

Creating knowledge about exercising in the Helsinki Metropolitan Area using Twitter data

Sonja Koivisto introduces her MSc thesis

Why study exercising with social media data?

Sports and exercising are an integral part of a healthy lifestyle. Keeping oneself active is known to prevent obesity and the risk of many chronic diseases. Globally, inactivity is the fourth most common cause of death. The Finnish government has acknowledged the importance of the issue by stating three objectives for encouraging exercise and supporting sports in the current government programme.

There is surprisingly little spatial research about sports in different parts of the Helsinki Metropolitan Area. Only a few sports facilities collect visitors’ statistics and often this information is not openly available. Therefore, I decided to study the topic using social media data. I wanted to find out how people exercise in different parts of the Metropolitan Area and which spatial factors affect the number of sports-related posts.

According to Statistics Finland, 80% of Finns use social media. Among people under 45-years-old, the number is over 95%. People post to social media about topics and activities that are close to their hearts, like sports for instance. The most popular social media platforms in Finland are WhatsApp, Facebook and Instagram. However, these platforms do not share their data for research purposes unlike microblogging platform Twitter. Twitter is used by 10% of Finns. Continue reading “Creating knowledge about exercising in the Helsinki Metropolitan Area using Twitter data”

Understanding functional cross-border regions from Twitter data: The Nordics case study

Håvard Wallin Aagesen introduces his MSc thesis

How can Twitter data be used to study cross-border regions in the Nordics? And how are the effects of the COVID-19 pandemic reflected in the spatial pattern of Twitter usage? These were some of the questions that Håvard Wallin Aagesen, a fresh PhD candidate at the Digital Geography Lab, addressed in his MSc thesis “Understanding Functional Cross-border Regions from Twitter Data in the Nordics“. In this blog post, Håvard looks back to and summarizes his MSc work.

Why this matters?

As part of the BORDERSPACE project, I set out to investigate how cross-border interactions in the Nordic countries can be studied, using Big Data from Twitter. In light of the COVID-19 pandemic, a newfound need for studying cross-border flows has arisen, and Twitter data could provide the possibility to quickly and easily explore the changes in human mobility patterns before and during the pandemic.

The Nordic region is a connected region with a long history of cooperation, shared cultures, and social and economic interactions. Cross-border cooperation and cross-border mobility has been a central aspect in the region for over half a century. Despite of shared borders and all countries being part of the Schengen Area, allowing free movement, little research has been made on the extent of daily cross-border movements and little data exist on the topic.

Continue reading “Understanding functional cross-border regions from Twitter data: The Nordics case study”