Writer: Saara Kekki
Previously, Justin wrote about searching for archival records, and Olli wrote about the detective work involved in finding some of the Sugar Island Finns in Finland. In this post, I will talk about what comes next, how to structure, clean, and verify the data we found.

The foundation of our data are the United States census records, which have been collected every ten years since 1790. The purpose of the census has historically been to map the white population of the United States, but we want to emphasize that on Sugar Island, the Chippewa are the original inhabitants and formed the original community. Census taking on Sugar Island, nevertheless, didn’t start until 1860 when the white population had been large and steady enough to be of interest to the authorities. Native Americans, in general, became a part of census-taking around the same time and appear in the Sugar Island census records as well.
All United States census records become public after 72 years (the “72-year-rule”), which means that we currently have access to all census records from 1860 up to 1940. The 1890 census records are largely missing because of a fire that ravaged the building housing the records in 1921. Those records are available, for example, on Ancestry.com for a fee. Ancestry has done the preliminary work by creating text tables of the originally hand-written images, which we could download as Excel spreadsheets.
In mapping the Sugar Island population, my first task was to determine, which individuals appeared in more than one census. I started with the 1860 census with 239 names. I gave each individual an individual number and identified family members as either spouse or child based on their grouping in the original census. In this first census, people were not yet identified in terms of relationship to the head of household. Family number given by the original census enumerator is the only way of knowing who formed a family. In subsequent census questionnaires, people were identified as “head,” “wife,” “daughter,” “son,” or “mother,” for example. There were also “boarders” and “housekeepers” among the relationships.
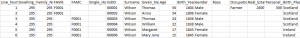
For example, the very first individual in the first-ever Sugar Island census was a man named Thomas Wilson, from now on I00001. His family, which was numbered 295, consisted of himself, a woman around the same age, and four younger people between 15 and 24 years of age. Thus, I assumed the woman, Anna, to be Thomas’s wife and the four others to be their unmarried children. Thomas and Anna were bound as spouses with a family (FAMS) ID, F0001. The children, in turn, were added as children (FAMC) with the same family ID. Here, I had my first Sugar Island family. Altogether, the first census had 53 families.
This first census was of course very straightforward—just consecutive numbers starting with number 1. For the next census year, 1870, I had to keep the previous dataset open, and look for familiar names in addition to identifying new individuals. By comparing not only the names of individuals but also of their family members, and by looking at birth years and places, I was slowly able to go through all 8 censuses, ending with I02952 (Richard Lundquist) and F0519. In other words, we have a collection of almost 3,000 individuals and over 500 families.
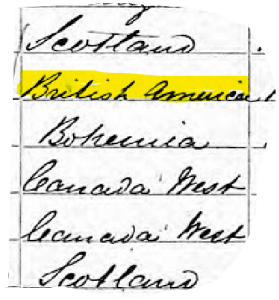
As was the case with the Finns, here, too, names varied considerably. Sometimes it was perhaps due to the enumerator’s inability to spell French or Native American names. At other times, the errors had clearly taken place when entering handwritten text into the typed table. This was not only true of names but of other information as well. For example, the 1870 census lists 15 “Armenians,” which sounded quite surprising. Upon closer investigation of the original images, the text turned out to be “British American”! I interpret this simply as a distinction from the many Scottish, Irish, and French-speaking Canadian people also listed in the census.
Similarly, in 1910, a group of “mulattoes” (a racial category used at the time for mixed race individuals) appeared, leading this researcher to think about the Great Migration of African Americans. This time, there was no connection to national events, but rather, the misreading of an ornate “W” (for white) as an “M” (for mulatto).
Examples like these remind us that we have to be careful in our interpretation of data. If something strikes as odd, it is more likely an error in the data than a mysterious turn in history. That being said, cleaning the census tables has given me plenty to think about when going forward in our investigation of the Sugar Island community. In my next post, I’ll share some of my thoughts about the development of the community based on the census data.